| Param | Original file | Final file |
|---|---|---|
| Filename | modeM0/AS1C09_011T06_9000006490_53213cztM0_level2.fits | modeM0/AS1C09_011T06_9000006490_53213cztM0_level2_quad_clean.evt |
| Size (bytes) | 986,875,200 | 89,700,480 |
| Size | 941.2 MB | 85.5 MB |
| Events in quadrant A | 4,703,797 | 690,882 |
| Events in quadrant B | 4,810,702 | 731,374 |
| Events in quadrant C | 12,343,356 | 381,201 |
| Events in quadrant D | 14,078,812 | 376,867 |
| Mode SS | |||
|---|---|---|---|
| Quadrant | BADHDUFLAG | Total packets | Discarded packets |
| A | 0 | 154 | 0 |
| B | 0 | 154 | 0 |
| C | 0 | 154 | 0 |
| D | 0 | 154 | 0 |
| Mode M0 | |||
|---|---|---|---|
| Quadrant | BADHDUFLAG | Total packets | Discarded packets |
| A | 0 | 19766 | 0 |
| B | 0 | 20071 | 0 |
| C | 0 | 42039 | 0 |
| D | 0 | 47164 | 0 |
| Quadrant | Total seconds | Saturated seconds | Saturation percentage |
|---|---|---|---|
| A | 7693 | 295 | 3.834655% |
| B | 7694 | 391 | 5.081882% |
| C | 7694 | 3512 | 45.645958% |
| D | 7694 | 3457 | 44.931115% |
Noise dominated data is calculated using 1-second bins in cleaned event files. If a bin has >2000 counts, and if more than 50% of those come from <1% of pixels, then it is considered to be noise-dominated and hence unusable.
| Quadrant | # 1 sec bins | Bins with >0 counts | Bins with >2000 counts | High rate bins dominated by noise | Noise dominated (total time) | Noise dominated (detector-on time) | Marked lightcurve |
|---|---|---|---|---|---|---|---|
| A | 7693 | 7693 | 277 | 277 | 3.60% | 3.60% | 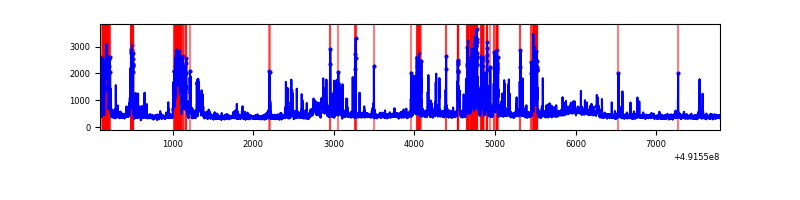 |
| B | 7694 | 7694 | 308 | 308 | 4.00% | 4.00% | 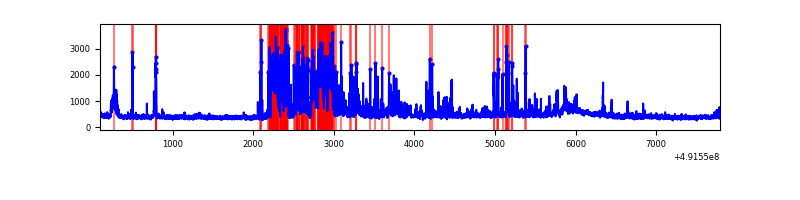 |
| C | 7694 | 7694 | 3287 | 3287 | 42.72% | 42.72% | 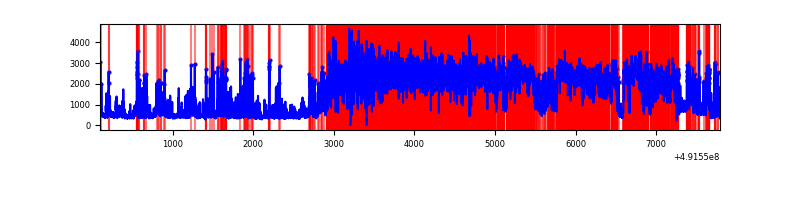 |
| D | 7694 | 7694 | 3629 | 3629 | 47.17% | 47.17% | 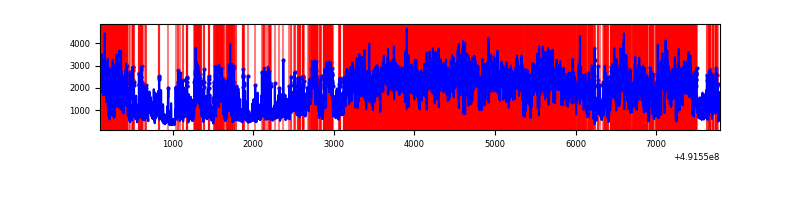 |
Top three noisy pixels from each quadrant. If the there are fewer than three noisy pixels in the level2.evt file, extra rows are filled as -1
| Pixel properties | Quadrant properties | ||||||
|---|---|---|---|---|---|---|---|
| Quadrant | DetID | PixID | Counts | Sigma | Mean | Median | Sigma |
| A | 3 | 62 | 1350565 | 7079.34 | 770 | 751 | 190.7 |
| A | 0 | 8 | 89282 | 464.32 | 770 | 751 | 190.7 |
| A | 4 | 249 | 66596 | 345.34 | 770 | 751 | 190.7 |
| B | 2 | 249 | 789160 | 4769.96 | 766 | 738 | 165.3 |
| B | 10 | 28 | 312226 | 1884.51 | 766 | 738 | 165.3 |
| B | 4 | 81 | 249209 | 1503.25 | 766 | 738 | 165.3 |
| C | 15 | 198 | 3885466 | 25486.81 | 554 | 549 | 152.4 |
| C | 1 | 241 | 3225675 | 21158.28 | 554 | 549 | 152.4 |
| C | 15 | 224 | 2408492 | 15797.19 | 554 | 549 | 152.4 |
| D | 15 | 125 | 10495544 | 59259.41 | 618 | 588 | 177.1 |
| D | 2 | 37 | 364318 | 2053.79 | 618 | 588 | 177.1 |
| D | 11 | 176 | 292160 | 1646.35 | 618 | 588 | 177.1 |
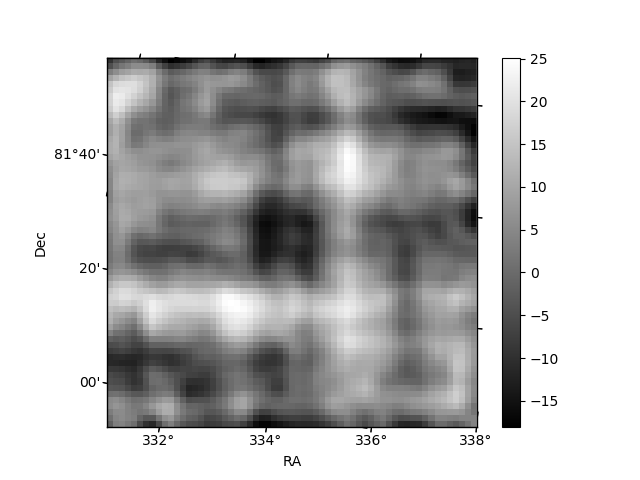
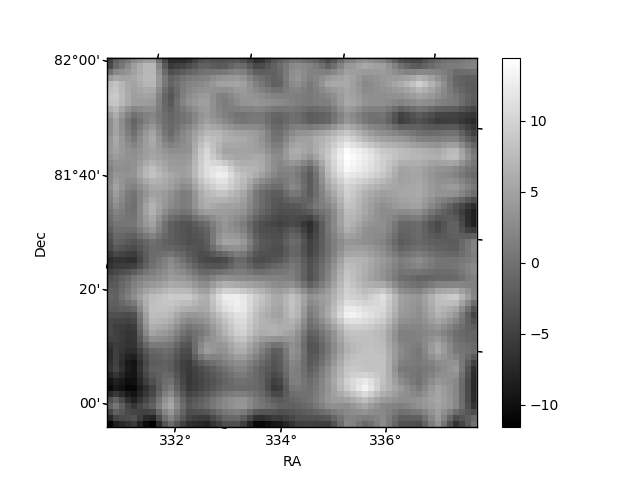
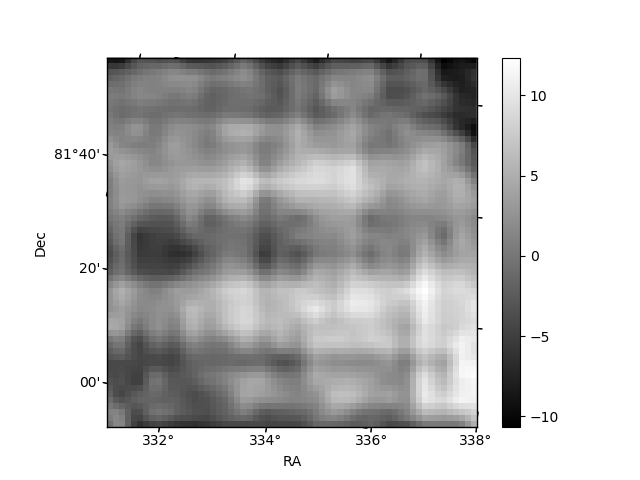
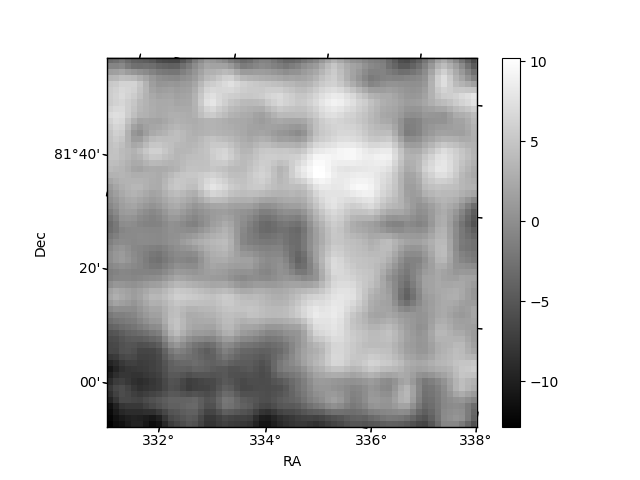
Histogram calculated using DETX and DETY for each event in the final _common_clean file
| Quadrant A | 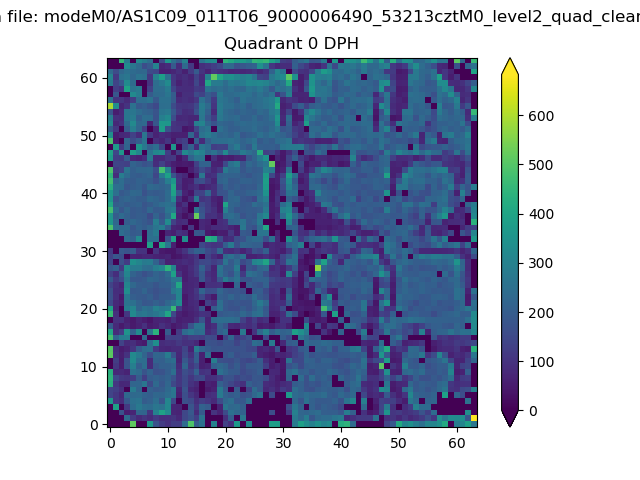 |
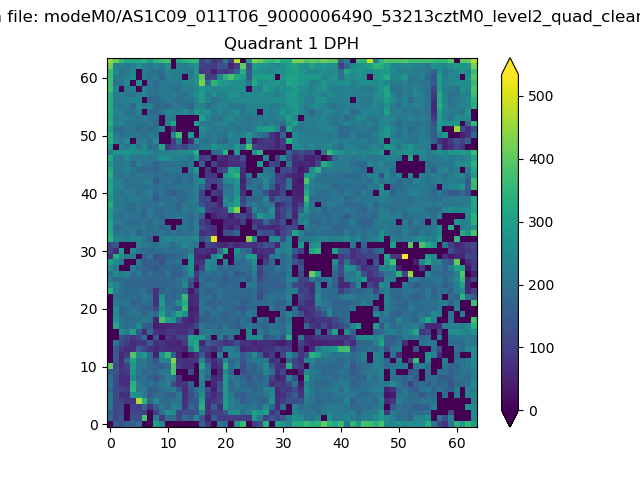 |
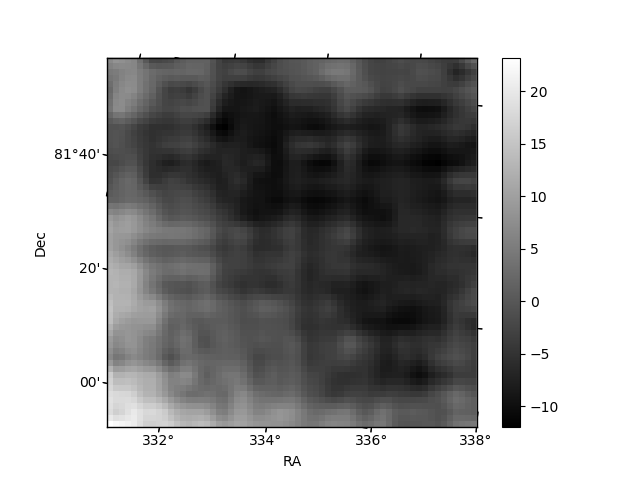
Quadrant B |
|---|---|---|---|
| Quadrant D | 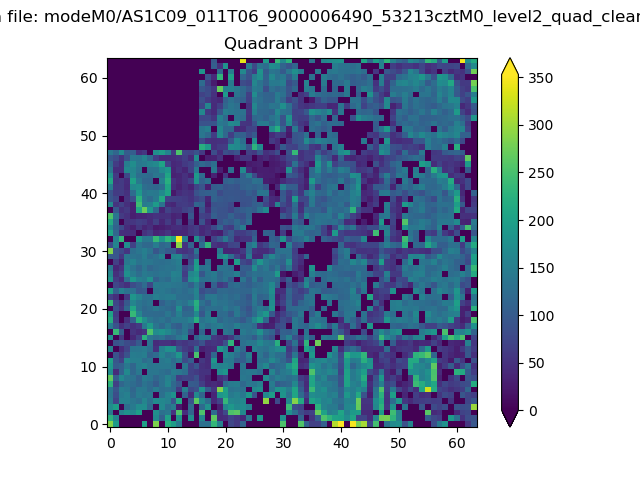 |
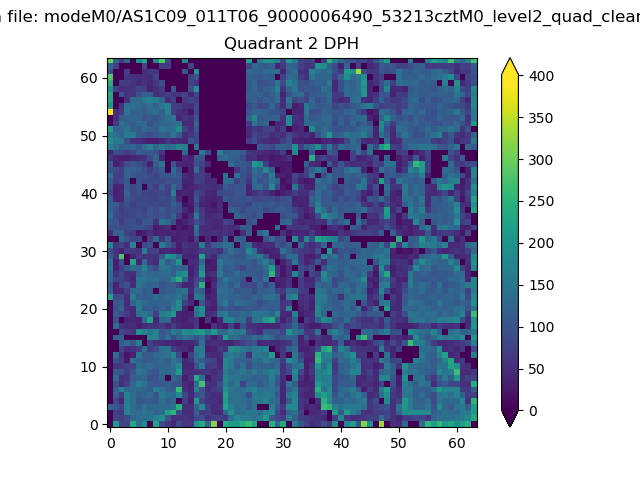 |
Quadrant C |
| Plot type | Count rate plots | Images |
|---|---|---|
| Comparison with Poisson distribution Blue bars denote a histogram of data divided into 1 sec bins. Red curve is a Poisson curve with rate = median count rate of data. |
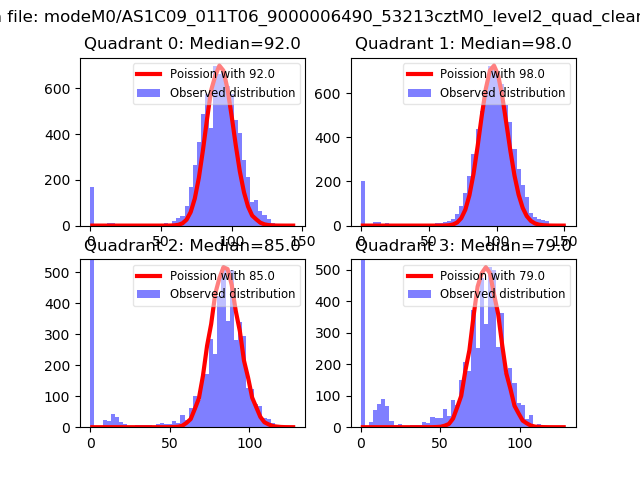 |
 |
| Quadrant-wise count rates Data is divided into 100 sec bins |
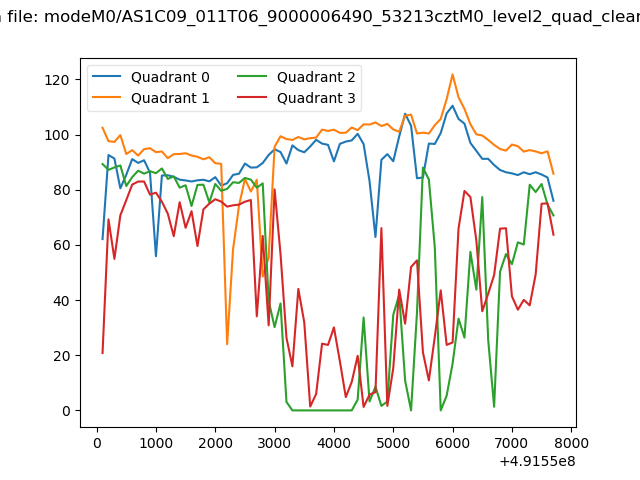 |
|
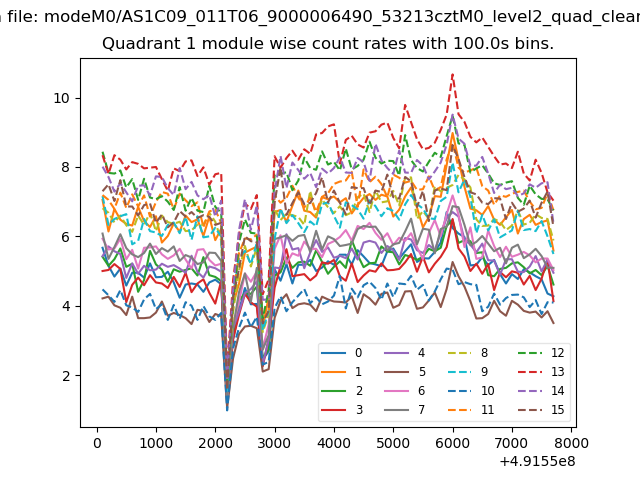
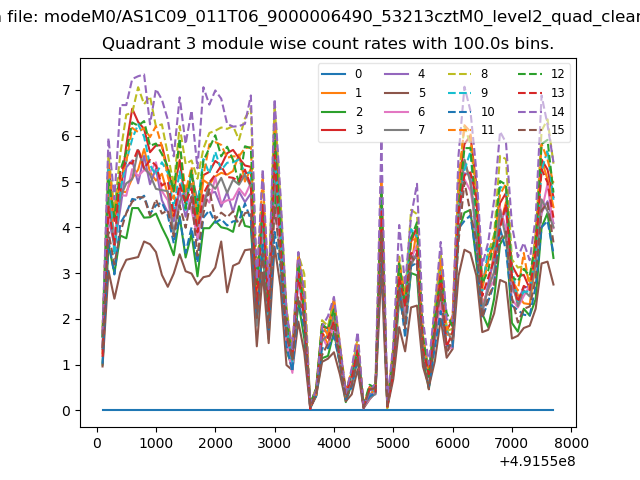
| Module-wise count rates for Quadrant A Data is divided into 100 sec bins |
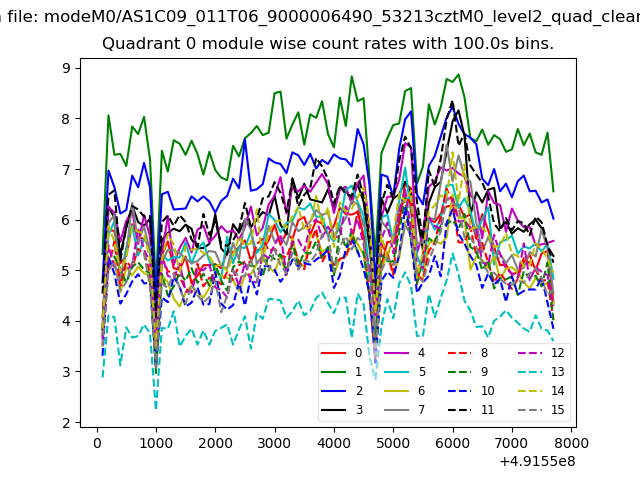 |
 |
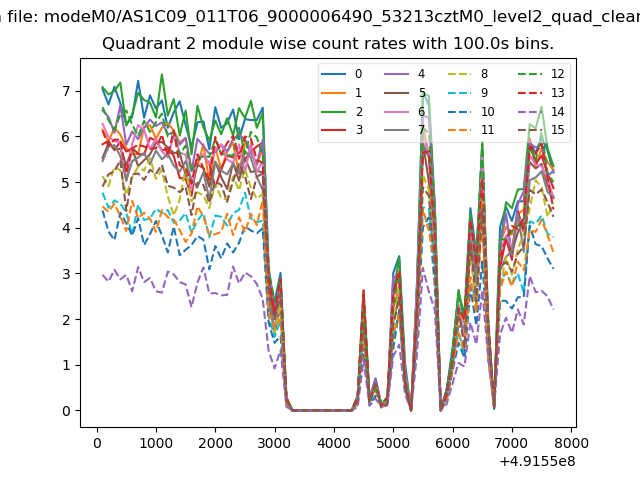
| Module-wise count rates for Quadrant B Data is divided into 100 sec bins |
 |
 |
| Module-wise count rates for Quadrant C Data is divided into 100 sec bins |
 |
 |
| Module-wise count rates for Quadrant D Data is divided into 100 sec bins |
 |
 |
| Parameter | Plot |
|---|---|
| CZT HV Monitor | 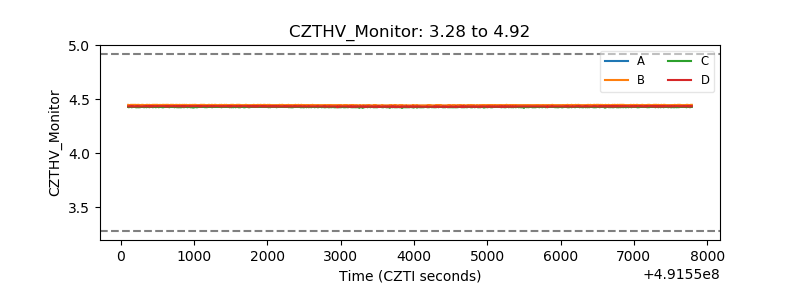 |
| D_VDD | 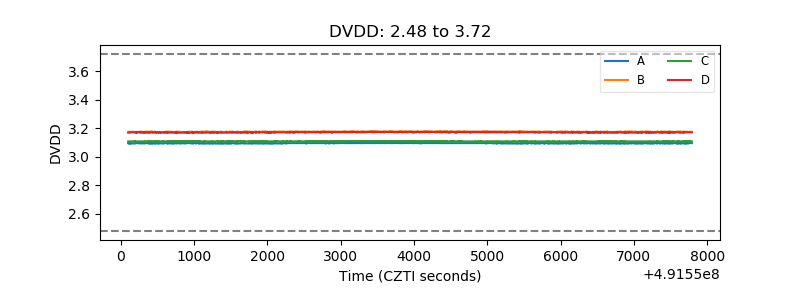 |
| Temperature 1 | 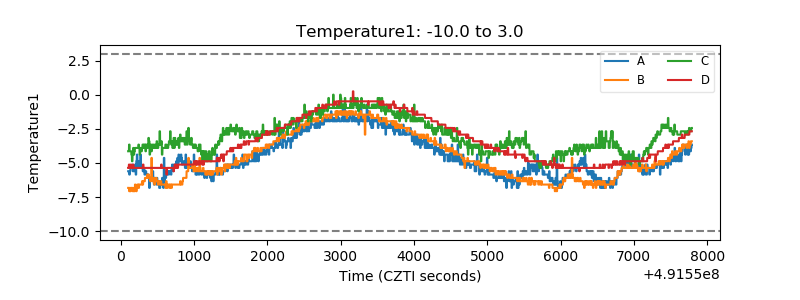 |
| Veto HV Monitor | 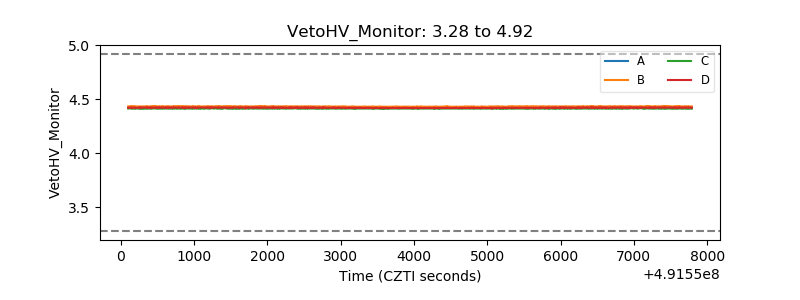 |
| Veto LLD | 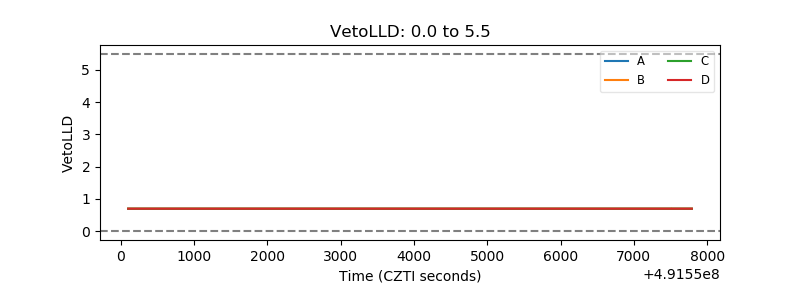 |
| Alpha Counter | 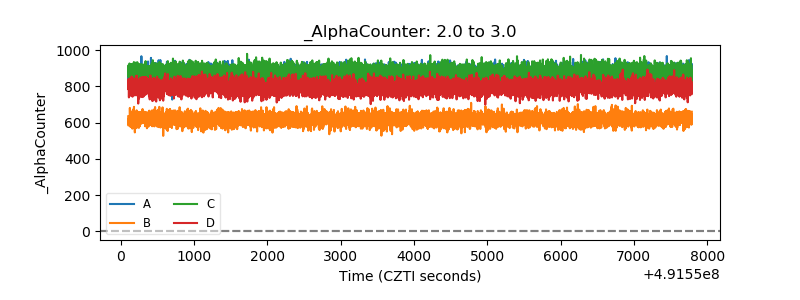 |
| _CPM_Rate | 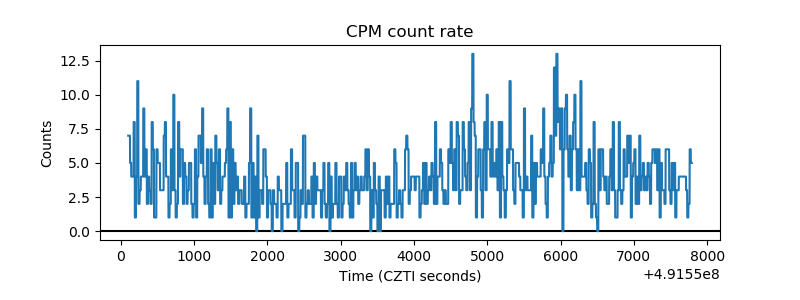 |
| CZT Counter |  |
| +2.5 Volts monitor |  |
| +5 Volts monitor |  |
| _ROLL_ROT | 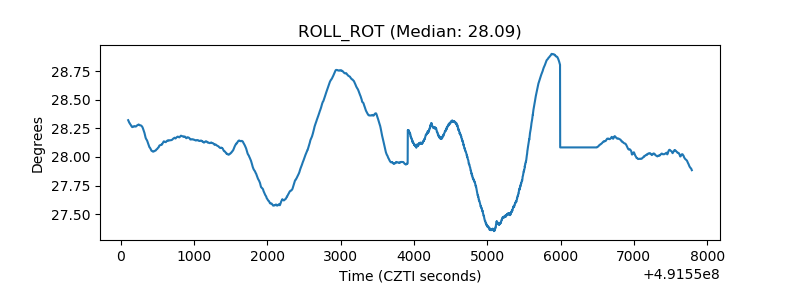 |
| _Roll_DEC | 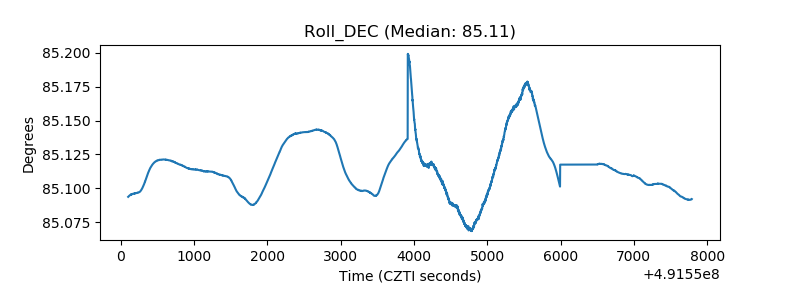 |
| _Roll_RA | 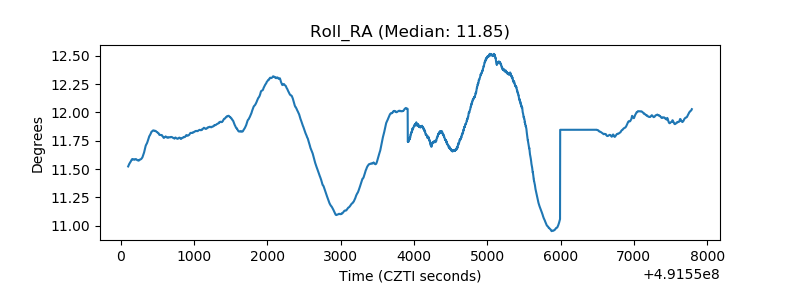 |
| Veto Counter | 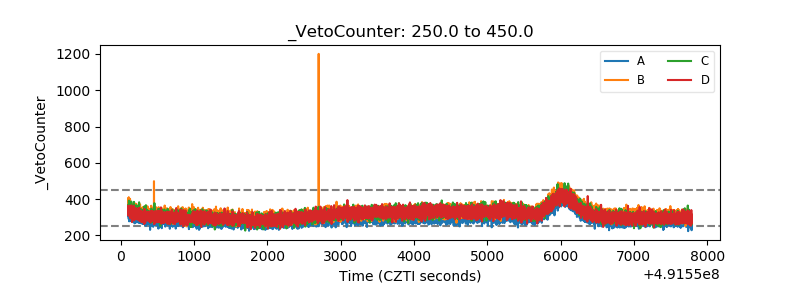 |