| Param | Original file | Final file |
|---|---|---|
| Filename | modeM0/AS1C09_011T06_9000006490_53214cztM0_level2.fits | modeM0/AS1C09_011T06_9000006490_53214cztM0_level2_quad_clean.evt |
| Size (bytes) | 1,011,142,080 | 86,575,680 |
| Size | 964.3 MB | 82.6 MB |
| Events in quadrant A | 3,888,988 | 687,568 |
| Events in quadrant B | 3,681,052 | 744,170 |
| Events in quadrant C | 15,942,157 | 244,046 |
| Events in quadrant D | 13,331,140 | 417,578 |
| Mode SS | |||
|---|---|---|---|
| Quadrant | BADHDUFLAG | Total packets | Discarded packets |
| A | 0 | 152 | 0 |
| B | 0 | 152 | 0 |
| C | 0 | 152 | 0 |
| D | 0 | 152 | 0 |
| Mode M0 | |||
|---|---|---|---|
| Quadrant | BADHDUFLAG | Total packets | Discarded packets |
| A | 0 | 17415 | 0 |
| B | 0 | 16611 | 0 |
| C | 0 | 52521 | 0 |
| D | 0 | 44843 | 10 |
| Quadrant | Total seconds | Saturated seconds | Saturation percentage |
|---|---|---|---|
| A | 7583 | 154 | 2.030858% |
| B | 7583 | 85 | 1.120928% |
| C | 7583 | 5006 | 66.016089% |
| D | 7581 | 2935 | 38.715209% |
Noise dominated data is calculated using 1-second bins in cleaned event files. If a bin has >2000 counts, and if more than 50% of those come from <1% of pixels, then it is considered to be noise-dominated and hence unusable.
| Quadrant | # 1 sec bins | Bins with >0 counts | Bins with >2000 counts | High rate bins dominated by noise | Noise dominated (total time) | Noise dominated (detector-on time) | Marked lightcurve |
|---|---|---|---|---|---|---|---|
| A | 7583 | 7583 | 134 | 134 | 1.77% | 1.77% | 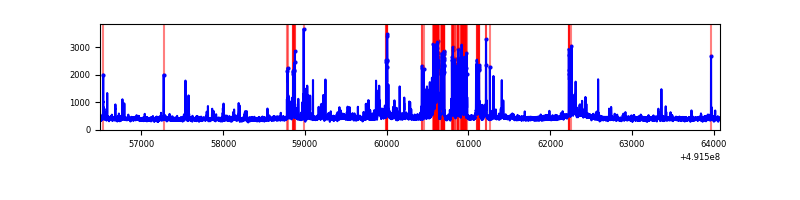 |
| B | 7583 | 7583 | 52 | 52 | 0.69% | 0.69% | 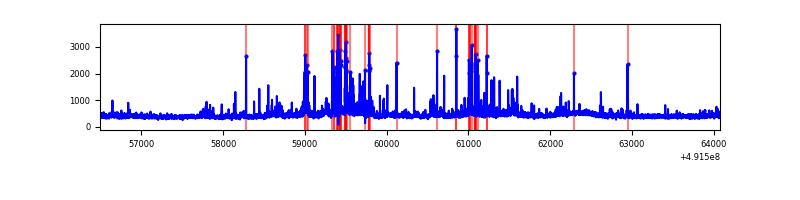 |
| C | 7583 | 7583 | 4848 | 4848 | 63.93% | 63.93% |  |
| D | 7583 | 7583 | 3131 | 3131 | 41.29% | 41.29% | 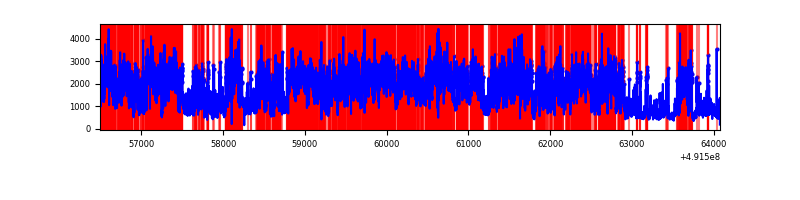 |
Top three noisy pixels from each quadrant. If the there are fewer than three noisy pixels in the level2.evt file, extra rows are filled as -1
| Pixel properties | Quadrant properties | ||||||
|---|---|---|---|---|---|---|---|
| Quadrant | DetID | PixID | Counts | Sigma | Mean | Median | Sigma |
| A | 3 | 62 | 613373 | 3226.58 | 762 | 743 | 189.9 |
| A | 15 | 174 | 79453 | 414.55 | 762 | 743 | 189.9 |
| A | 0 | 8 | 68527 | 357.0 | 762 | 743 | 189.9 |
| B | 2 | 249 | 207687 | 1269.22 | 759 | 734 | 163.1 |
| B | 4 | 81 | 88175 | 536.27 | 759 | 734 | 163.1 |
| B | 10 | 28 | 48923 | 295.54 | 759 | 734 | 163.1 |
| C | 1 | 241 | 4234909 | 34169.64 | 446 | 443 | 123.9 |
| C | 15 | 198 | 3847550 | 31043.88 | 446 | 443 | 123.9 |
| C | 15 | 165 | 3146818 | 25389.38 | 446 | 443 | 123.9 |
| D | 15 | 125 | 8549311 | 46743.04 | 632 | 605 | 182.9 |
| D | 2 | 37 | 1270442 | 6943.28 | 632 | 605 | 182.9 |
| D | 0 | 18 | 261642 | 1427.31 | 632 | 605 | 182.9 |
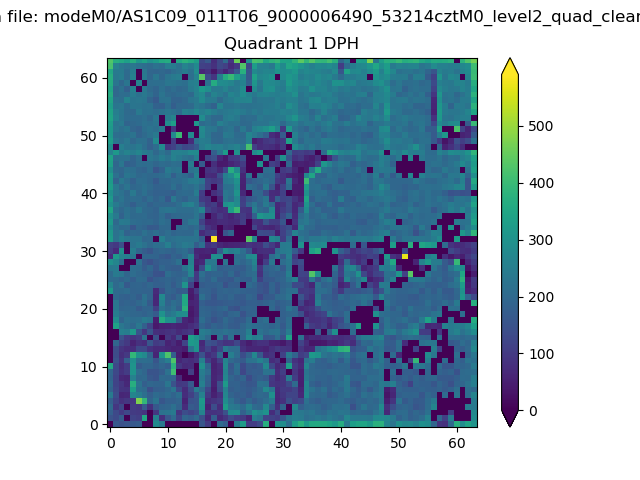
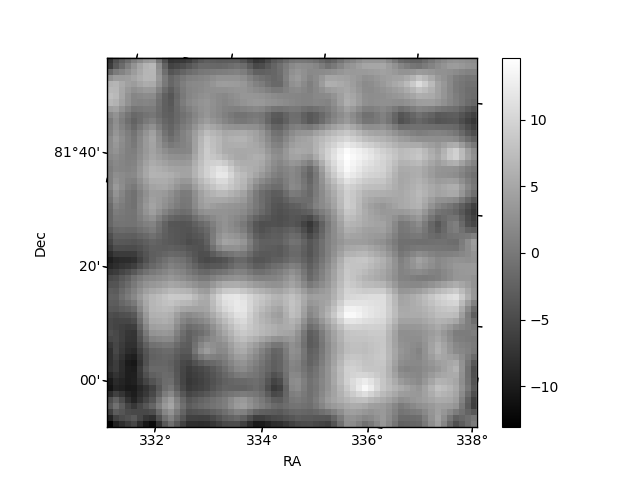
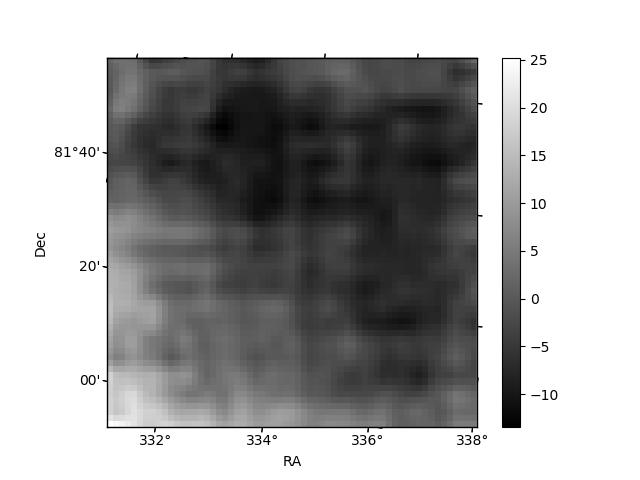
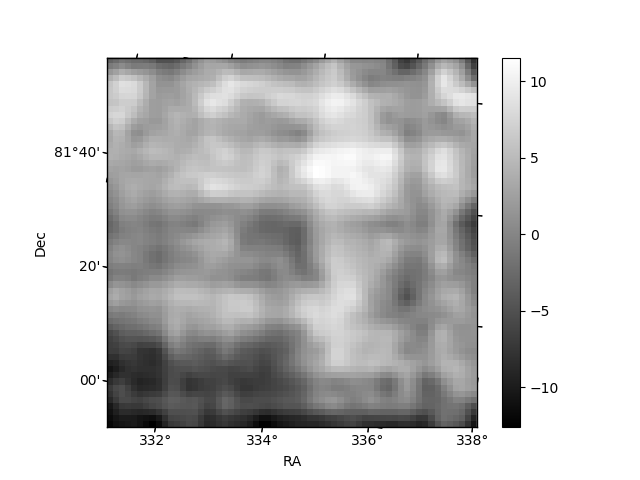
Histogram calculated using DETX and DETY for each event in the final _common_clean file
| Quadrant A | 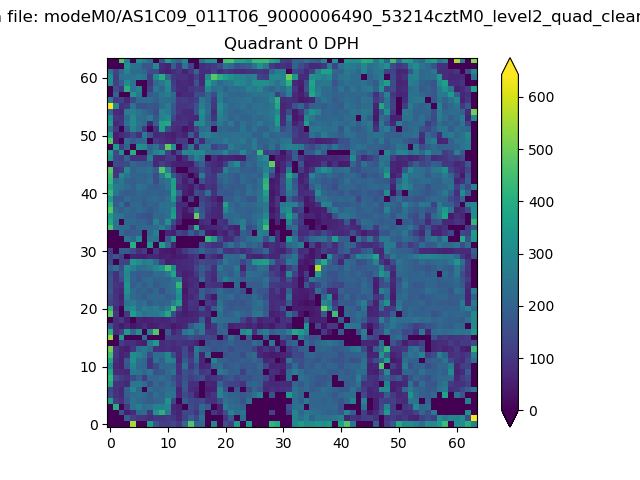 |
 |
Quadrant B |
|---|---|---|---|
| Quadrant D | 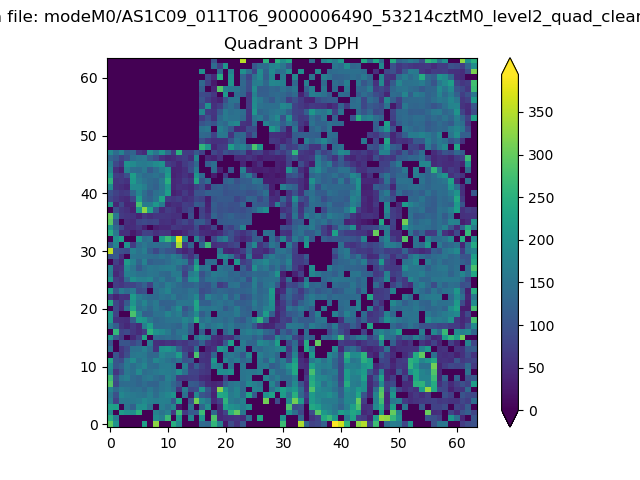 |
 |
Quadrant C |
| Plot type | Count rate plots | Images |
|---|---|---|
| Comparison with Poisson distribution Blue bars denote a histogram of data divided into 1 sec bins. Red curve is a Poisson curve with rate = median count rate of data. |
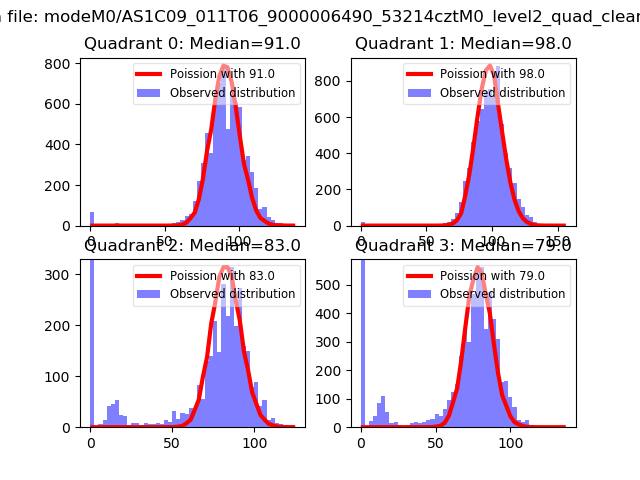 |
 |
| Quadrant-wise count rates Data is divided into 100 sec bins |
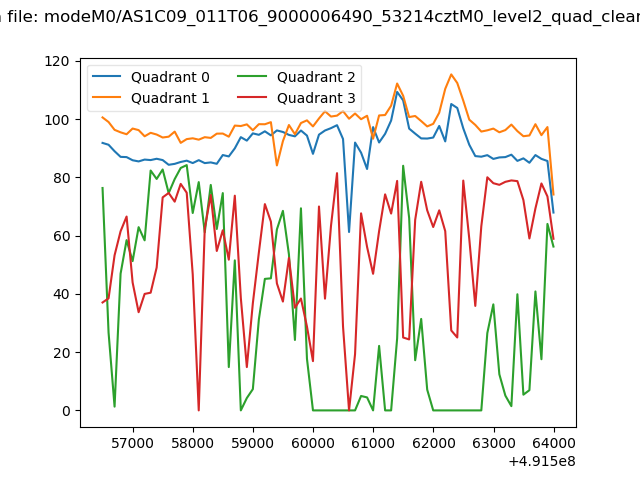 |
|
| Module-wise count rates for Quadrant A Data is divided into 100 sec bins |
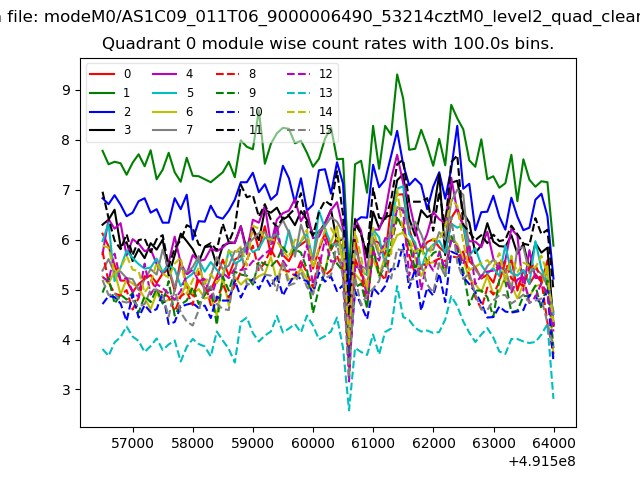 |
 |
| Module-wise count rates for Quadrant B Data is divided into 100 sec bins |
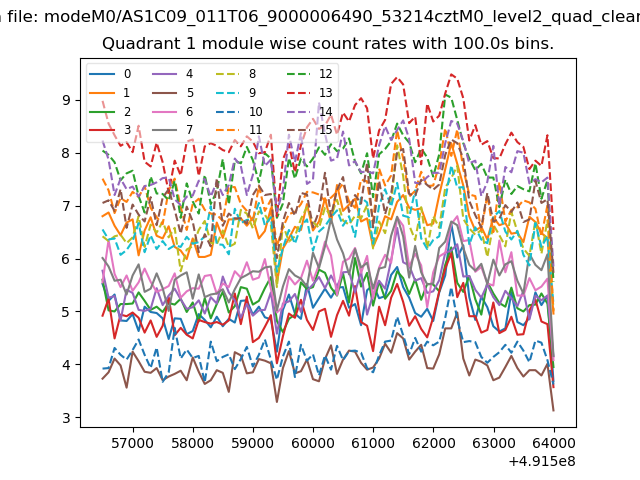 |
 |
| Module-wise count rates for Quadrant C Data is divided into 100 sec bins |
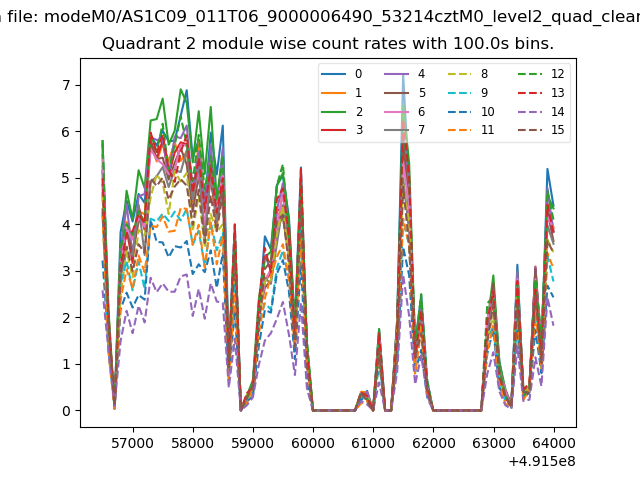 |
 |
| Module-wise count rates for Quadrant D Data is divided into 100 sec bins |
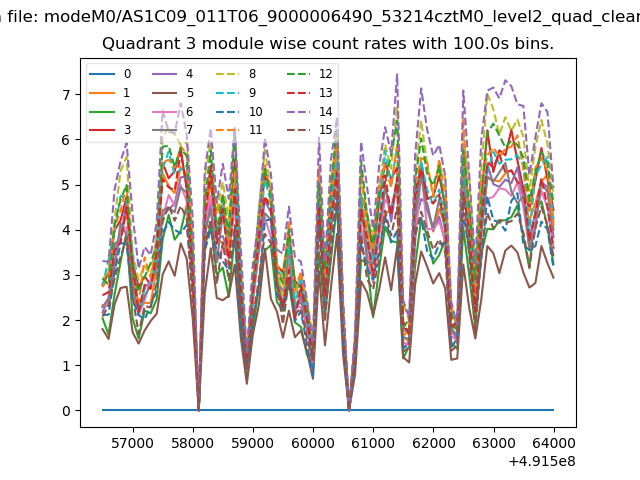 |
 |
| Parameter | Plot |
|---|---|
| CZT HV Monitor | 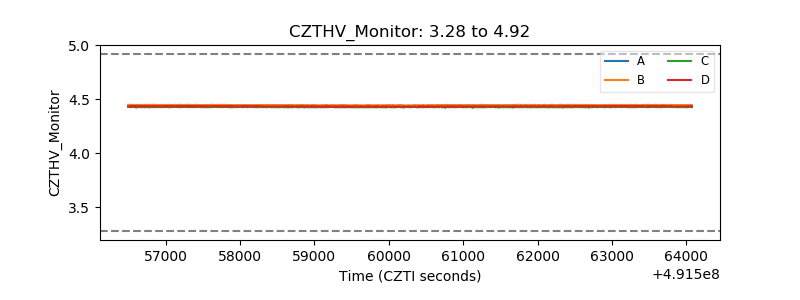 |
| D_VDD |  |
| Temperature 1 | 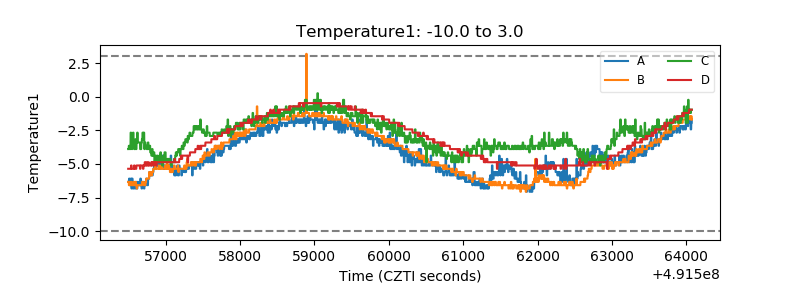 |
| Veto HV Monitor | 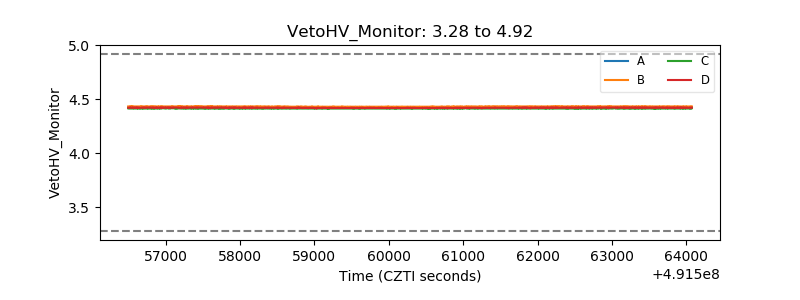 |
| Veto LLD | 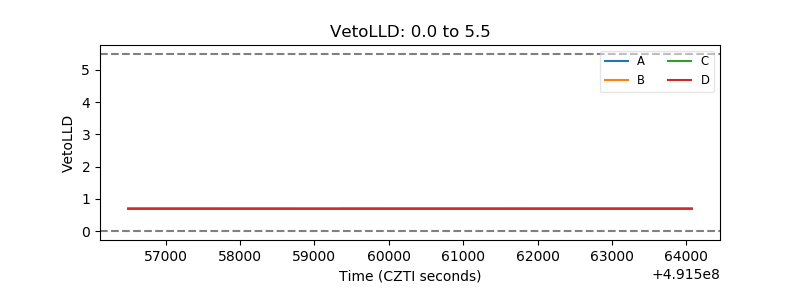 |
| Alpha Counter |  |
| _CPM_Rate | 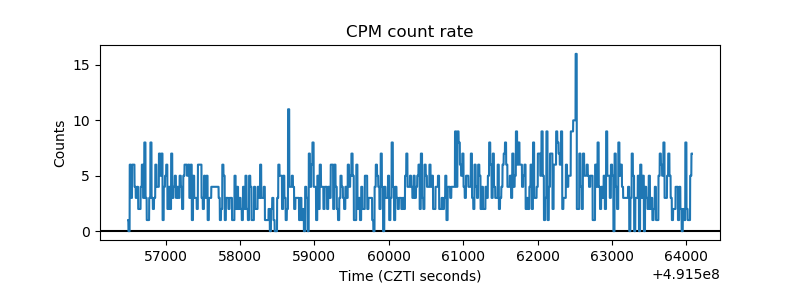 |
| CZT Counter | 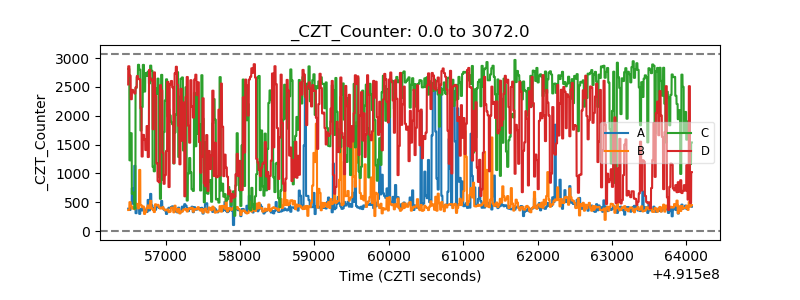 |
| +2.5 Volts monitor | 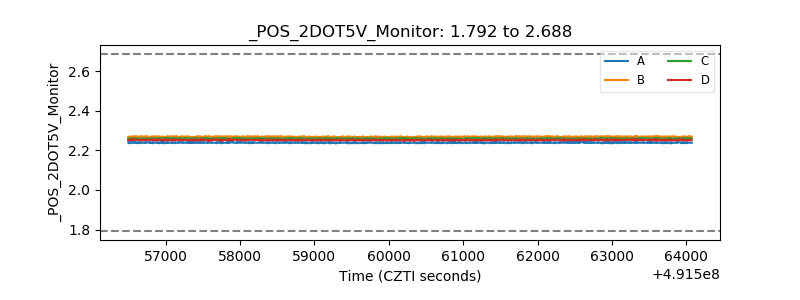 |
| +5 Volts monitor |  |
| _ROLL_ROT | 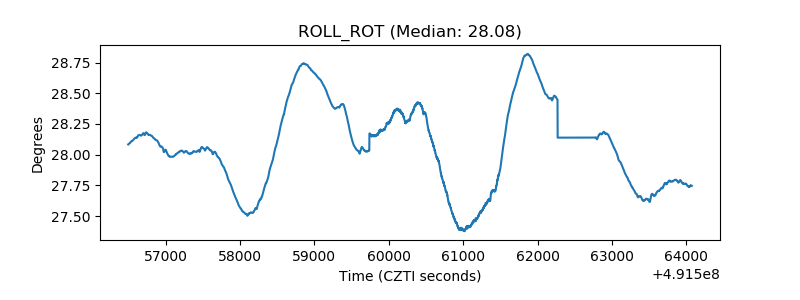 |
| _Roll_DEC | 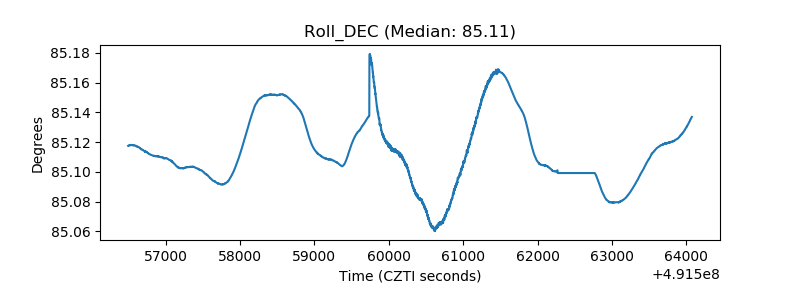 |
| _Roll_RA | 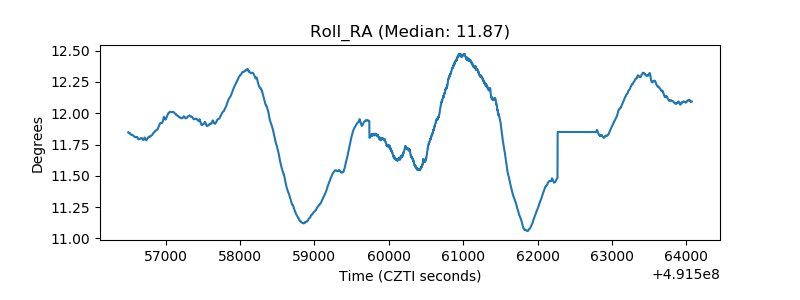 |
| Veto Counter | 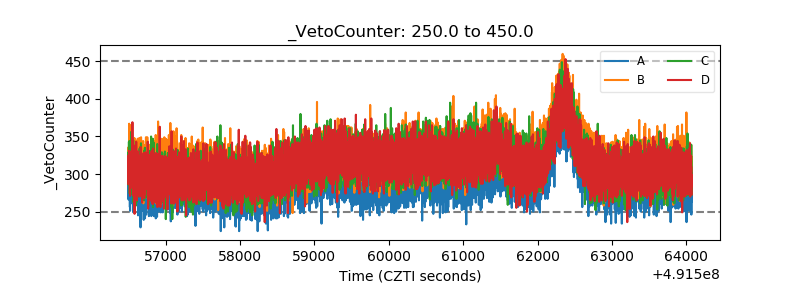 |