| Param | Original file | Final file |
|---|---|---|
| Filename | modeM0/AS1C09_011T06_9000006490_53217cztM0_level2.fits | modeM0/AS1C09_011T06_9000006490_53217cztM0_level2_quad_clean.evt |
| Size (bytes) | 2,356,318,080 | 197,775,360 |
| Size | 2.2 GB | 188.6 MB |
| Events in quadrant A | 11,137,313 | 1,554,661 |
| Events in quadrant B | 9,470,928 | 1,729,181 |
| Events in quadrant C | 31,493,010 | 721,543 |
| Events in quadrant D | 33,762,149 | 764,872 |
| Mode M9 | |||
|---|---|---|---|
| Quadrant | BADHDUFLAG | Total packets | Discarded packets |
| A | 0 | 8 | 0 |
| B | 0 | 8 | 0 |
| C | 0 | 8 | 0 |
| D | 0 | 8 | 0 |
| Mode SS | |||
|---|---|---|---|
| Quadrant | BADHDUFLAG | Total packets | Discarded packets |
| A | 0 | 358 | 0 |
| B | 0 | 358 | 0 |
| C | 0 | 358 | 0 |
| D | 0 | 358 | 0 |
| Mode M0 | |||
|---|---|---|---|
| Quadrant | BADHDUFLAG | Total packets | Discarded packets |
| A | 0 | 46207 | 2 |
| B | 0 | 40780 | 2 |
| C | 0 | 105671 | 2 |
| D | 0 | 112477 | 2 |
| Quadrant | Total seconds | Saturated seconds | Saturation percentage |
|---|---|---|---|
| A | 17650 | 1029 | 5.830028% |
| B | 17651 | 339 | 1.920571% |
| C | 17651 | 9716 | 55.045040% |
| D | 17651 | 8963 | 50.778993% |
Noise dominated data is calculated using 1-second bins in cleaned event files. If a bin has >2000 counts, and if more than 50% of those come from <1% of pixels, then it is considered to be noise-dominated and hence unusable.
| Quadrant | # 1 sec bins | Bins with >0 counts | Bins with >2000 counts | High rate bins dominated by noise | Noise dominated (total time) | Noise dominated (detector-on time) | Marked lightcurve |
|---|---|---|---|---|---|---|---|
| A | 17960 | 17652 | 702 | 702 | 3.91% | 3.98% | 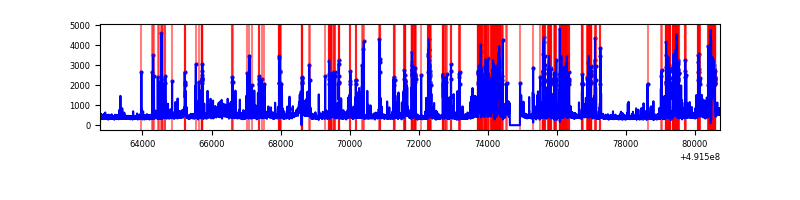 |
| B | 17961 | 17653 | 147 | 147 | 0.82% | 0.83% | 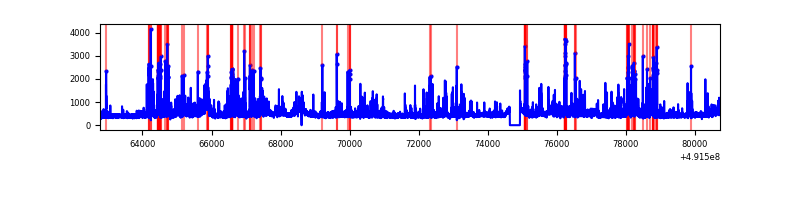 |
| C | 17961 | 17651 | 8446 | 8446 | 47.02% | 47.85% | 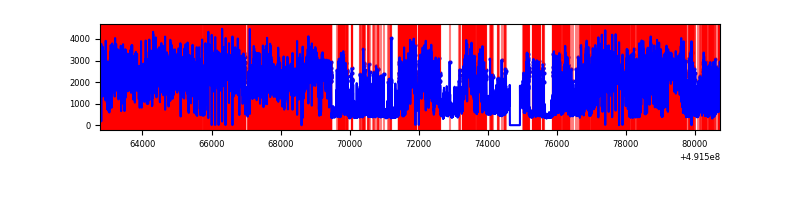 |
| D | 17961 | 17653 | 8987 | 8987 | 50.04% | 50.91% | 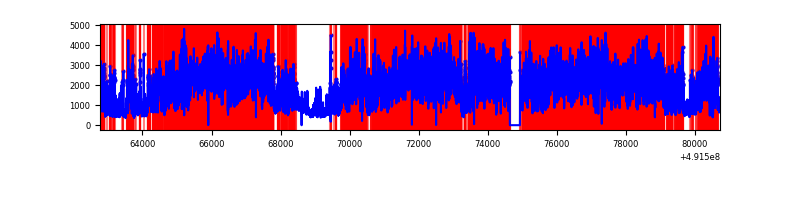 |
Top three noisy pixels from each quadrant. If the there are fewer than three noisy pixels in the level2.evt file, extra rows are filled as -1
| Pixel properties | Quadrant properties | ||||||
|---|---|---|---|---|---|---|---|
| Quadrant | DetID | PixID | Counts | Sigma | Mean | Median | Sigma |
| A | 0 | 8 | 1440102 | 3232.94 | 1794 | 1747 | 444.9 |
| A | 7 | 206 | 1144499 | 2568.52 | 1794 | 1747 | 444.9 |
| A | 3 | 62 | 466881 | 1045.47 | 1794 | 1747 | 444.9 |
| B | 10 | 28 | 696375 | 1822.29 | 1803 | 1738 | 381.2 |
| B | 4 | 81 | 345254 | 901.17 | 1803 | 1738 | 381.2 |
| B | 10 | 247 | 197147 | 512.63 | 1803 | 1738 | 381.2 |
| C | 1 | 241 | 12238537 | 35939.21 | 1234 | 1221 | 340.5 |
| C | 15 | 198 | 6047726 | 17757.7 | 1234 | 1221 | 340.5 |
| C | 15 | 224 | 3303107 | 9697.16 | 1234 | 1221 | 340.5 |
| D | 15 | 125 | 21764906 | 53203.87 | 1411 | 1343 | 409.1 |
| D | 11 | 176 | 1949007 | 4761.32 | 1411 | 1343 | 409.1 |
| D | 3 | 12 | 1180593 | 2882.83 | 1411 | 1343 | 409.1 |
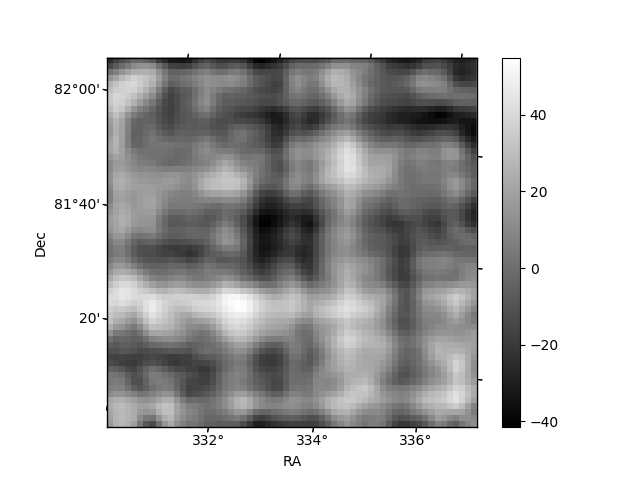
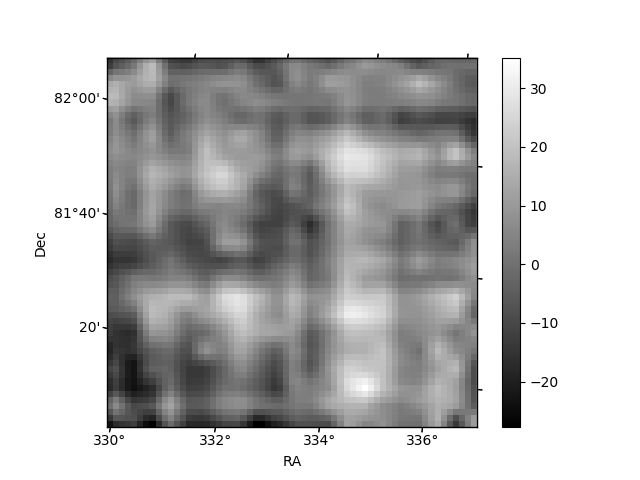
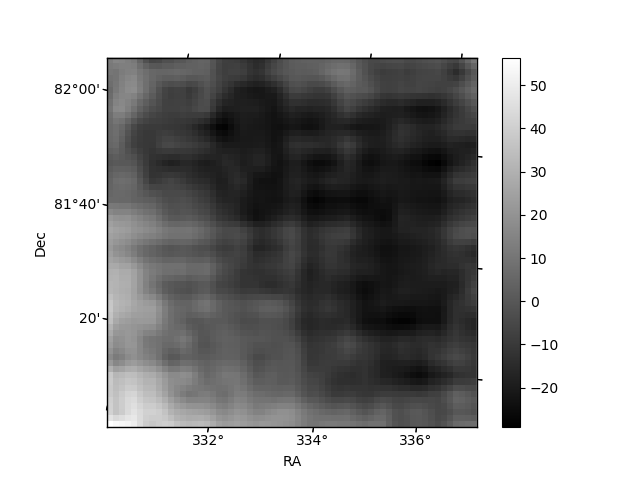
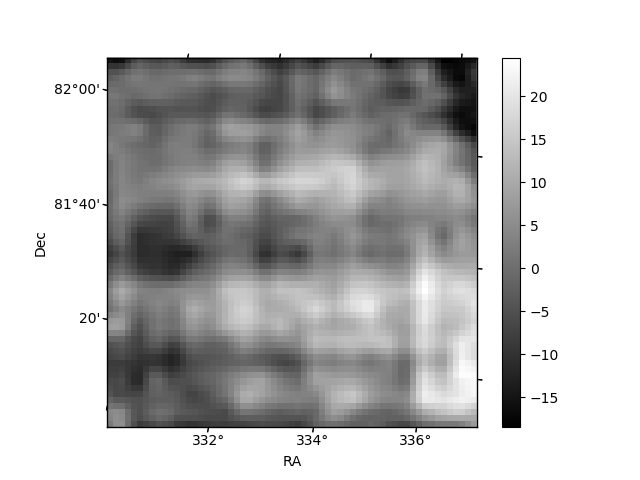
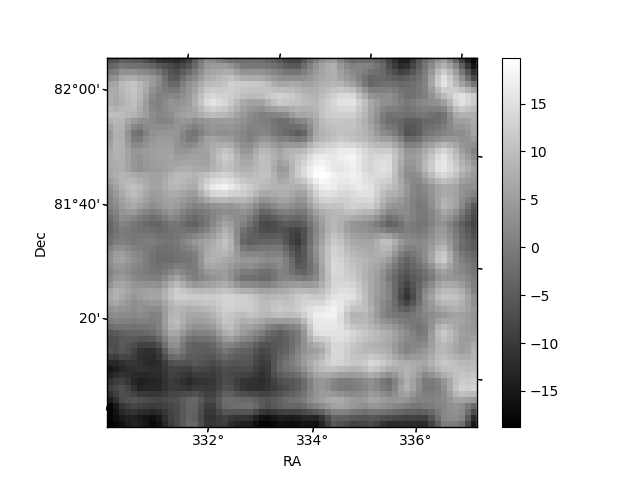
Histogram calculated using DETX and DETY for each event in the final _common_clean file
| Quadrant A | 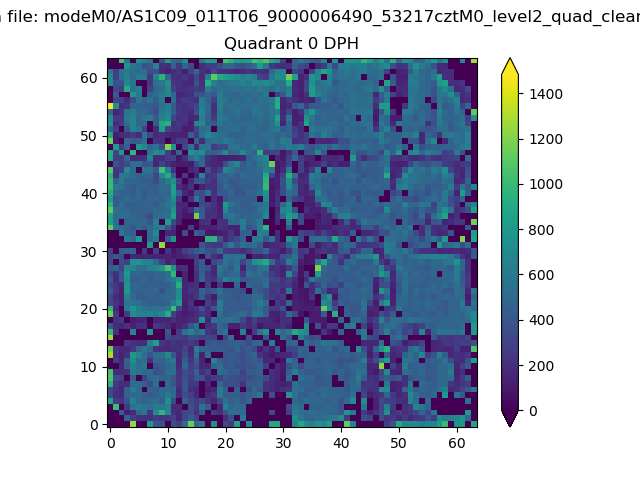 |
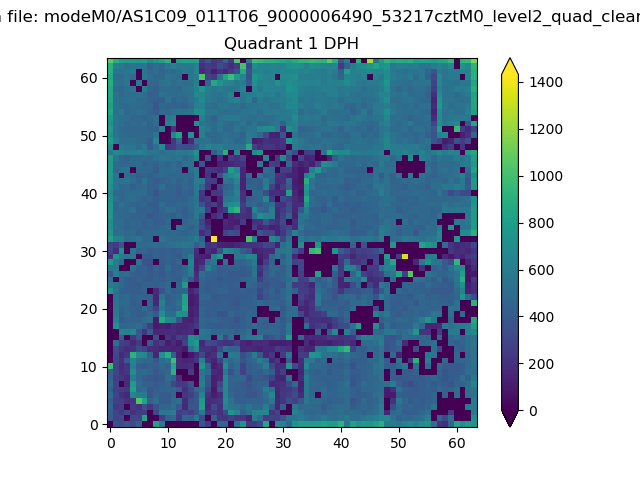 |
Quadrant B |
|---|---|---|---|
| Quadrant D | 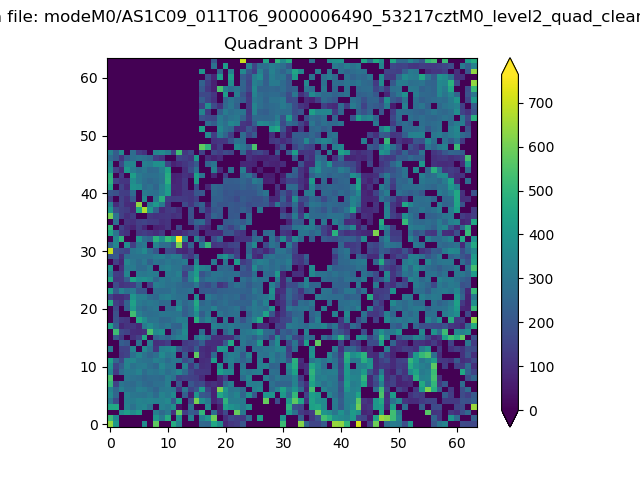 |
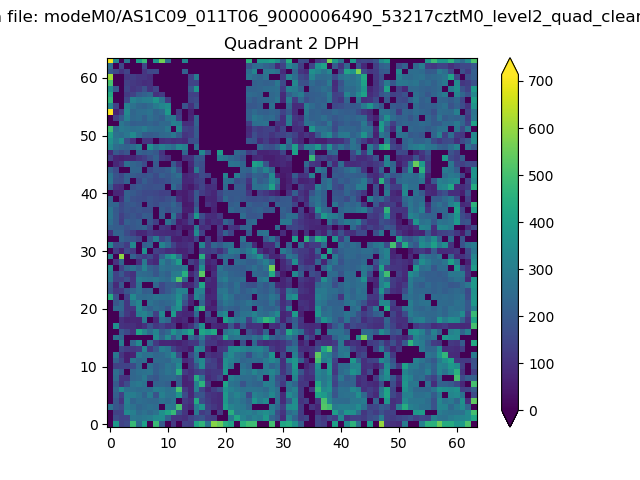 |
Quadrant C |
| Plot type | Count rate plots | Images |
|---|---|---|
| Comparison with Poisson distribution Blue bars denote a histogram of data divided into 1 sec bins. Red curve is a Poisson curve with rate = median count rate of data. |
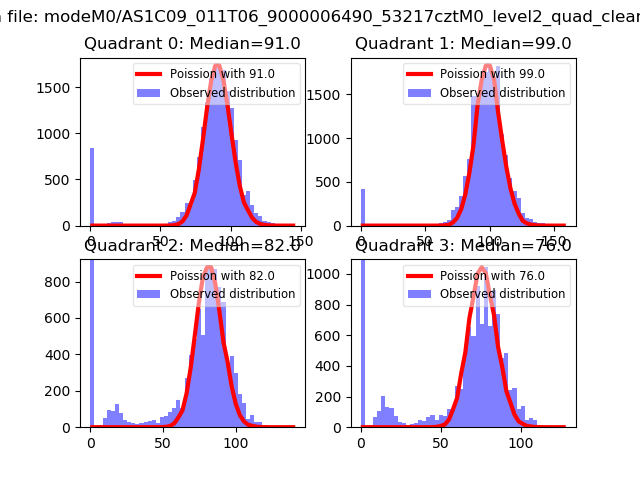 |
 |
| Quadrant-wise count rates Data is divided into 100 sec bins |
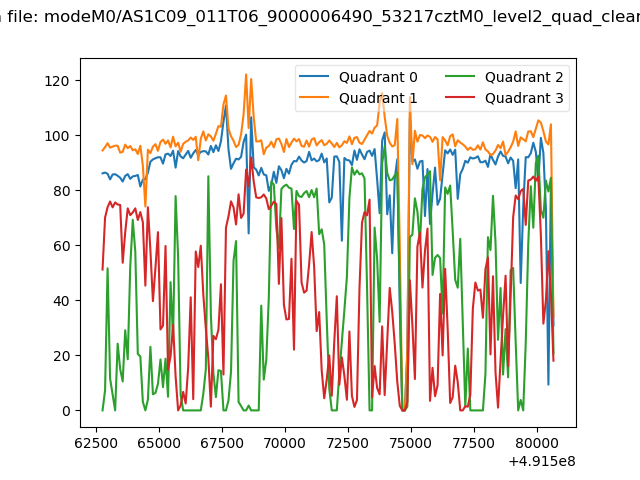 |
|
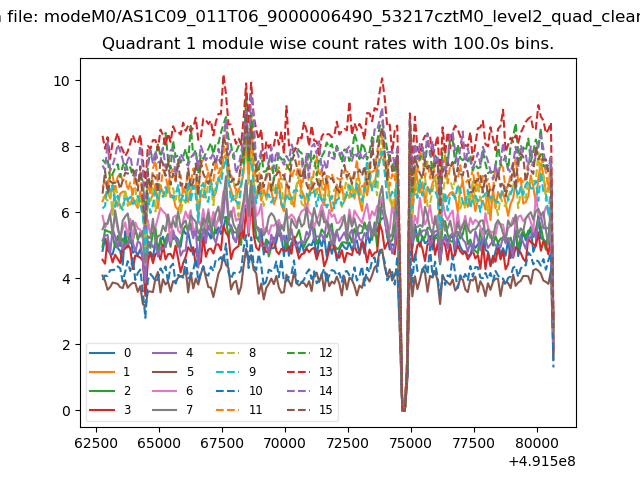
| Module-wise count rates for Quadrant A Data is divided into 100 sec bins |
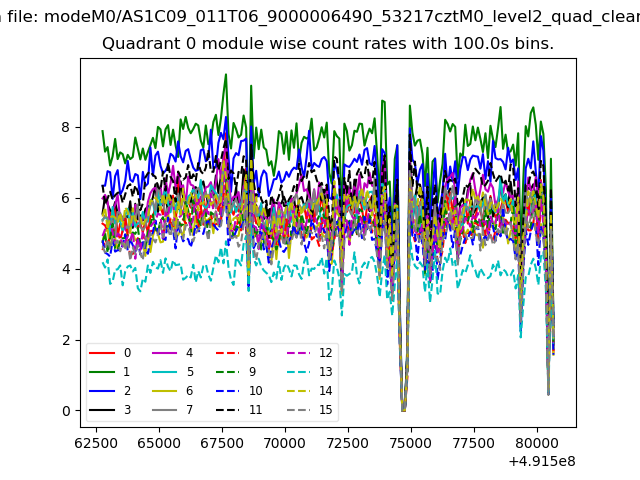 |
 |
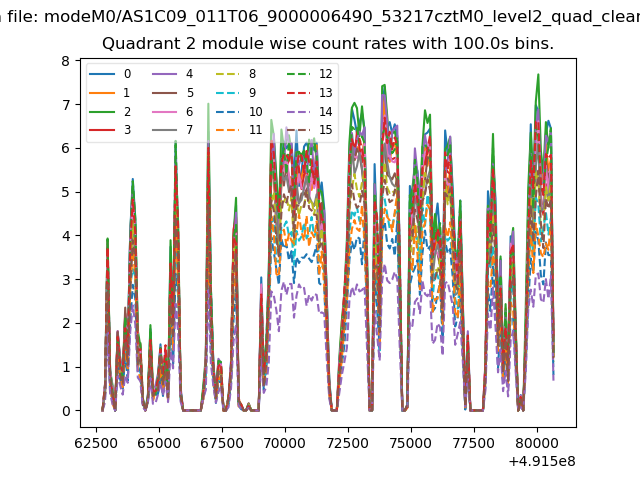
| Module-wise count rates for Quadrant B Data is divided into 100 sec bins |
 |
 |
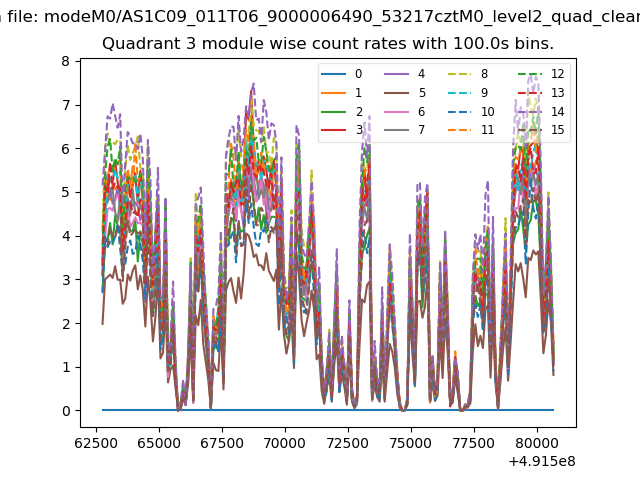
| Module-wise count rates for Quadrant C Data is divided into 100 sec bins |
 |
 |
| Module-wise count rates for Quadrant D Data is divided into 100 sec bins |
 |
 |
| Parameter | Plot |
|---|---|
| CZT HV Monitor | 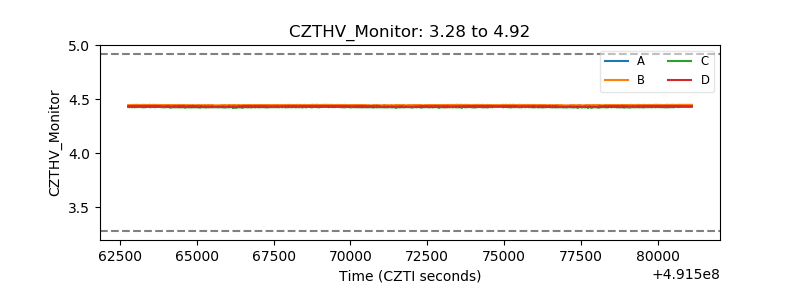 |
| D_VDD | 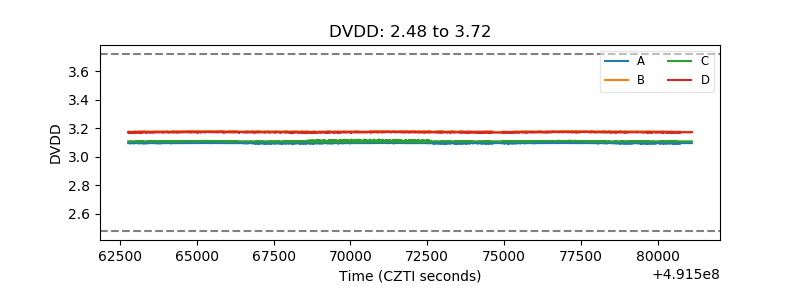 |
| Temperature 1 | 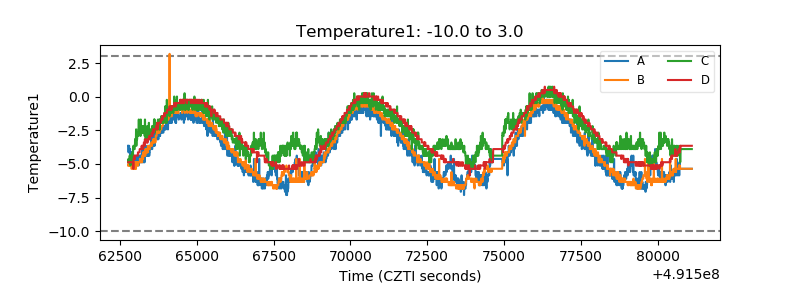 |
| Veto HV Monitor | 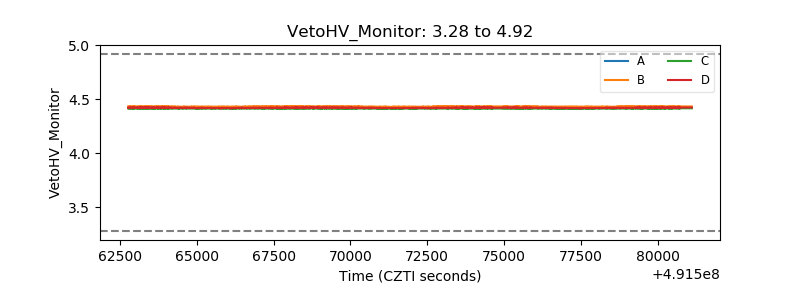 |
| Veto LLD | 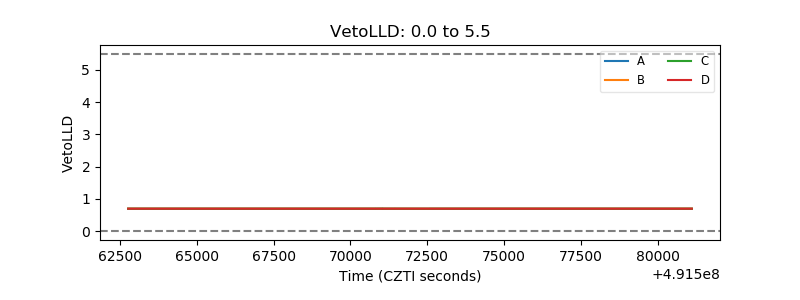 |
| Alpha Counter | 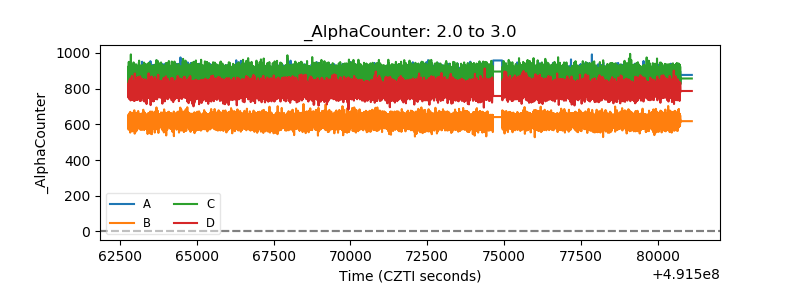 |
| _CPM_Rate | 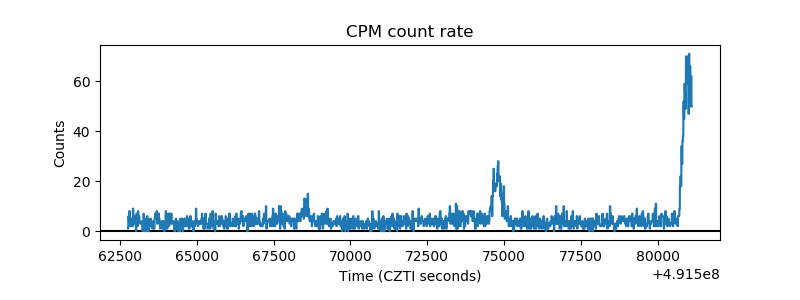 |
| CZT Counter | 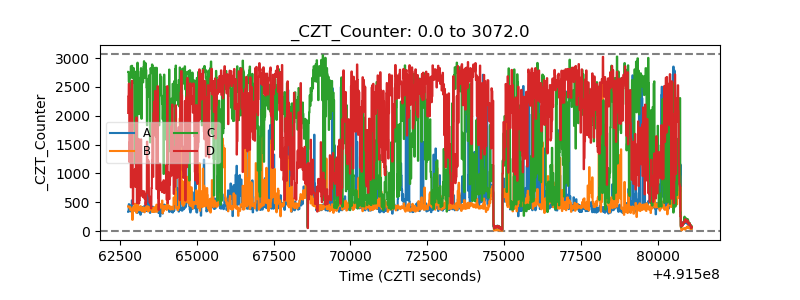 |
| +2.5 Volts monitor |  |
| +5 Volts monitor |  |
| _ROLL_ROT | 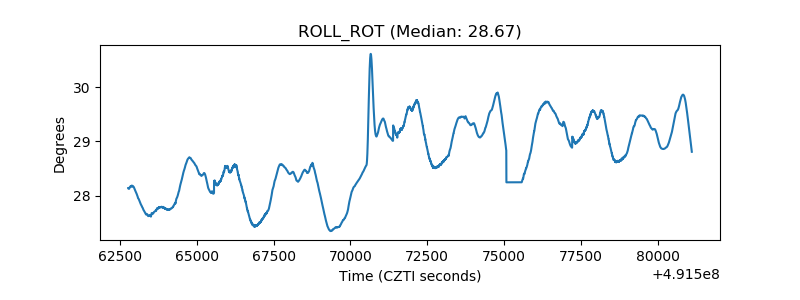 |
| _Roll_DEC | 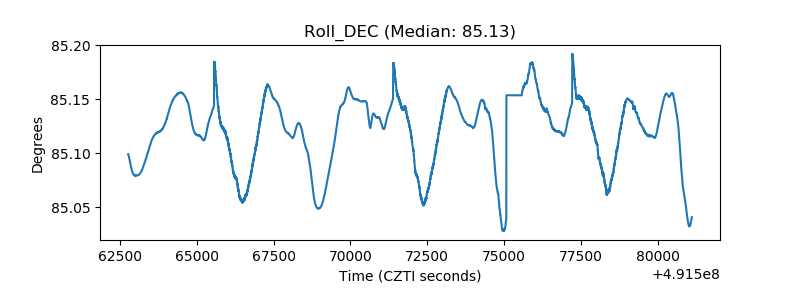 |
| _Roll_RA | 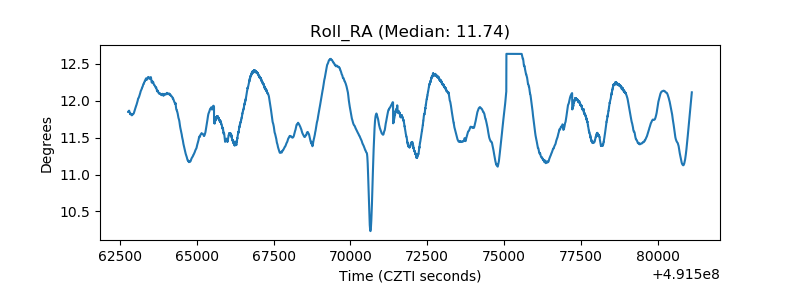 |
| Veto Counter | 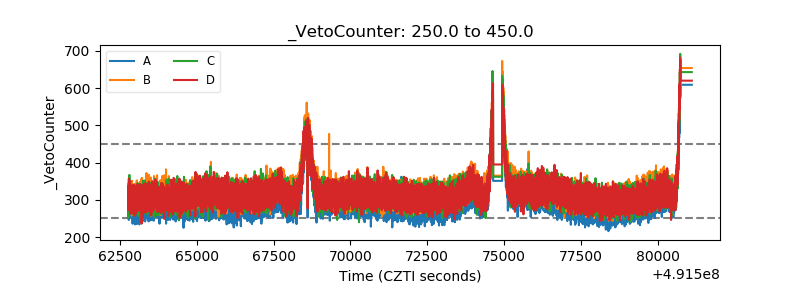 |