| Param | Original file | Final file |
|---|---|---|
| Filename | modeM0/AS1C09_011T06_9000006490_53218cztM0_level2.fits | modeM0/AS1C09_011T06_9000006490_53218cztM0_level2_quad_clean.evt |
| Size (bytes) | 902,517,120 | 86,379,840 |
| Size | 860.7 MB | 82.4 MB |
| Events in quadrant A | 4,773,160 | 647,886 |
| Events in quadrant B | 4,128,820 | 688,880 |
| Events in quadrant C | 12,135,974 | 350,550 |
| Events in quadrant D | 11,818,689 | 430,439 |
| Mode M9 | |||
|---|---|---|---|
| Quadrant | BADHDUFLAG | Total packets | Discarded packets |
| A | 0 | 14 | 0 |
| B | 0 | 14 | 0 |
| C | 0 | 14 | 0 |
| D | 0 | 14 | 0 |
| Mode SS | |||
|---|---|---|---|
| Quadrant | BADHDUFLAG | Total packets | Discarded packets |
| A | 0 | 148 | 0 |
| B | 0 | 148 | 0 |
| C | 0 | 148 | 0 |
| D | 0 | 148 | 0 |
| Mode M0 | |||
|---|---|---|---|
| Quadrant | BADHDUFLAG | Total packets | Discarded packets |
| A | 0 | 19196 | 24 |
| B | 0 | 17278 | 24 |
| C | 0 | 41082 | 122 |
| D | 0 | 40270 | 227 |
| Quadrant | Total seconds | Saturated seconds | Saturation percentage |
|---|---|---|---|
| A | 7140 | 406 | 5.686275% |
| B | 7143 | 341 | 4.773905% |
| C | 7133 | 3450 | 48.366746% |
| D | 7122 | 2446 | 34.344285% |
Noise dominated data is calculated using 1-second bins in cleaned event files. If a bin has >2000 counts, and if more than 50% of those come from <1% of pixels, then it is considered to be noise-dominated and hence unusable.
| Quadrant | # 1 sec bins | Bins with >0 counts | Bins with >2000 counts | High rate bins dominated by noise | Noise dominated (total time) | Noise dominated (detector-on time) | Marked lightcurve |
|---|---|---|---|---|---|---|---|
| A | 8548 | 7149 | 308 | 308 | 3.60% | 4.31% | 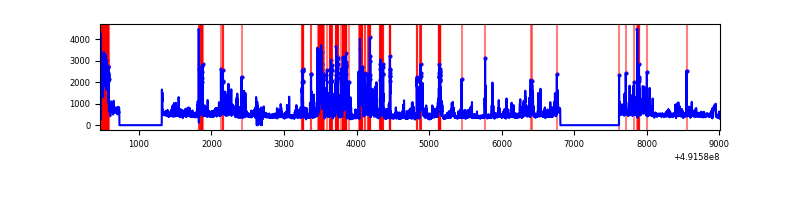 |
| B | 8548 | 7149 | 252 | 252 | 2.95% | 3.52% | 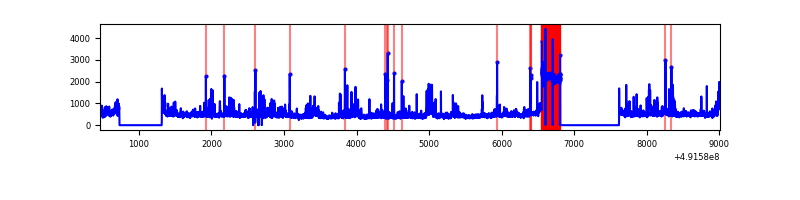 |
| C | 8548 | 7152 | 3070 | 3070 | 35.91% | 42.93% | 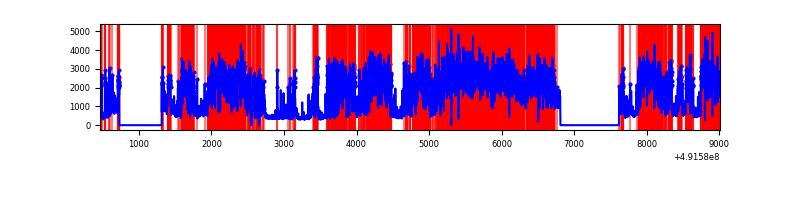 |
| D | 8548 | 7144 | 2415 | 2415 | 28.25% | 33.80% | 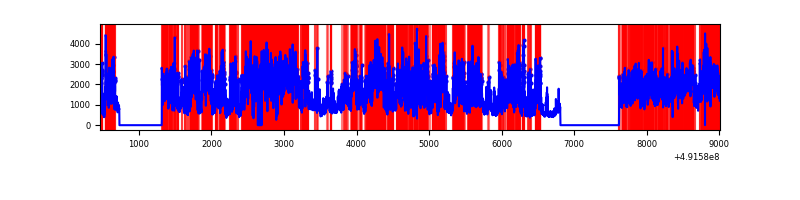 |
Top three noisy pixels from each quadrant. If the there are fewer than three noisy pixels in the level2.evt file, extra rows are filled as -1
| Pixel properties | Quadrant properties | ||||||
|---|---|---|---|---|---|---|---|
| Quadrant | DetID | PixID | Counts | Sigma | Mean | Median | Sigma |
| A | 3 | 62 | 813102 | 4384.7 | 748 | 730 | 185.3 |
| A | 7 | 206 | 345748 | 1862.2 | 748 | 730 | 185.3 |
| A | 14 | 254 | 194049 | 1043.42 | 748 | 730 | 185.3 |
| B | 12 | 17 | 606861 | 3976.81 | 721 | 697 | 152.4 |
| B | 10 | 28 | 150992 | 986.03 | 721 | 697 | 152.4 |
| B | 10 | 247 | 95862 | 624.34 | 721 | 697 | 152.4 |
| C | 1 | 241 | 3171296 | 20442.63 | 565 | 558 | 155.1 |
| C | 15 | 165 | 3068000 | 19776.65 | 565 | 558 | 155.1 |
| C | 15 | 198 | 1502149 | 9681.17 | 565 | 558 | 155.1 |
| D | 15 | 125 | 7800822 | 41483.84 | 648 | 617 | 188.0 |
| D | 11 | 176 | 534230 | 2837.91 | 648 | 617 | 188.0 |
| D | 10 | 172 | 187955 | 996.32 | 648 | 617 | 188.0 |
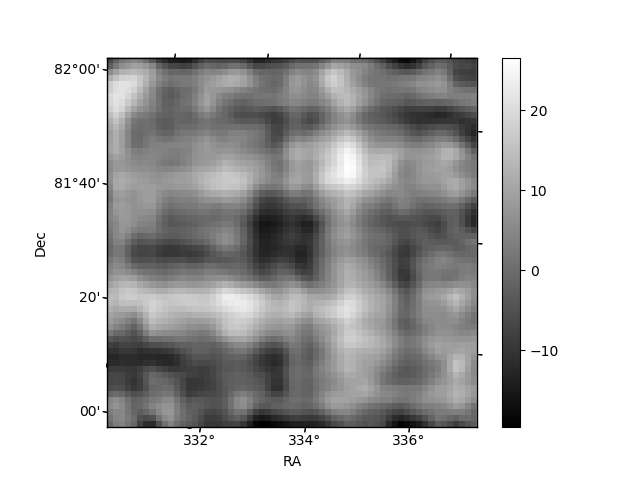
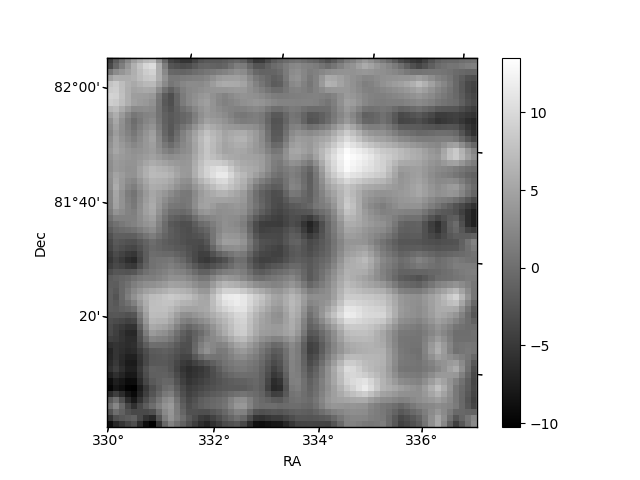
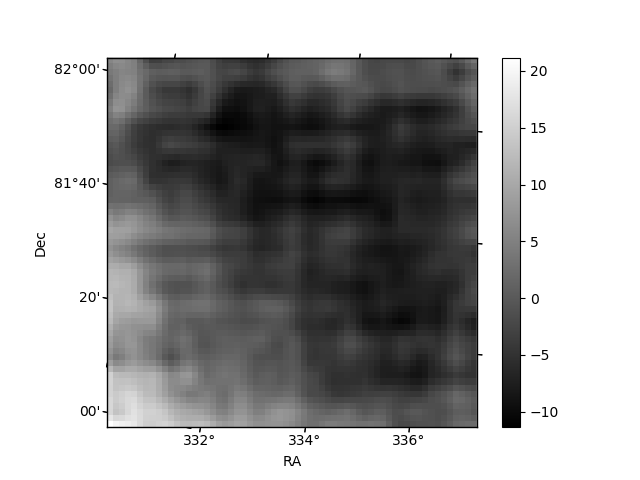
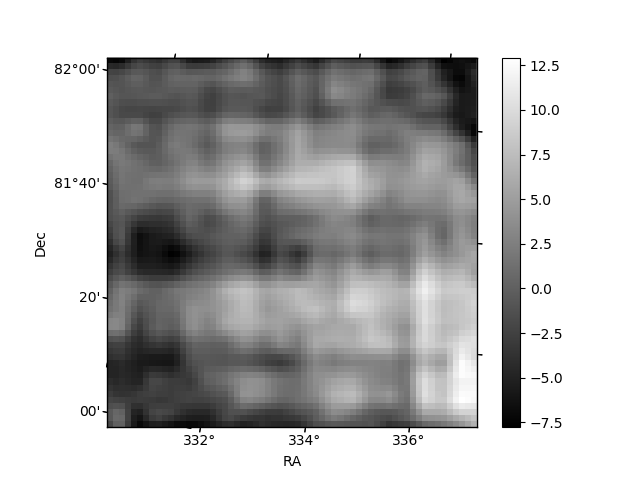
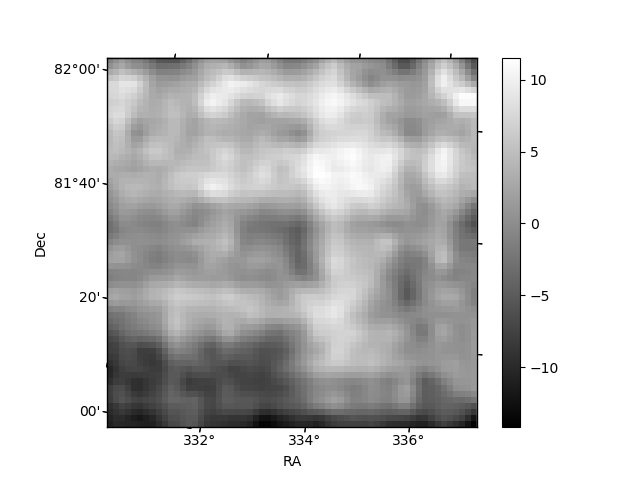
Histogram calculated using DETX and DETY for each event in the final _common_clean file
| Quadrant A | 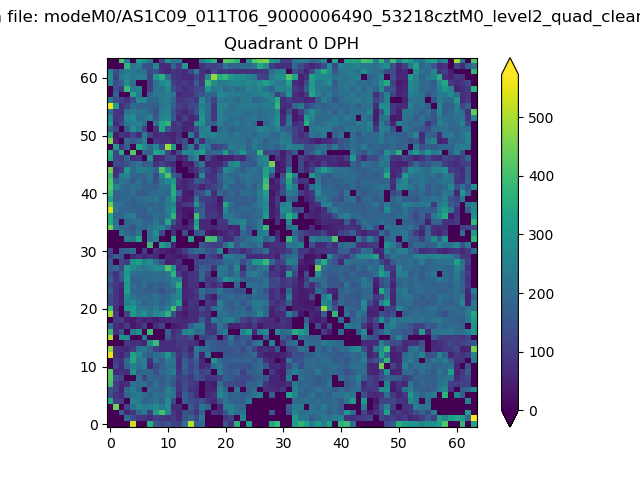 |
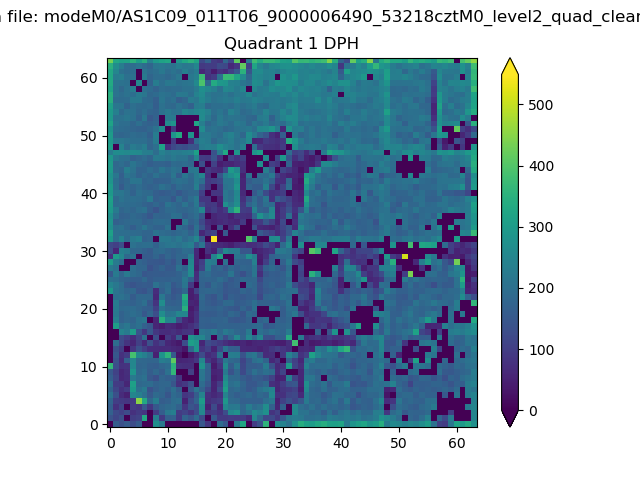 |
Quadrant B |
|---|---|---|---|
| Quadrant D | 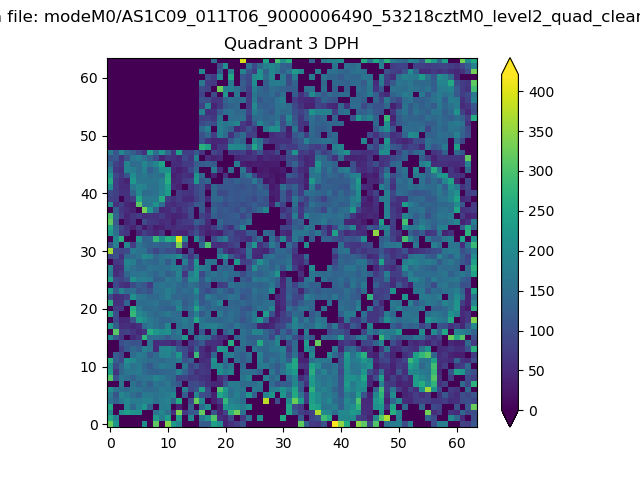 |
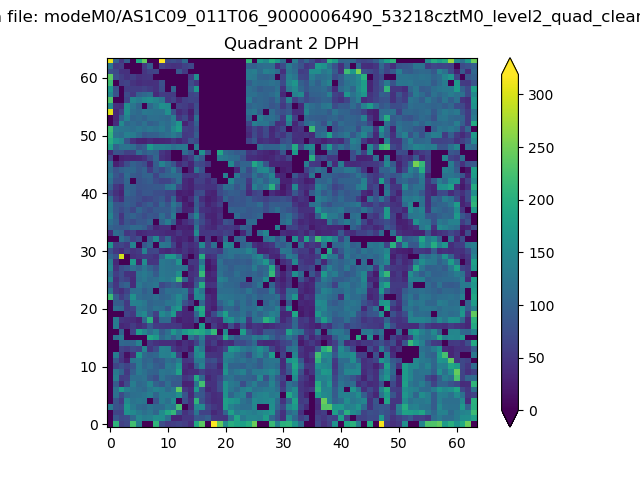 |
Quadrant C |
| Plot type | Count rate plots | Images |
|---|---|---|
| Comparison with Poisson distribution Blue bars denote a histogram of data divided into 1 sec bins. Red curve is a Poisson curve with rate = median count rate of data. |
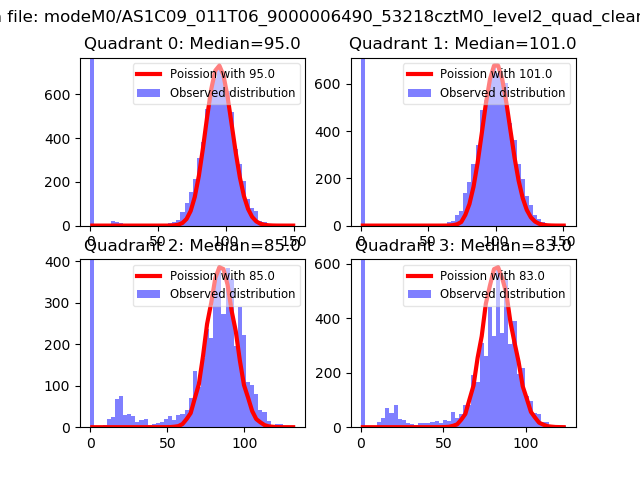 |
 |
| Quadrant-wise count rates Data is divided into 100 sec bins |
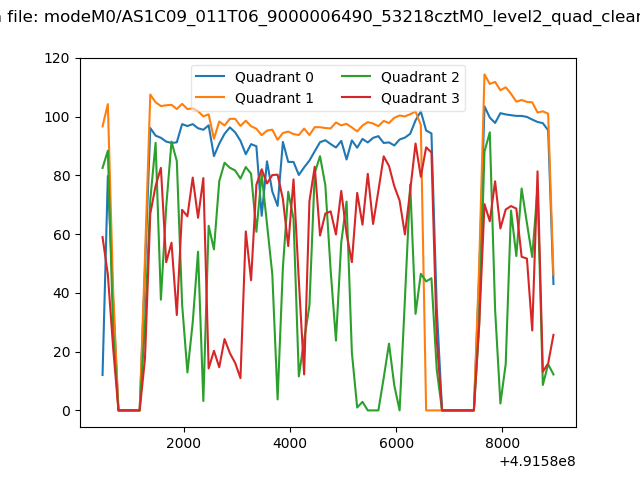 |
|
| Module-wise count rates for Quadrant A Data is divided into 100 sec bins |
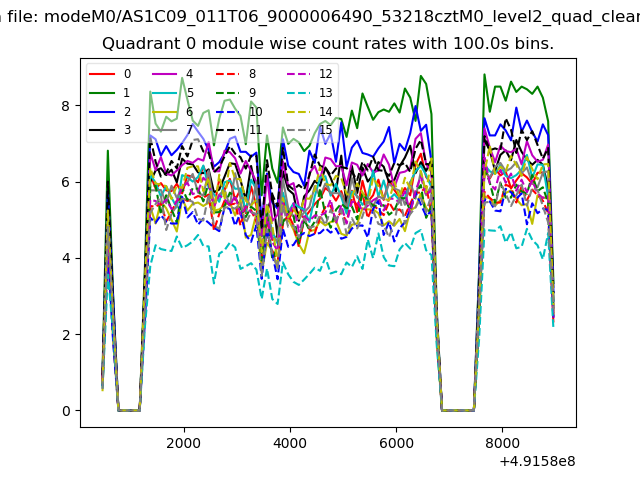 |
 |
| Module-wise count rates for Quadrant B Data is divided into 100 sec bins |
 |
 |
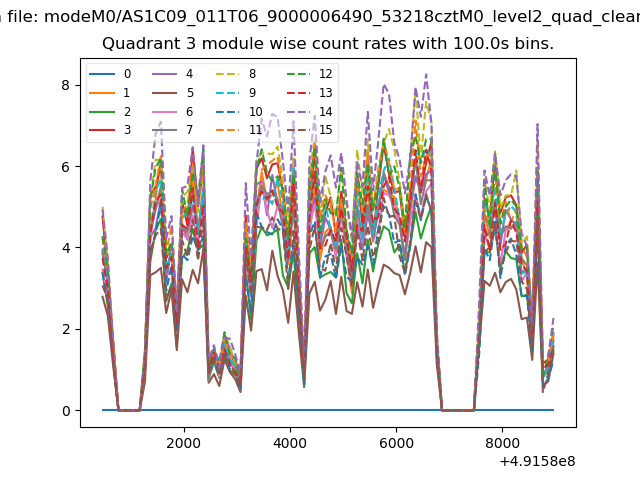
| Module-wise count rates for Quadrant C Data is divided into 100 sec bins |
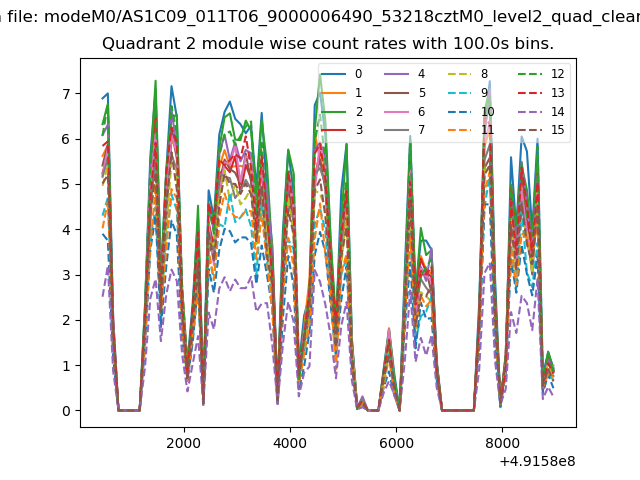 |
 |
| Module-wise count rates for Quadrant D Data is divided into 100 sec bins |
 |
 |
| Parameter | Plot |
|---|---|
| CZT HV Monitor | 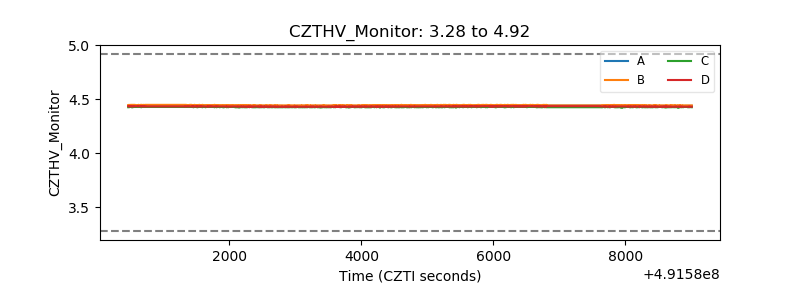 |
| D_VDD | 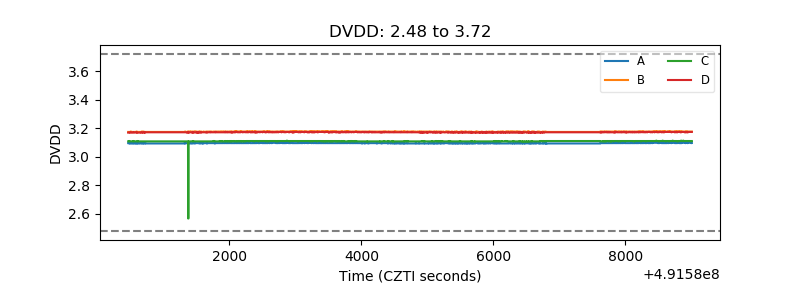 |
| Temperature 1 | 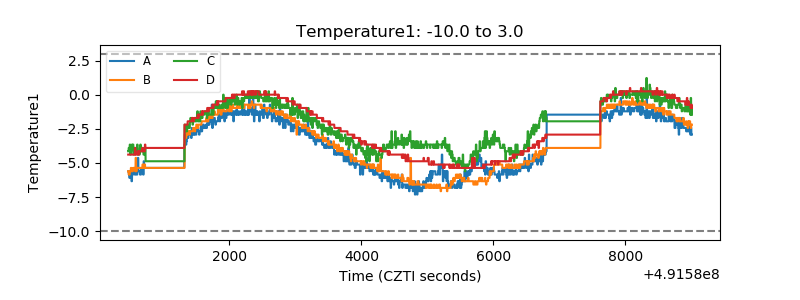 |
| Veto HV Monitor |  |
| Veto LLD | 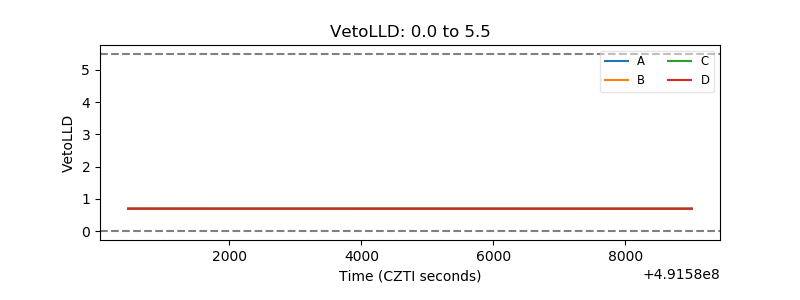 |
| Alpha Counter | 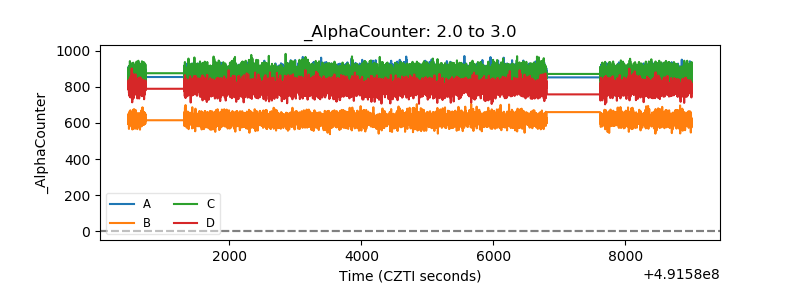 |
| _CPM_Rate | 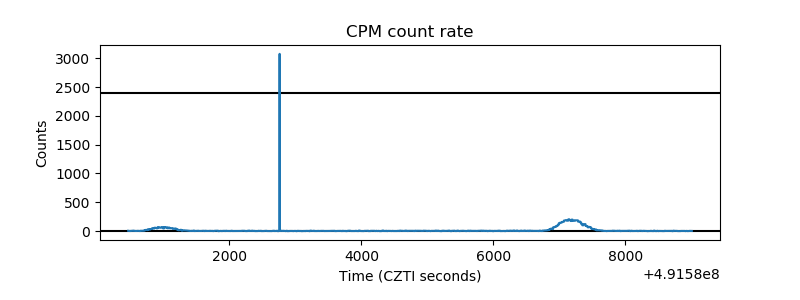 |
| CZT Counter | 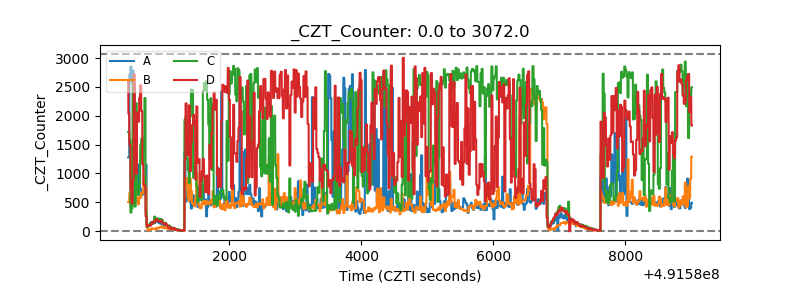 |
| +2.5 Volts monitor |  |
| +5 Volts monitor | 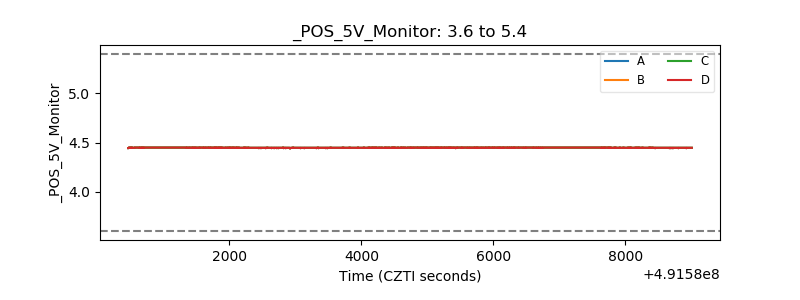 |
| _ROLL_ROT | 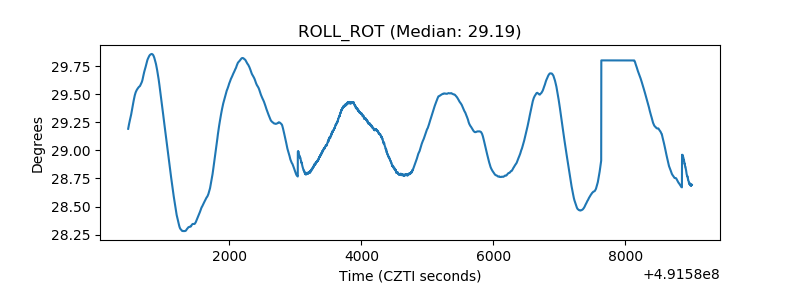 |
| _Roll_DEC | 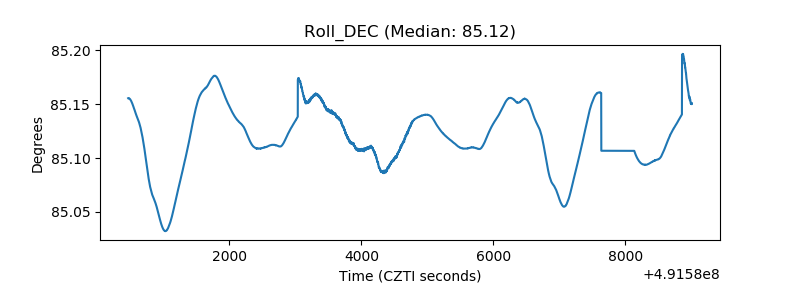 |
| _Roll_RA | 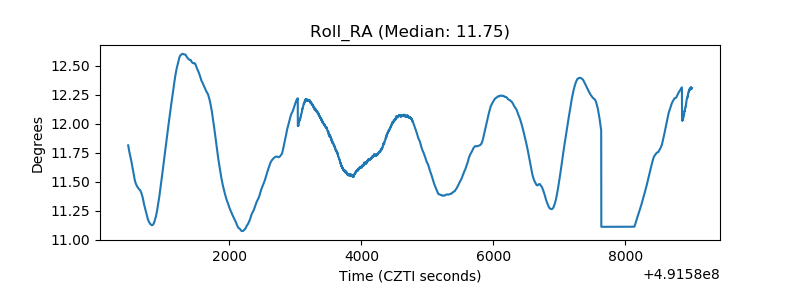 |
| Veto Counter | 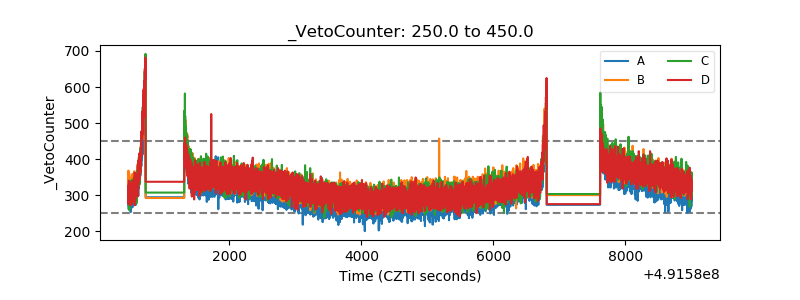 |