| Param | Original file | Final file |
|---|---|---|
| Filename | modeM0/AS1C09_011T06_9000006490_53219cztM0_level2.fits | modeM0/AS1C09_011T06_9000006490_53219cztM0_level2_quad_clean.evt |
| Size (bytes) | 730,486,080 | 78,491,520 |
| Size | 696.6 MB | 74.9 MB |
| Events in quadrant A | 3,047,673 | 592,490 |
| Events in quadrant B | 4,059,141 | 603,797 |
| Events in quadrant C | 11,632,031 | 275,303 |
| Events in quadrant D | 7,822,089 | 472,738 |
| Mode M9 | |||
|---|---|---|---|
| Quadrant | BADHDUFLAG | Total packets | Discarded packets |
| A | 0 | 9 | 0 |
| B | 0 | 9 | 0 |
| C | 0 | 9 | 0 |
| D | 0 | 9 | 0 |
| Mode SS | |||
|---|---|---|---|
| Quadrant | BADHDUFLAG | Total packets | Discarded packets |
| A | 0 | 126 | 0 |
| B | 0 | 126 | 0 |
| C | 0 | 126 | 0 |
| D | 0 | 126 | 0 |
| Mode M0 | |||
|---|---|---|---|
| Quadrant | BADHDUFLAG | Total packets | Discarded packets |
| A | 0 | 13502 | 1 |
| B | 0 | 16406 | 1 |
| C | 0 | 38708 | 1 |
| D | 0 | 27540 | 6 |
| Quadrant | Total seconds | Saturated seconds | Saturation percentage |
|---|---|---|---|
| A | 6188 | 36 | 0.581771% |
| B | 6189 | 325 | 5.251252% |
| C | 6189 | 3420 | 55.259331% |
| D | 6188 | 903 | 14.592760% |
Noise dominated data is calculated using 1-second bins in cleaned event files. If a bin has >2000 counts, and if more than 50% of those come from <1% of pixels, then it is considered to be noise-dominated and hence unusable.
| Quadrant | # 1 sec bins | Bins with >0 counts | Bins with >2000 counts | High rate bins dominated by noise | Noise dominated (total time) | Noise dominated (detector-on time) | Marked lightcurve |
|---|---|---|---|---|---|---|---|
| A | 7164 | 6189 | 14 | 14 | 0.20% | 0.23% | 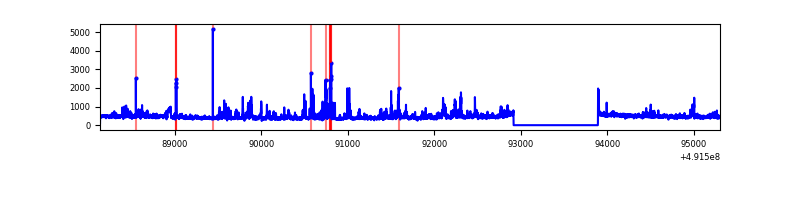 |
| B | 7165 | 6190 | 182 | 182 | 2.54% | 2.94% | 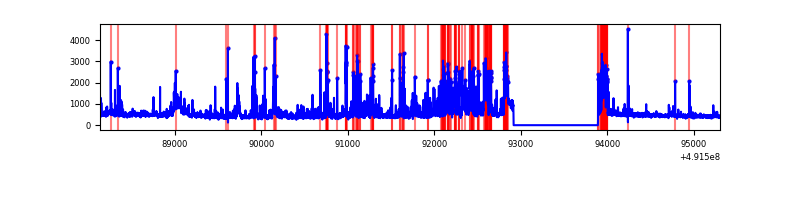 |
| C | 7165 | 6190 | 3167 | 3167 | 44.20% | 51.16% | 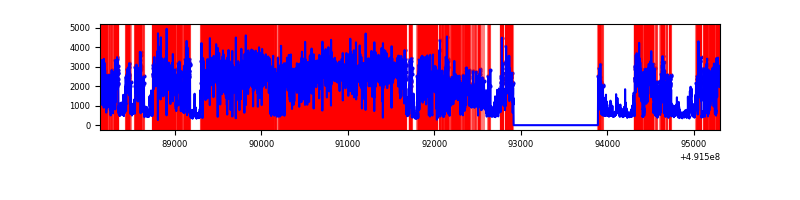 |
| D | 7164 | 6189 | 932 | 932 | 13.01% | 15.06% | 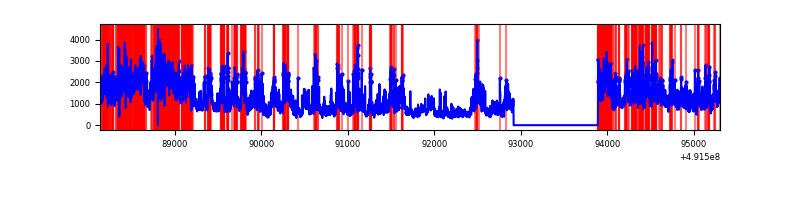 |
Top three noisy pixels from each quadrant. If the there are fewer than three noisy pixels in the level2.evt file, extra rows are filled as -1
| Pixel properties | Quadrant properties | ||||||
|---|---|---|---|---|---|---|---|
| Quadrant | DetID | PixID | Counts | Sigma | Mean | Median | Sigma |
| A | 3 | 62 | 115061 | 711.94 | 642 | 626 | 160.7 |
| A | 3 | 27 | 114505 | 708.48 | 642 | 626 | 160.7 |
| A | 3 | 14 | 89211 | 551.12 | 642 | 626 | 160.7 |
| B | 2 | 249 | 579777 | 4354.04 | 626 | 605 | 133.0 |
| B | 12 | 17 | 302780 | 2271.66 | 626 | 605 | 133.0 |
| B | 8 | 128 | 157201 | 1177.24 | 626 | 605 | 133.0 |
| C | 1 | 241 | 7474279 | 60284.75 | 447 | 444 | 124.0 |
| C | 15 | 224 | 775445 | 6251.24 | 447 | 444 | 124.0 |
| C | 4 | 5 | 679104 | 5474.14 | 447 | 444 | 124.0 |
| D | 15 | 125 | 4066251 | 23895.42 | 593 | 565 | 170.1 |
| D | 11 | 176 | 432215 | 2536.95 | 593 | 565 | 170.1 |
| D | 10 | 172 | 199621 | 1169.92 | 593 | 565 | 170.1 |
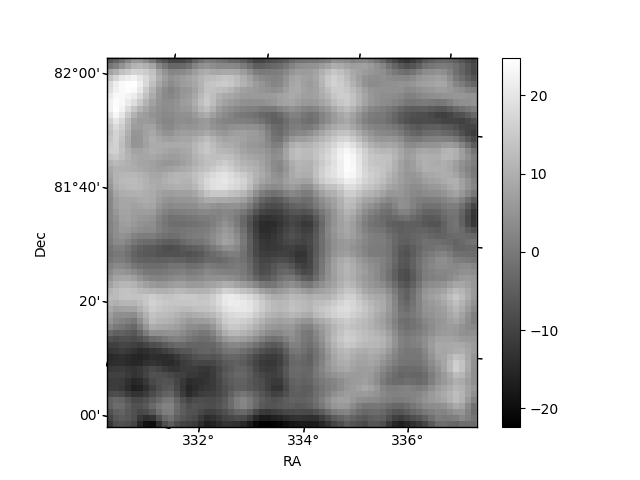
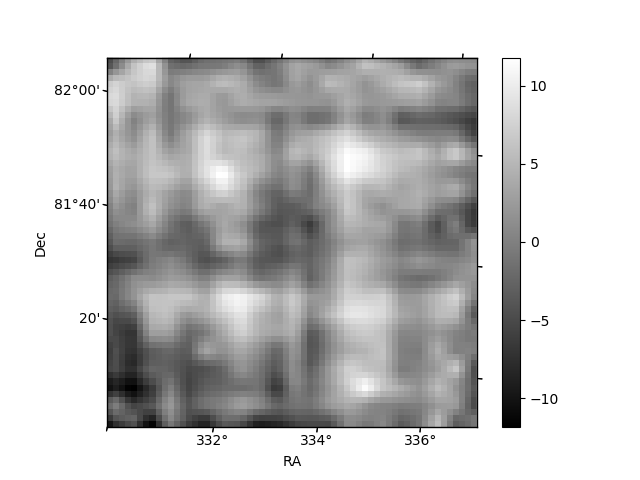
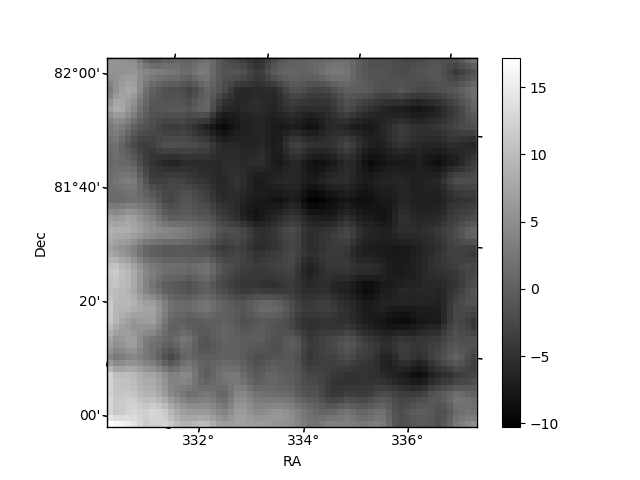
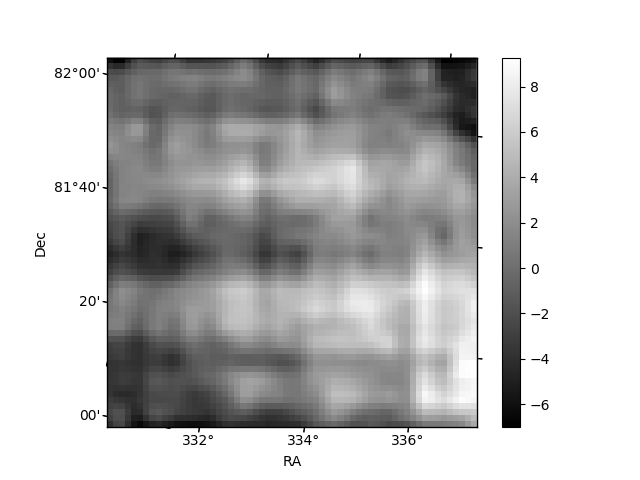
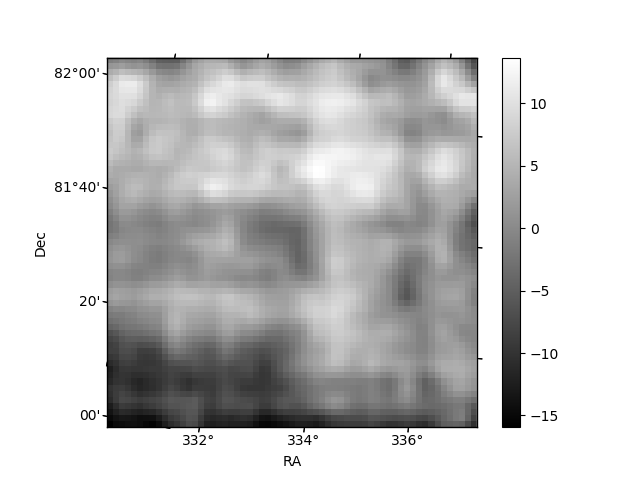
Histogram calculated using DETX and DETY for each event in the final _common_clean file
| Quadrant A | 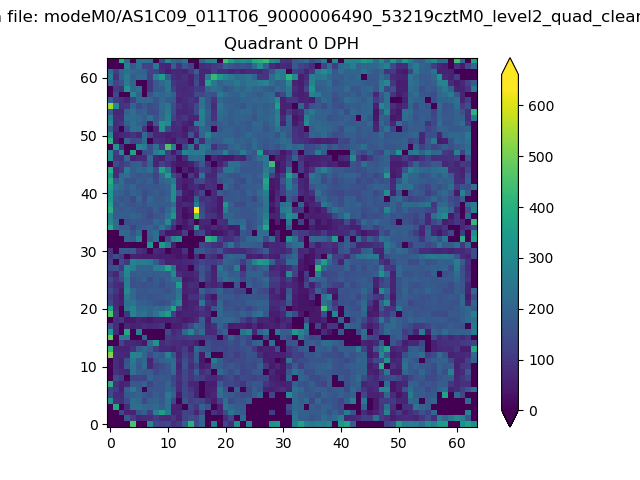 |
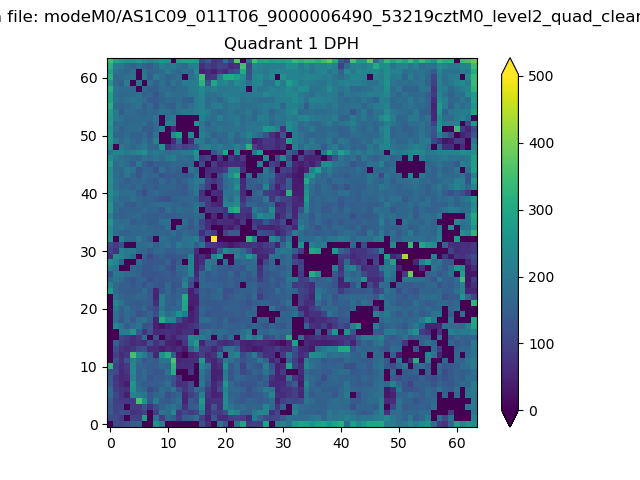 |
Quadrant B |
|---|---|---|---|
| Quadrant D | 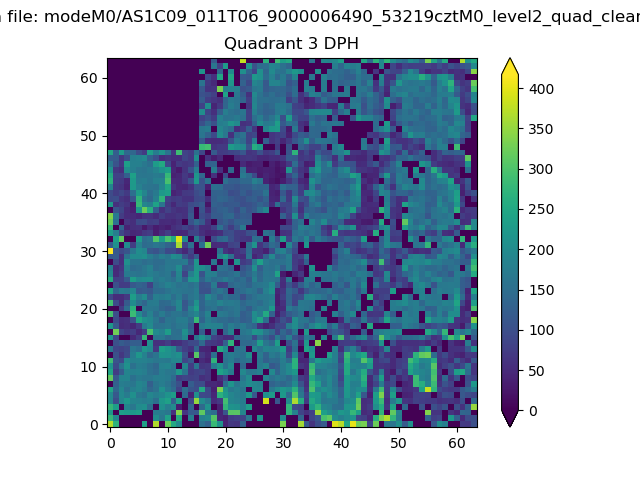 |
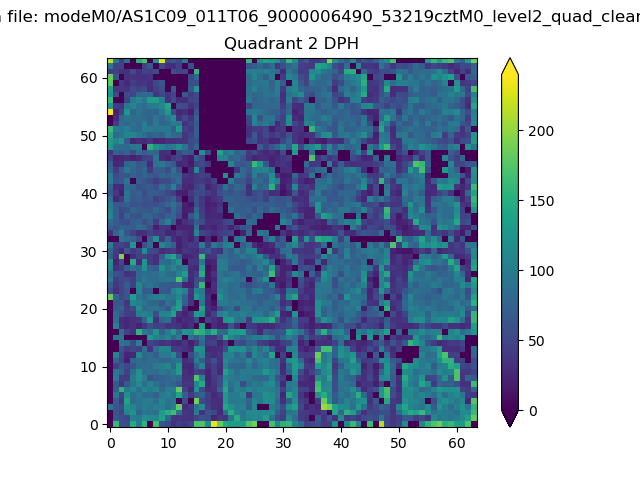 |
Quadrant C |
| Plot type | Count rate plots | Images |
|---|---|---|
| Comparison with Poisson distribution Blue bars denote a histogram of data divided into 1 sec bins. Red curve is a Poisson curve with rate = median count rate of data. |
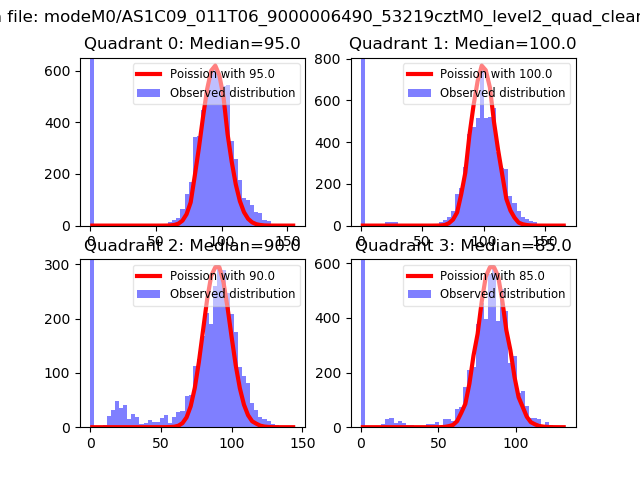 |
 |
| Quadrant-wise count rates Data is divided into 100 sec bins |
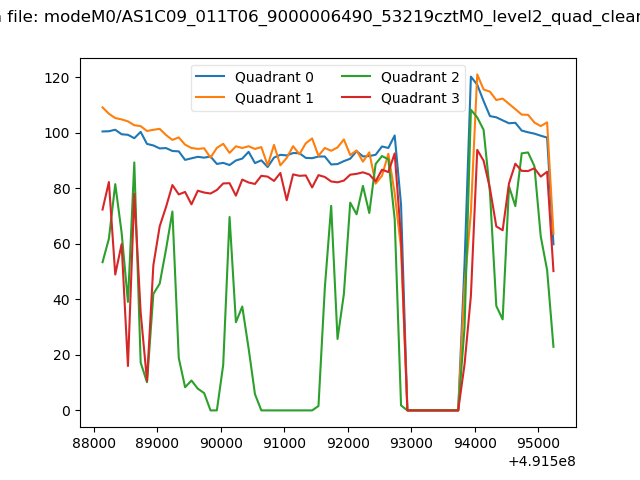 |
|
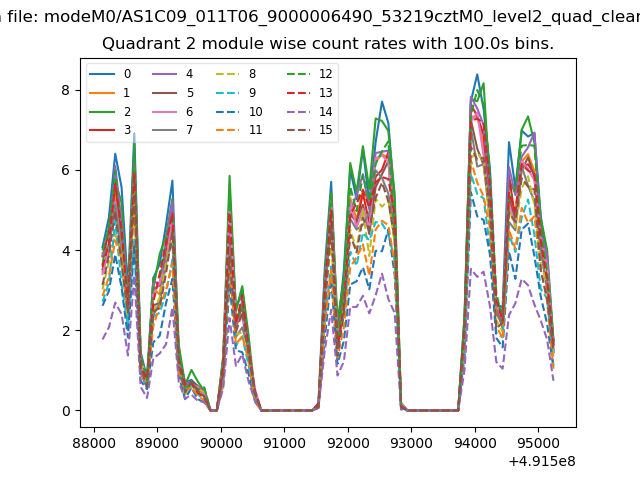
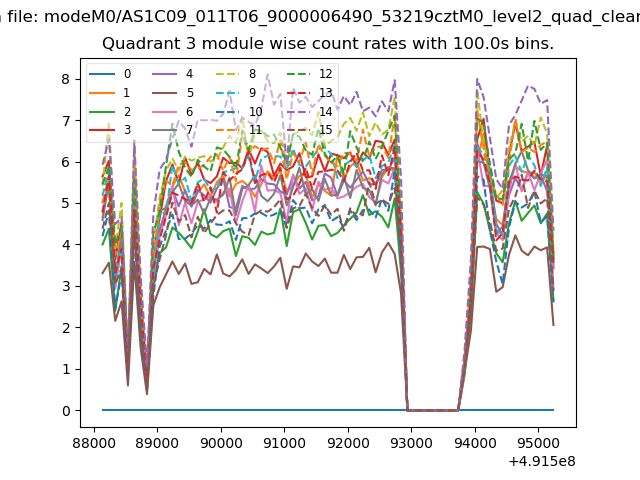
| Module-wise count rates for Quadrant A Data is divided into 100 sec bins |
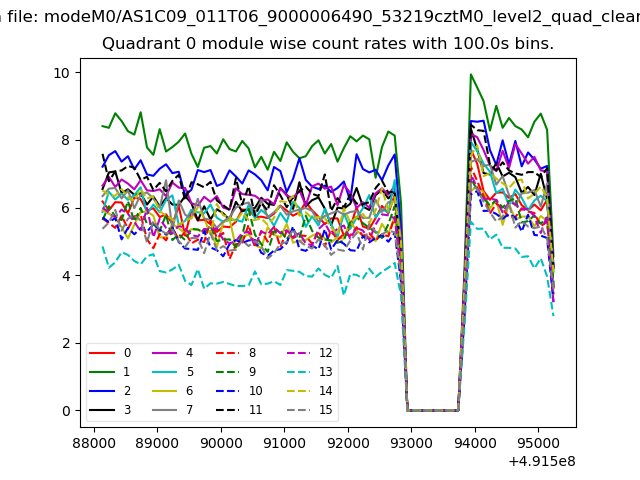 |
 |
| Module-wise count rates for Quadrant B Data is divided into 100 sec bins |
 |
 |
| Module-wise count rates for Quadrant C Data is divided into 100 sec bins |
 |
 |
| Module-wise count rates for Quadrant D Data is divided into 100 sec bins |
 |
 |
| Parameter | Plot |
|---|---|
| CZT HV Monitor | 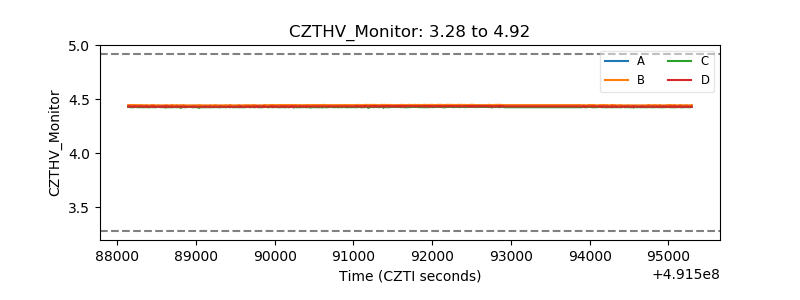 |
| D_VDD | 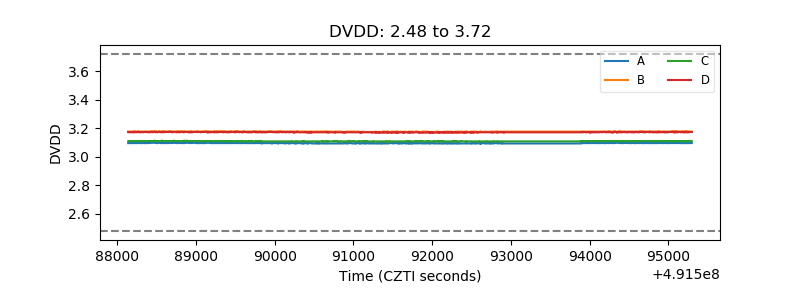 |
| Temperature 1 | 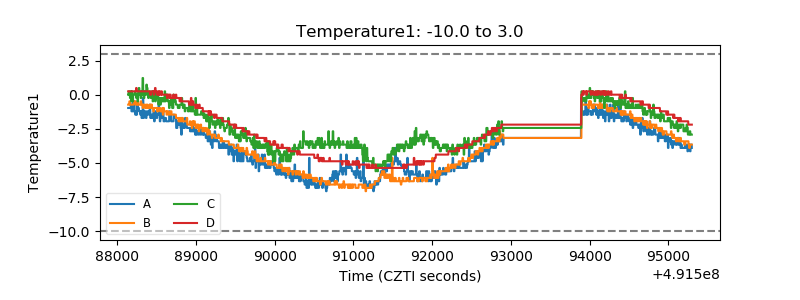 |
| Veto HV Monitor | 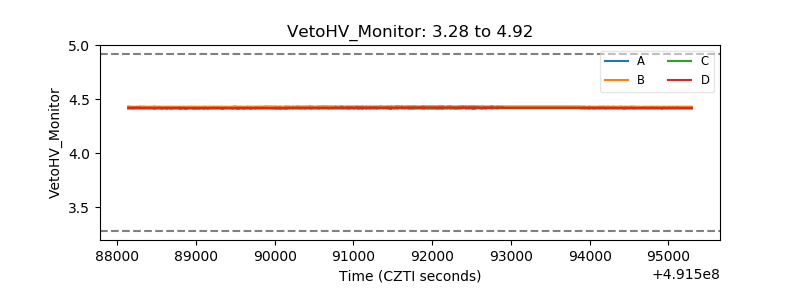 |
| Veto LLD | 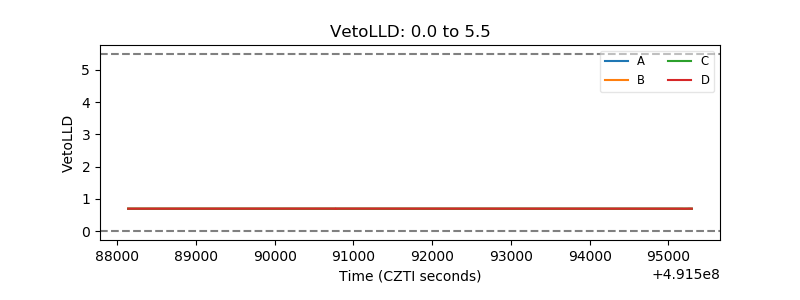 |
| Alpha Counter | 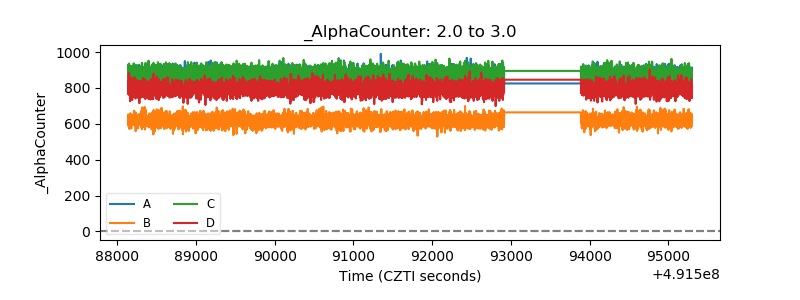 |
| _CPM_Rate | 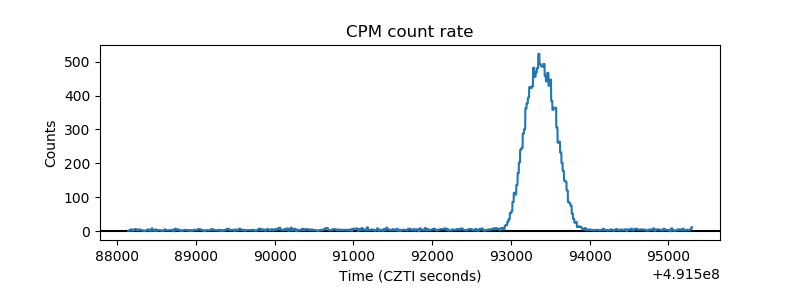 |
| CZT Counter | 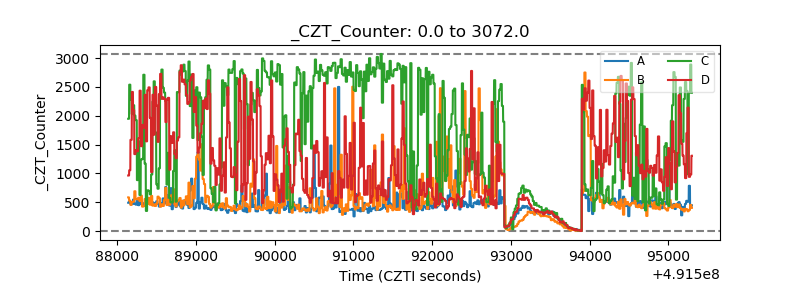 |
| +2.5 Volts monitor |  |
| +5 Volts monitor |  |
| _ROLL_ROT | 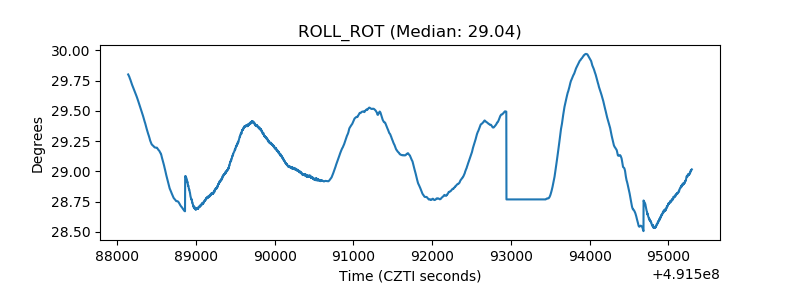 |
| _Roll_DEC | 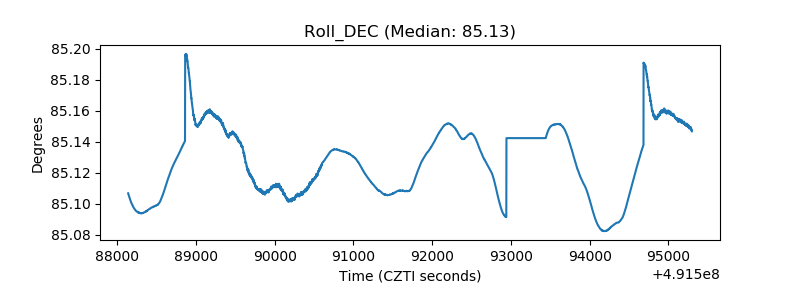 |
| _Roll_RA | 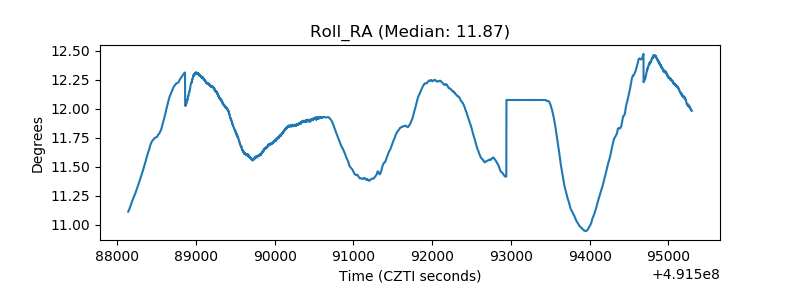 |
| Veto Counter | 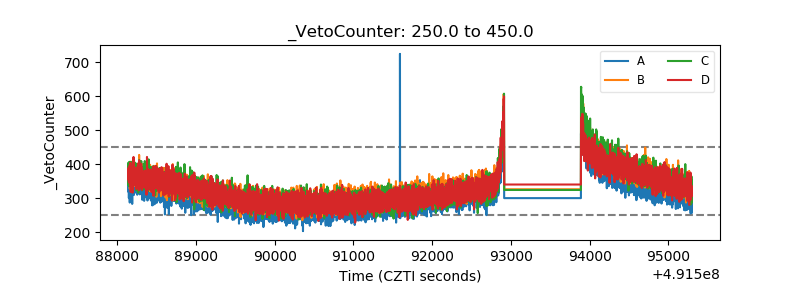 |