| Param | Original file | Final file |
|---|---|---|
| Filename | modeM0/AS1C09_011T06_9000006490_53221cztM0_level2.fits | modeM0/AS1C09_011T06_9000006490_53221cztM0_level2_quad_clean.evt |
| Size (bytes) | 751,406,400 | 84,245,760 |
| Size | 716.6 MB | 80.3 MB |
| Events in quadrant A | 3,093,575 | 640,305 |
| Events in quadrant B | 3,883,596 | 645,084 |
| Events in quadrant C | 12,509,835 | 281,339 |
| Events in quadrant D | 7,830,775 | 536,246 |
| Mode M9 | |||
|---|---|---|---|
| Quadrant | BADHDUFLAG | Total packets | Discarded packets |
| A | 0 | 14 | 0 |
| B | 0 | 15 | 0 |
| C | 0 | 15 | 0 |
| D | 0 | 15 | 0 |
| Mode SS | |||
|---|---|---|---|
| Quadrant | BADHDUFLAG | Total packets | Discarded packets |
| A | 0 | 130 | 0 |
| B | 0 | 130 | 0 |
| C | 0 | 130 | 0 |
| D | 0 | 130 | 0 |
| Mode M0 | |||
|---|---|---|---|
| Quadrant | BADHDUFLAG | Total packets | Discarded packets |
| A | 0 | 13846 | 2 |
| B | 0 | 16153 | 2 |
| C | 0 | 41501 | 2 |
| D | 0 | 27743 | 2 |
| Quadrant | Total seconds | Saturated seconds | Saturation percentage |
|---|---|---|---|
| A | 6417 | 37 | 0.576593% |
| B | 6417 | 367 | 5.719183% |
| C | 6417 | 3727 | 58.080100% |
| D | 6417 | 696 | 10.846190% |
Noise dominated data is calculated using 1-second bins in cleaned event files. If a bin has >2000 counts, and if more than 50% of those come from <1% of pixels, then it is considered to be noise-dominated and hence unusable.
| Quadrant | # 1 sec bins | Bins with >0 counts | Bins with >2000 counts | High rate bins dominated by noise | Noise dominated (total time) | Noise dominated (detector-on time) | Marked lightcurve |
|---|---|---|---|---|---|---|---|
| A | 7492 | 6418 | 18 | 18 | 0.24% | 0.28% | 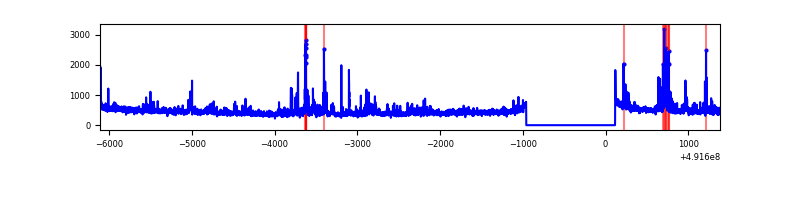 |
| B | 7492 | 6418 | 184 | 184 | 2.46% | 2.87% | 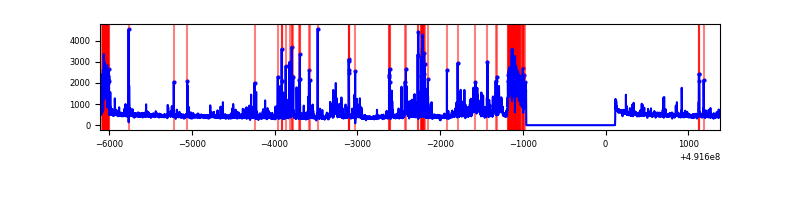 |
| C | 7492 | 6417 | 3467 | 3467 | 46.28% | 54.03% | 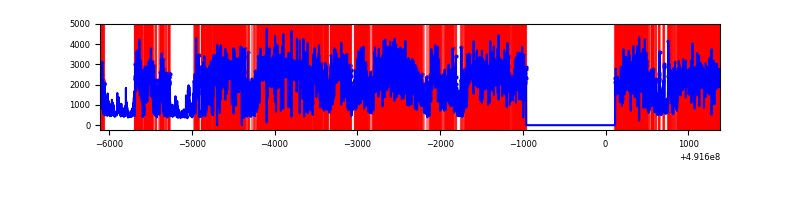 |
| D | 7492 | 6418 | 787 | 787 | 10.50% | 12.26% | 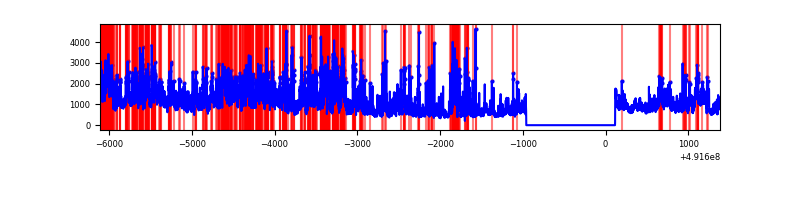 |
Top three noisy pixels from each quadrant. If the there are fewer than three noisy pixels in the level2.evt file, extra rows are filled as -1
| Pixel properties | Quadrant properties | ||||||
|---|---|---|---|---|---|---|---|
| Quadrant | DetID | PixID | Counts | Sigma | Mean | Median | Sigma |
| A | 3 | 62 | 112041 | 641.61 | 683 | 662 | 173.6 |
| A | 14 | 254 | 88246 | 504.54 | 683 | 662 | 173.6 |
| A | 3 | 14 | 41092 | 232.9 | 683 | 662 | 173.6 |
| B | 12 | 17 | 537306 | 3812.39 | 657 | 634 | 140.8 |
| B | 8 | 128 | 163560 | 1157.39 | 657 | 634 | 140.8 |
| B | 2 | 249 | 151161 | 1069.31 | 657 | 634 | 140.8 |
| C | 1 | 241 | 4182387 | 31468.52 | 482 | 477 | 132.9 |
| C | 9 | 38 | 1849436 | 13913.26 | 482 | 477 | 132.9 |
| C | 15 | 165 | 1545626 | 11627.12 | 482 | 477 | 132.9 |
| D | 15 | 125 | 3235839 | 17523.8 | 644 | 616 | 184.6 |
| D | 2 | 37 | 688920 | 3728.24 | 644 | 616 | 184.6 |
| D | 11 | 176 | 346960 | 1876.0 | 644 | 616 | 184.6 |
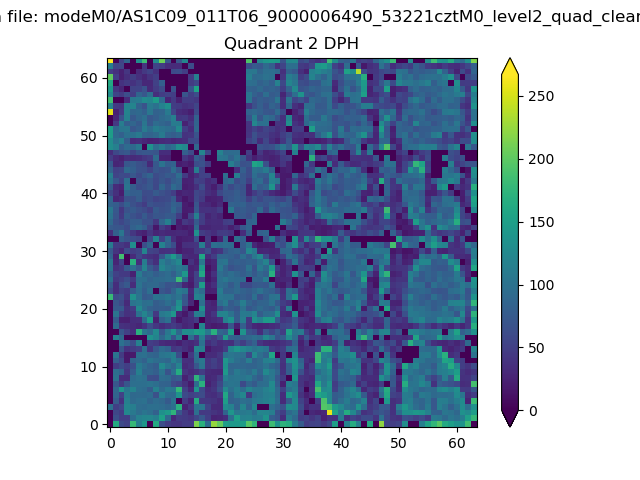
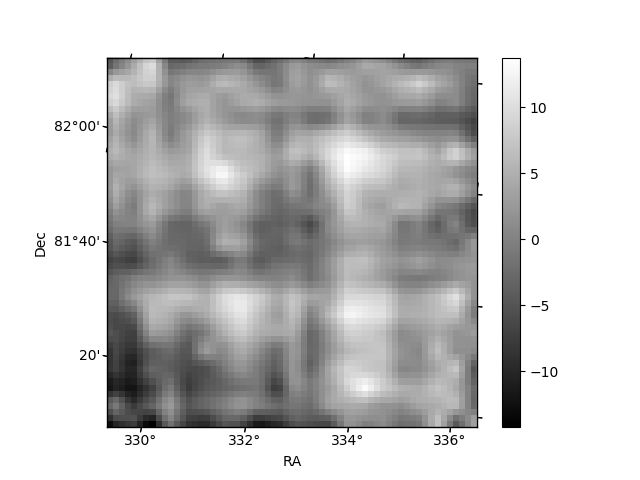
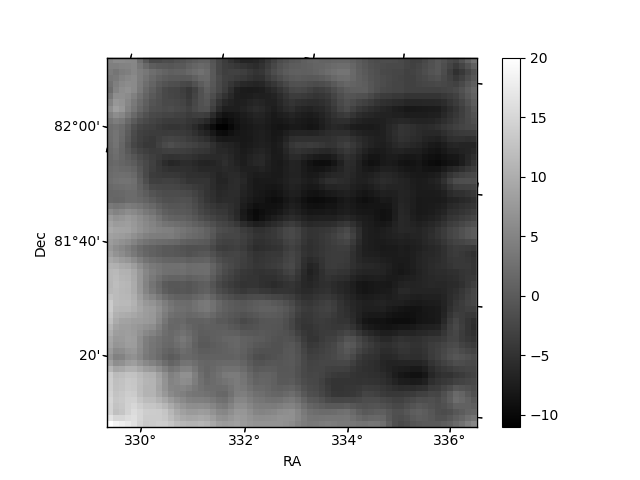
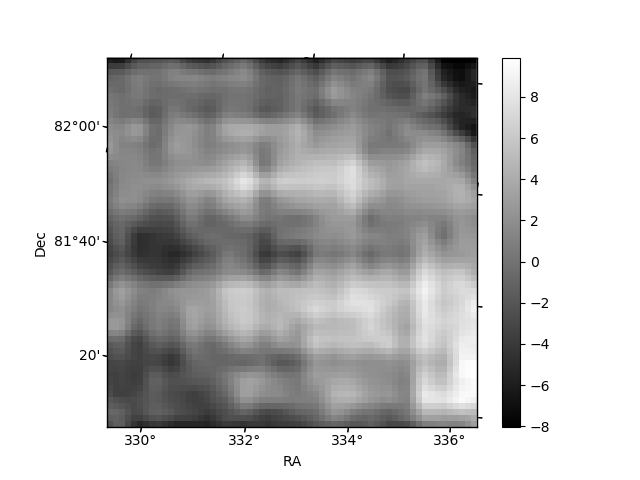
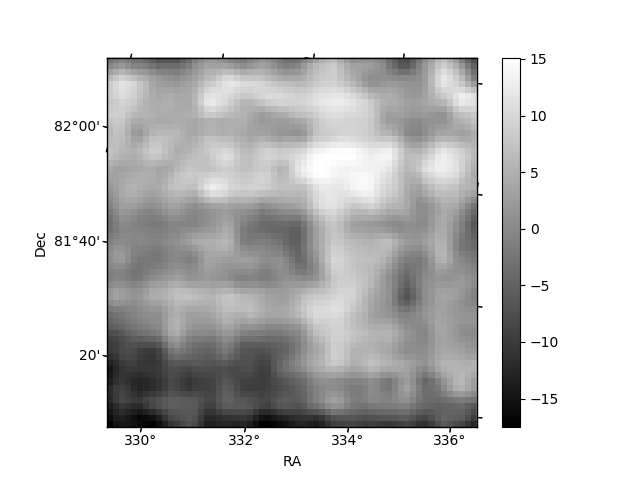
Histogram calculated using DETX and DETY for each event in the final _common_clean file
| Quadrant A | 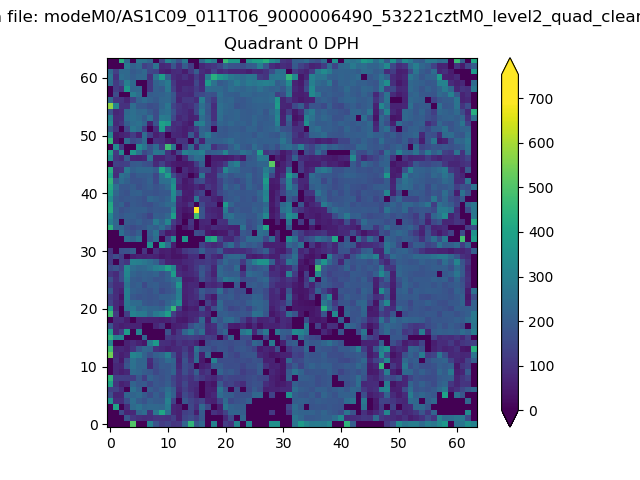 |
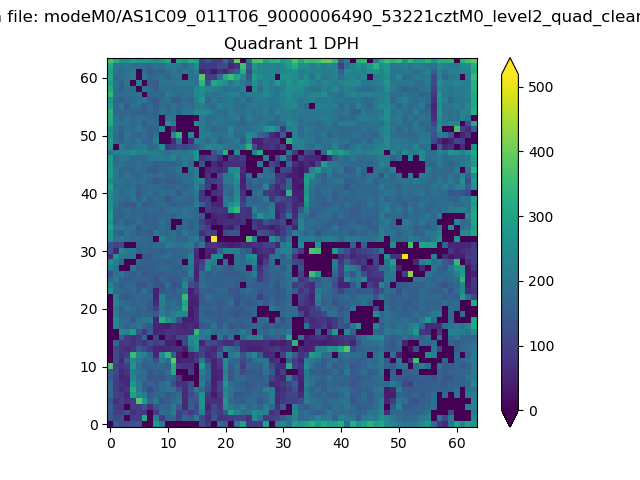 |
Quadrant B |
|---|---|---|---|
| Quadrant D | 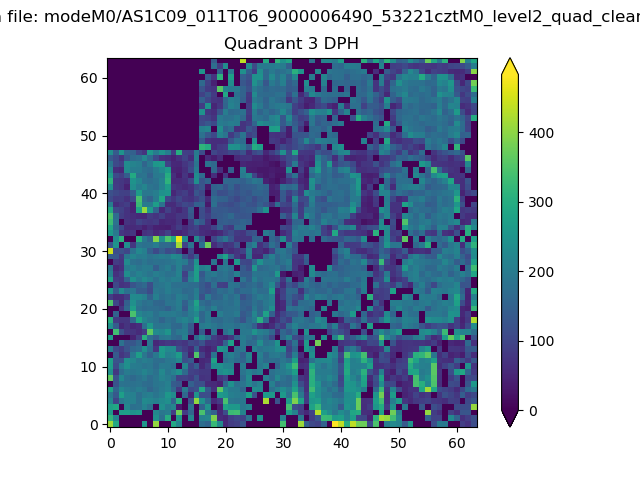 |
 |
Quadrant C |
| Plot type | Count rate plots | Images |
|---|---|---|
| Comparison with Poisson distribution Blue bars denote a histogram of data divided into 1 sec bins. Red curve is a Poisson curve with rate = median count rate of data. |
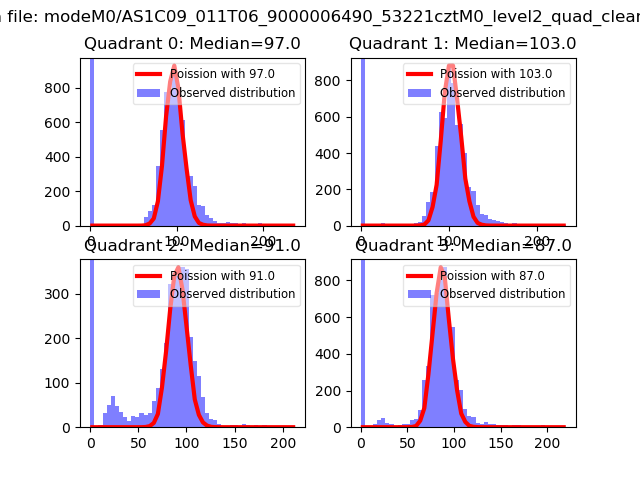 |
 |
| Quadrant-wise count rates Data is divided into 100 sec bins |
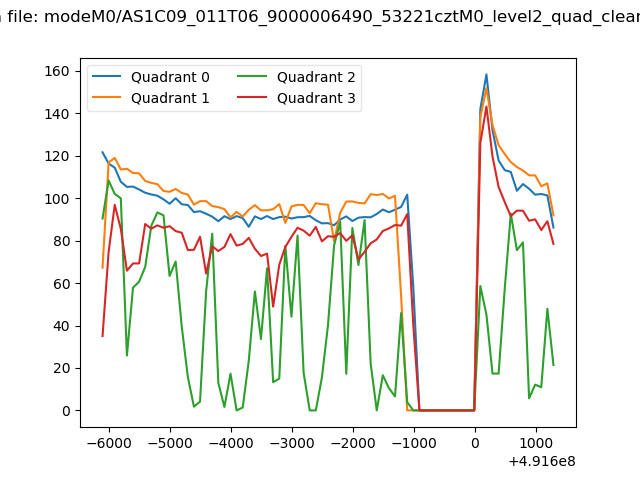 |
|
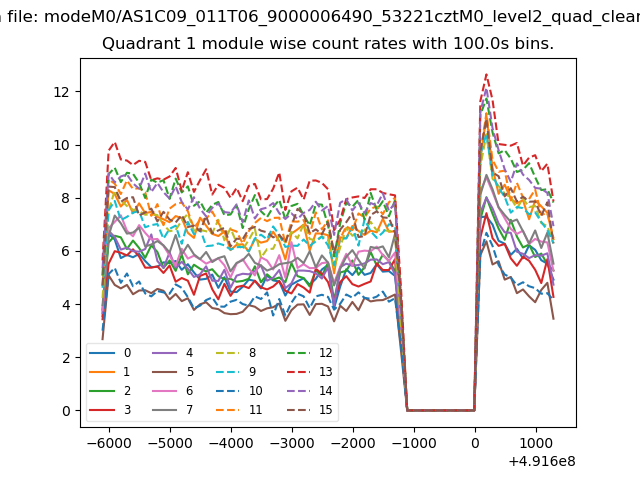
| Module-wise count rates for Quadrant A Data is divided into 100 sec bins |
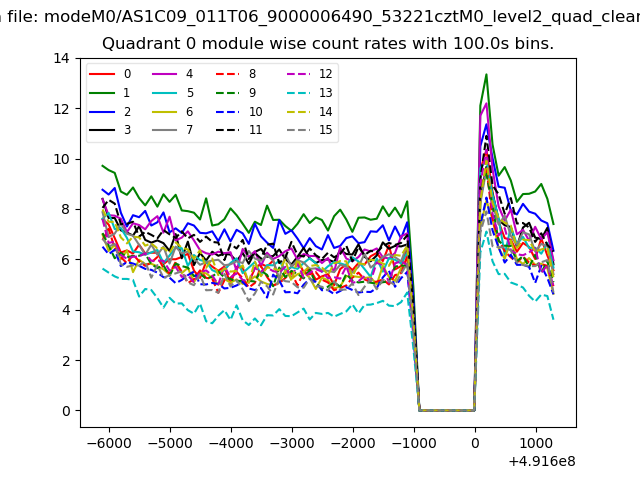 |
 |
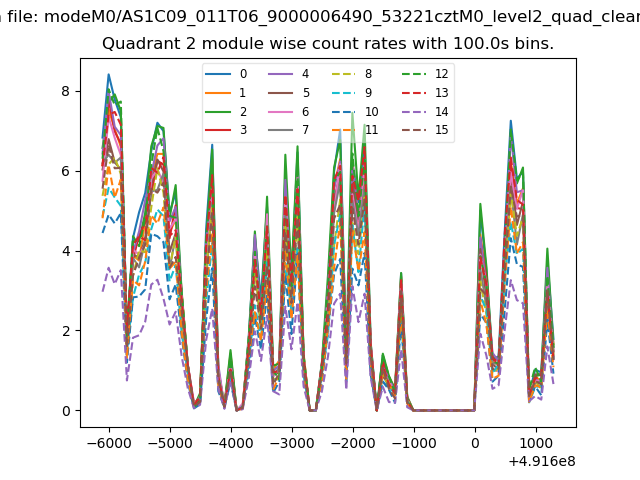
| Module-wise count rates for Quadrant B Data is divided into 100 sec bins |
 |
 |
| Module-wise count rates for Quadrant C Data is divided into 100 sec bins |
 |
 |
| Module-wise count rates for Quadrant D Data is divided into 100 sec bins |
 |
 |
| Parameter | Plot |
|---|---|
| CZT HV Monitor | 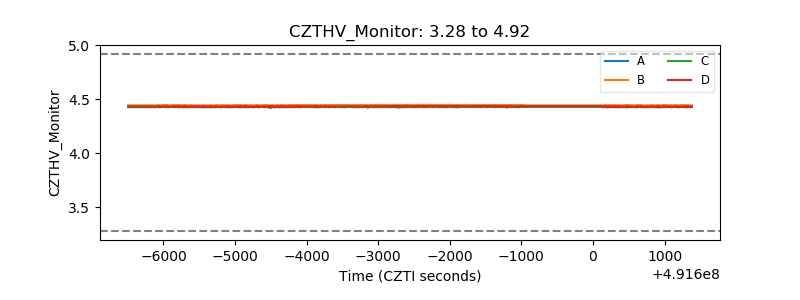 |
| D_VDD | 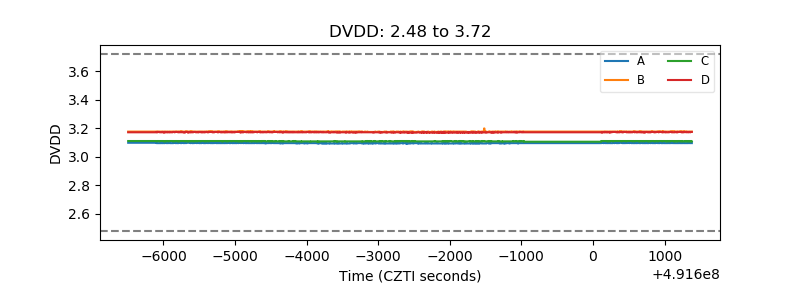 |
| Temperature 1 | 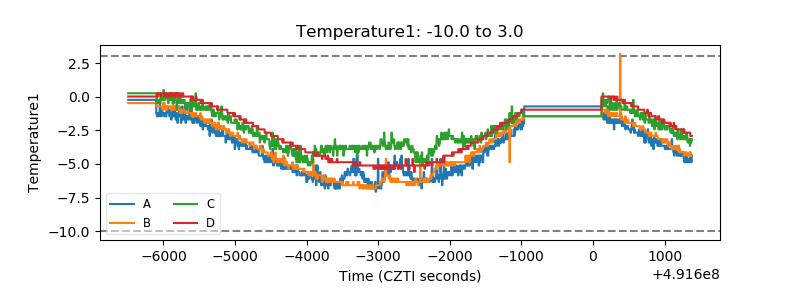 |
| Veto HV Monitor | 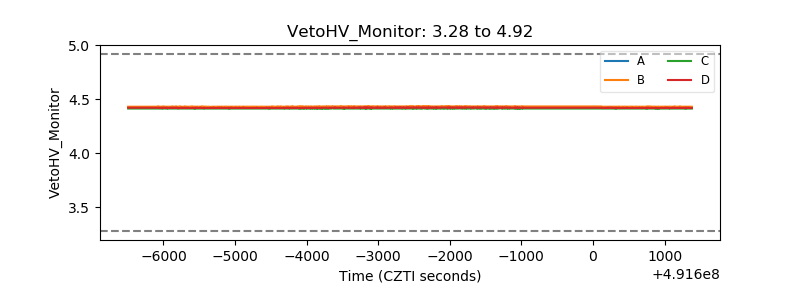 |
| Veto LLD | 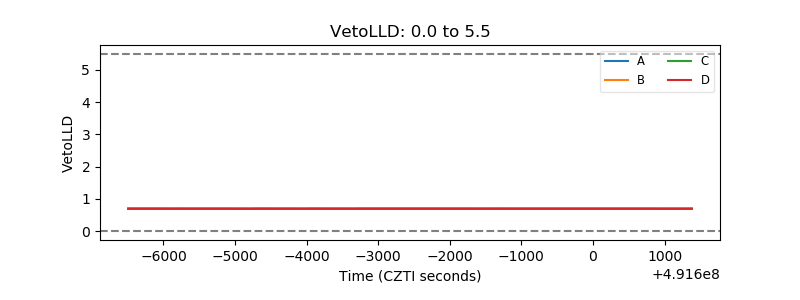 |
| Alpha Counter | 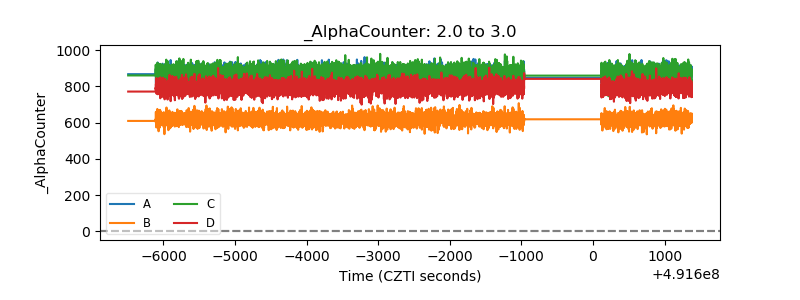 |
| _CPM_Rate | 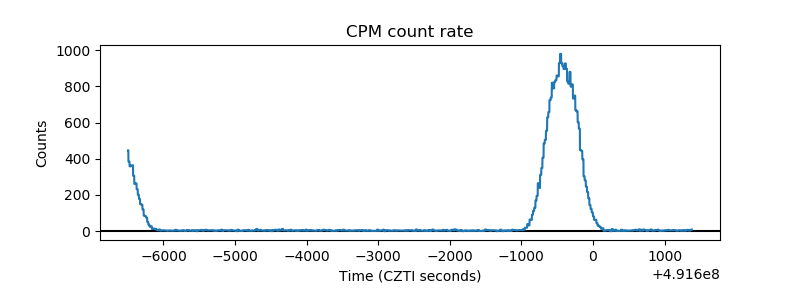 |
| CZT Counter | 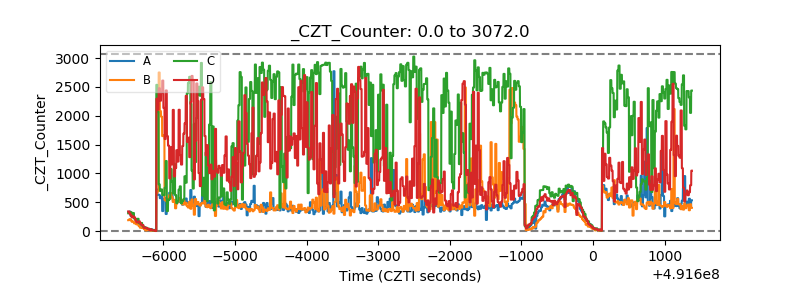 |
| +2.5 Volts monitor |  |
| +5 Volts monitor |  |
| _ROLL_ROT | 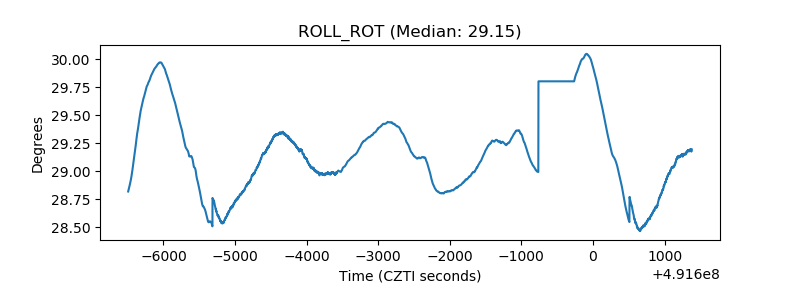 |
| _Roll_DEC | 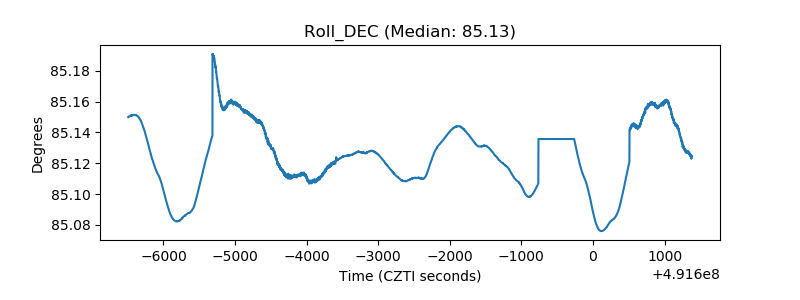 |
| _Roll_RA | 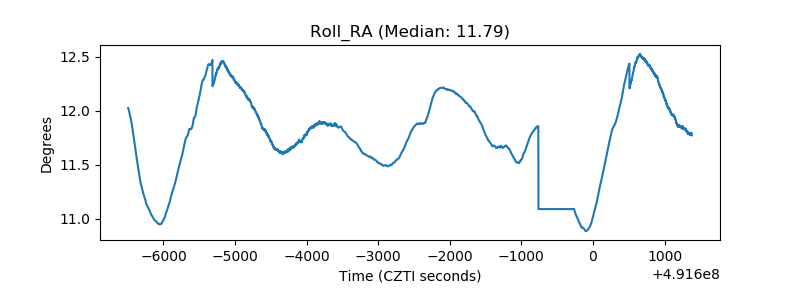 |
| Veto Counter | 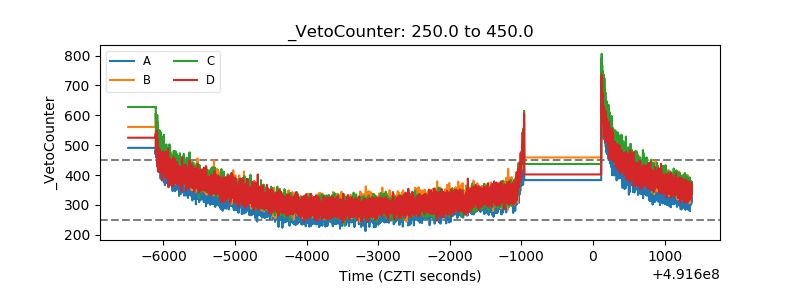 |