| Param | Original file | Final file |
|---|---|---|
| Filename | modeM0/AS1C09_011T06_9000006490_53223cztM0_level2.fits | modeM0/AS1C09_011T06_9000006490_53223cztM0_level2_quad_clean.evt |
| Size (bytes) | 698,952,960 | 88,577,280 |
| Size | 666.6 MB | 84.5 MB |
| Events in quadrant A | 3,511,196 | 627,201 |
| Events in quadrant B | 3,911,805 | 683,762 |
| Events in quadrant C | 12,127,500 | 391,068 |
| Events in quadrant D | 5,830,649 | 536,037 |
| Mode M9 | |||
|---|---|---|---|
| Quadrant | BADHDUFLAG | Total packets | Discarded packets |
| A | 0 | 15 | 0 |
| B | 0 | 16 | 0 |
| C | 0 | 16 | 0 |
| D | 0 | 16 | 0 |
| Mode SS | |||
|---|---|---|---|
| Quadrant | BADHDUFLAG | Total packets | Discarded packets |
| A | 0 | 130 | 0 |
| B | 0 | 130 | 0 |
| C | 0 | 130 | 0 |
| D | 0 | 130 | 0 |
| Mode M0 | |||
|---|---|---|---|
| Quadrant | BADHDUFLAG | Total packets | Discarded packets |
| A | 0 | 15048 | 3 |
| B | 0 | 16037 | 2 |
| C | 0 | 40424 | 2 |
| D | 0 | 21806 | 2 |
| Quadrant | Total seconds | Saturated seconds | Saturation percentage |
|---|---|---|---|
| A | 6356 | 158 | 2.485840% |
| B | 6356 | 139 | 2.186910% |
| C | 6356 | 2657 | 41.803021% |
| D | 6356 | 616 | 9.691630% |
Noise dominated data is calculated using 1-second bins in cleaned event files. If a bin has >2000 counts, and if more than 50% of those come from <1% of pixels, then it is considered to be noise-dominated and hence unusable.
| Quadrant | # 1 sec bins | Bins with >0 counts | Bins with >2000 counts | High rate bins dominated by noise | Noise dominated (total time) | Noise dominated (detector-on time) | Marked lightcurve |
|---|---|---|---|---|---|---|---|
| A | 7576 | 6357 | 88 | 88 | 1.16% | 1.38% | 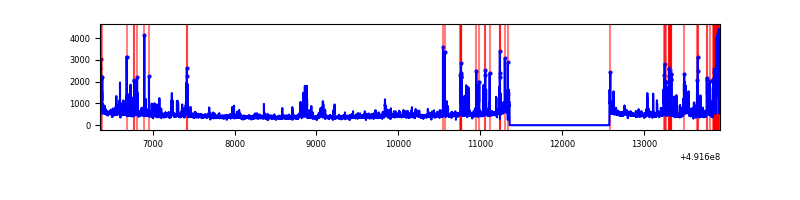 |
| B | 7576 | 6357 | 76 | 76 | 1.00% | 1.20% | 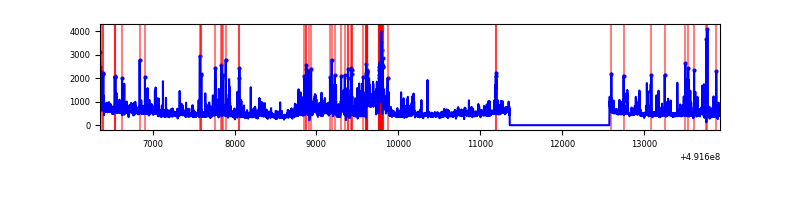 |
| C | 7576 | 6356 | 2745 | 2745 | 36.23% | 43.19% | 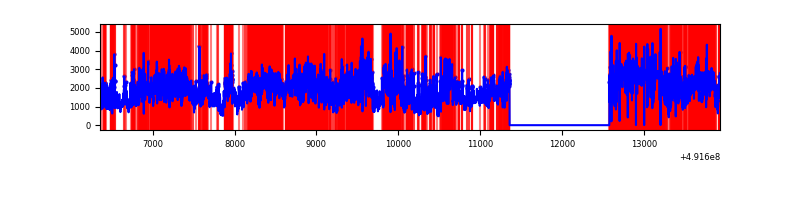 |
| D | 7576 | 6357 | 518 | 518 | 6.84% | 8.15% | 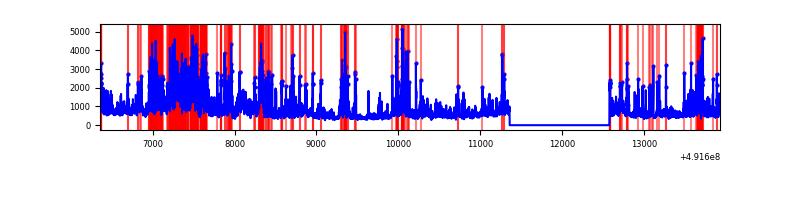 |
Top three noisy pixels from each quadrant. If the there are fewer than three noisy pixels in the level2.evt file, extra rows are filled as -1
| Pixel properties | Quadrant properties | ||||||
|---|---|---|---|---|---|---|---|
| Quadrant | DetID | PixID | Counts | Sigma | Mean | Median | Sigma |
| A | 3 | 62 | 268383 | 1596.78 | 666 | 650 | 167.7 |
| A | 0 | 8 | 175867 | 1045.01 | 666 | 650 | 167.7 |
| A | 4 | 249 | 114508 | 679.06 | 666 | 650 | 167.7 |
| B | 10 | 254 | 362034 | 2588.37 | 668 | 647 | 139.6 |
| B | 2 | 249 | 192975 | 1377.51 | 668 | 647 | 139.6 |
| B | 12 | 3 | 130714 | 931.58 | 668 | 647 | 139.6 |
| C | 9 | 38 | 5019535 | 33279.31 | 541 | 535 | 150.8 |
| C | 1 | 241 | 2601950 | 17249.11 | 541 | 535 | 150.8 |
| C | 15 | 224 | 1190829 | 7892.44 | 541 | 535 | 150.8 |
| D | 6 | 239 | 1242828 | 6857.32 | 628 | 600 | 181.2 |
| D | 15 | 125 | 892803 | 4925.12 | 628 | 600 | 181.2 |
| D | 12 | 3 | 291965 | 1608.39 | 628 | 600 | 181.2 |
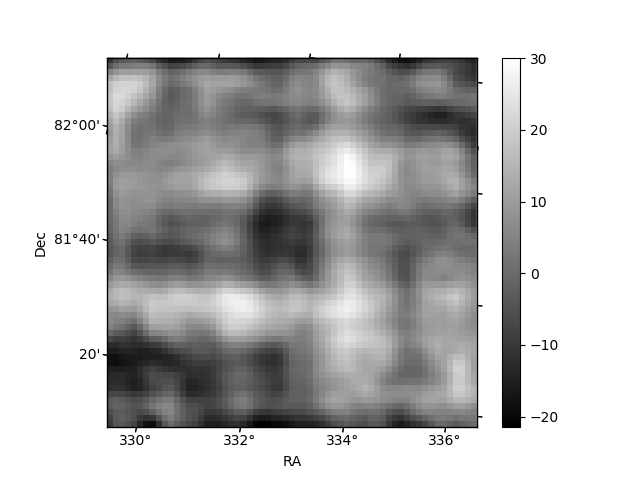
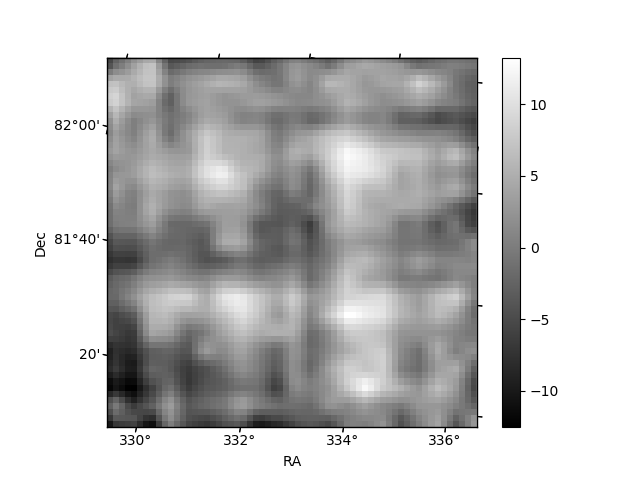
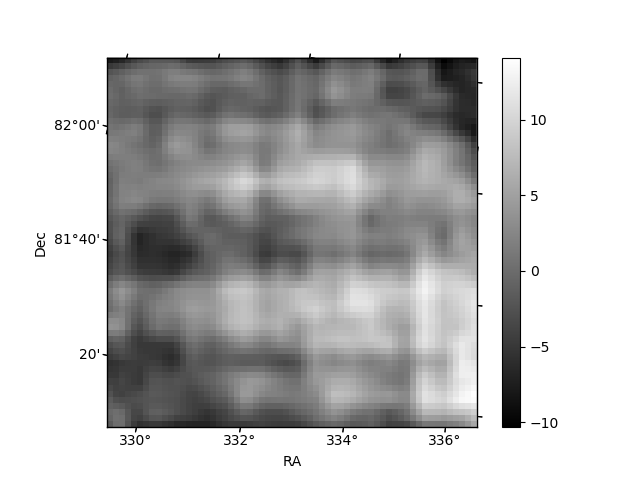
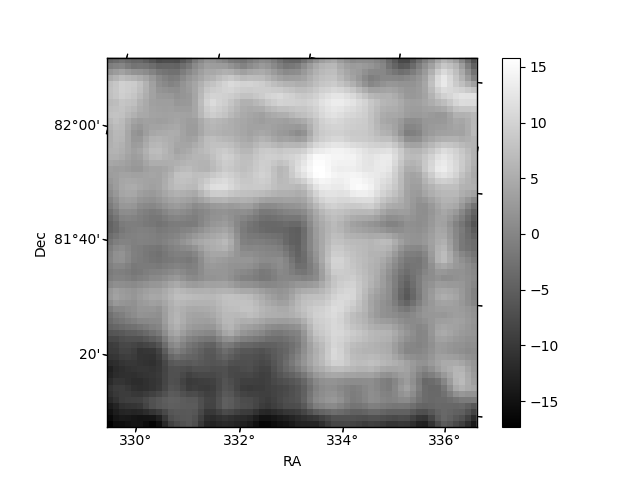
Histogram calculated using DETX and DETY for each event in the final _common_clean file
| Quadrant A | 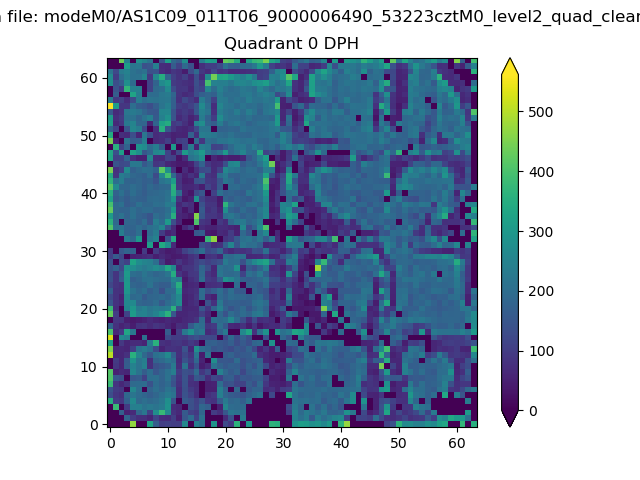 |
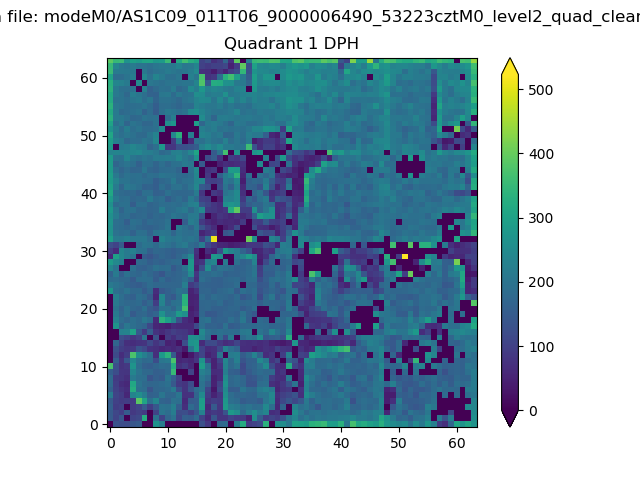 |
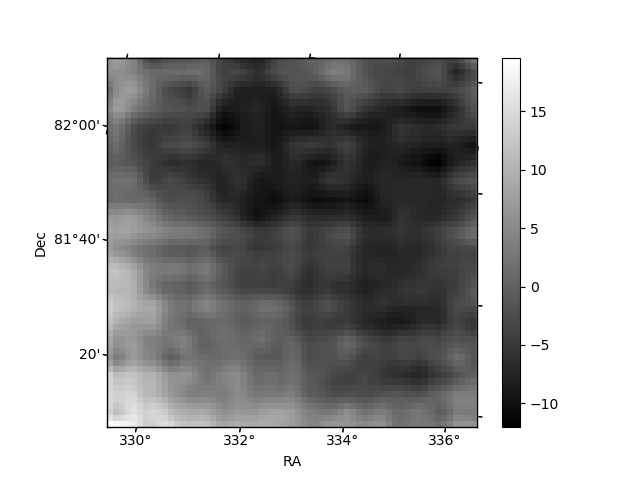
Quadrant B |
|---|---|---|---|
| Quadrant D | 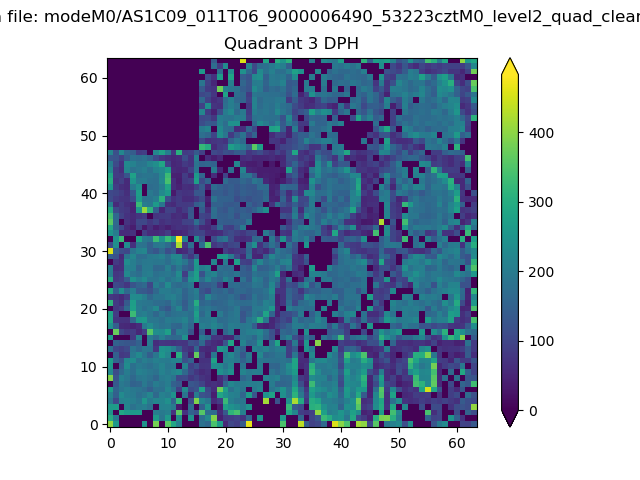 |
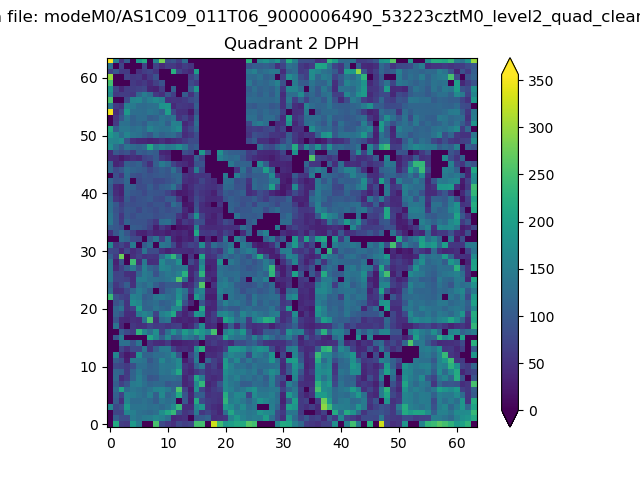 |
Quadrant C |
| Plot type | Count rate plots | Images |
|---|---|---|
| Comparison with Poisson distribution Blue bars denote a histogram of data divided into 1 sec bins. Red curve is a Poisson curve with rate = median count rate of data. |
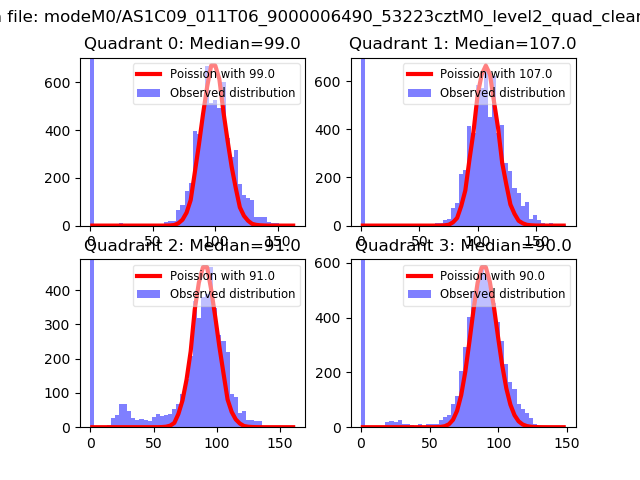 |
 |
| Quadrant-wise count rates Data is divided into 100 sec bins |
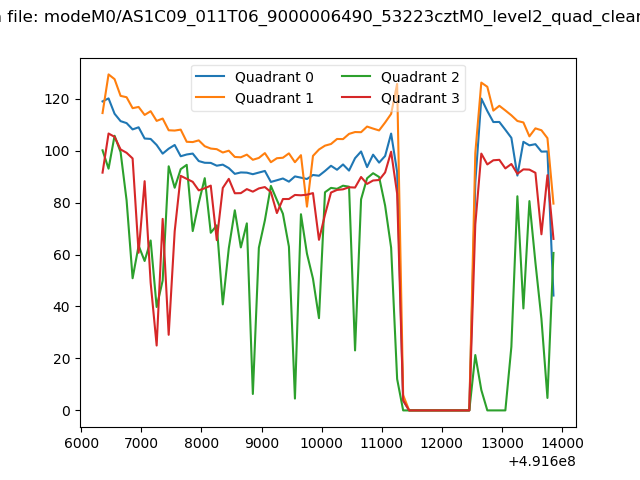 |
|
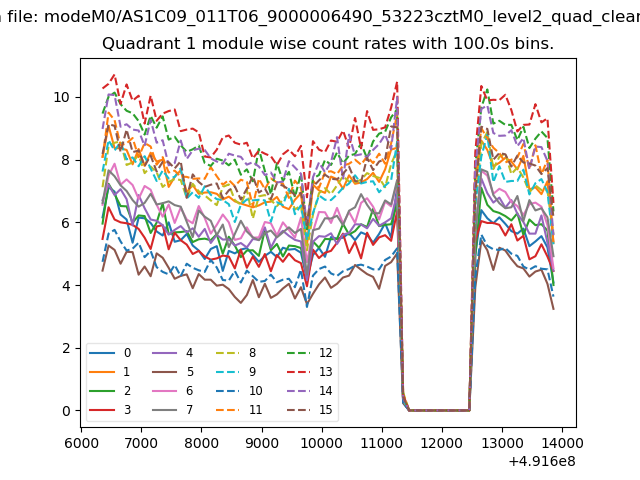
| Module-wise count rates for Quadrant A Data is divided into 100 sec bins |
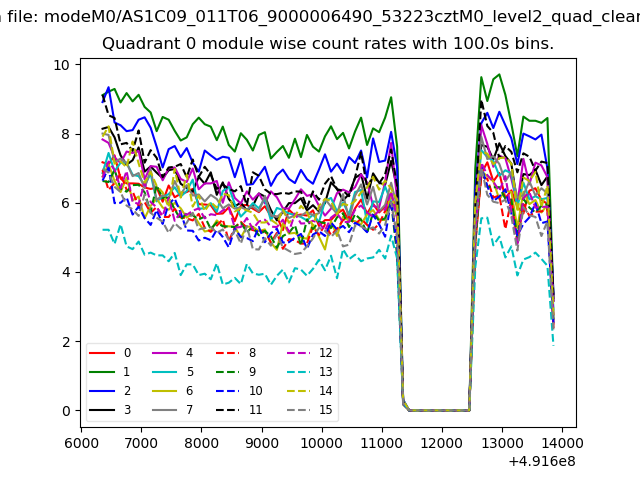 |
 |
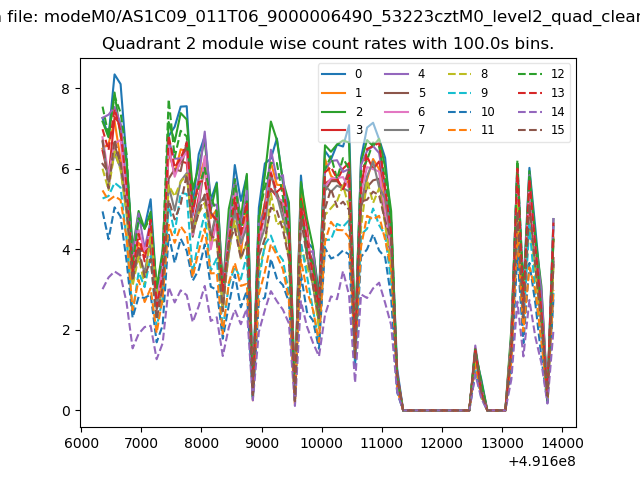
| Module-wise count rates for Quadrant B Data is divided into 100 sec bins |
 |
 |
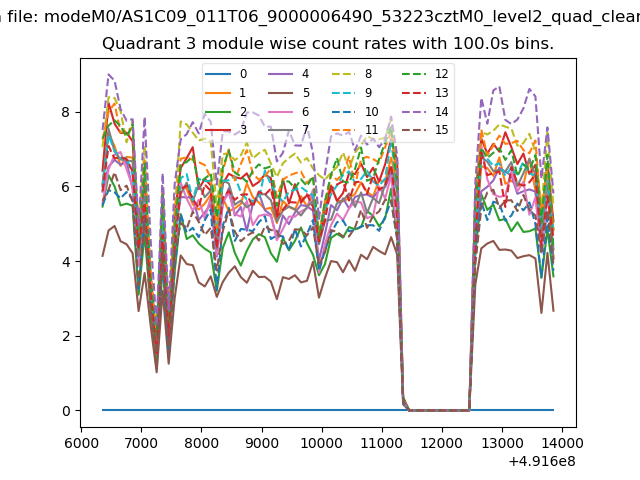
| Module-wise count rates for Quadrant C Data is divided into 100 sec bins |
 |
 |
| Module-wise count rates for Quadrant D Data is divided into 100 sec bins |
 |
 |
| Parameter | Plot |
|---|---|
| CZT HV Monitor | 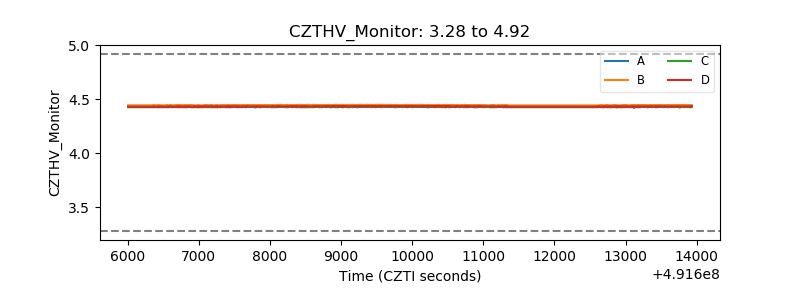 |
| D_VDD | 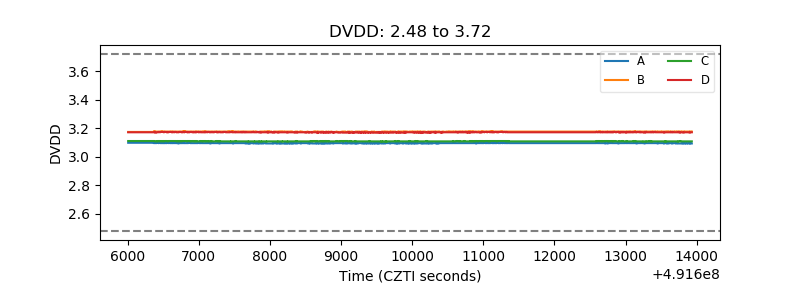 |
| Temperature 1 | 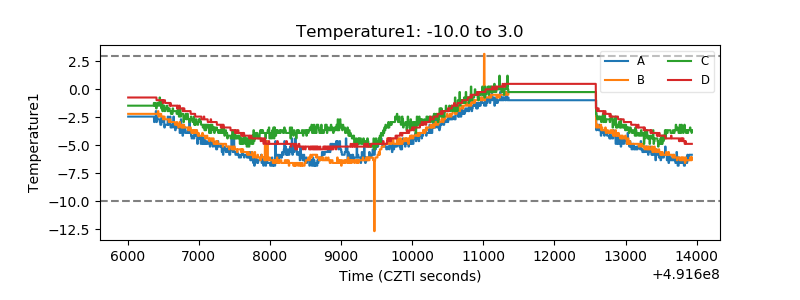 |
| Veto HV Monitor | 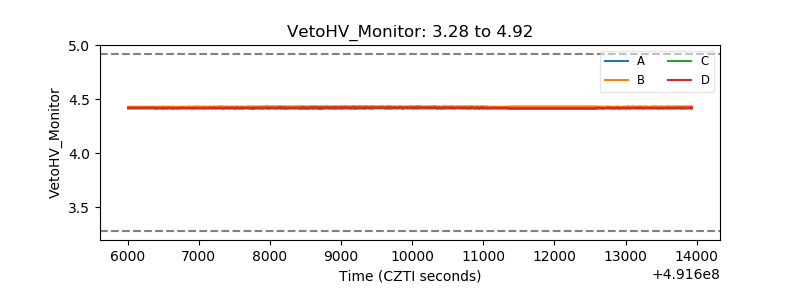 |
| Veto LLD | 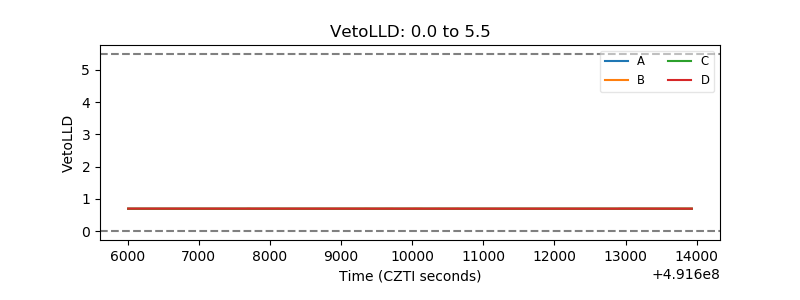 |
| Alpha Counter | 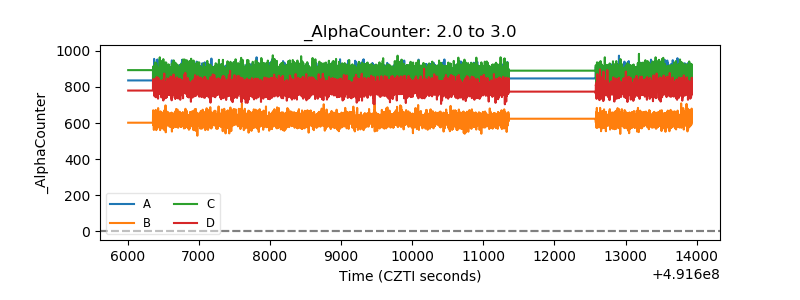 |
| _CPM_Rate | 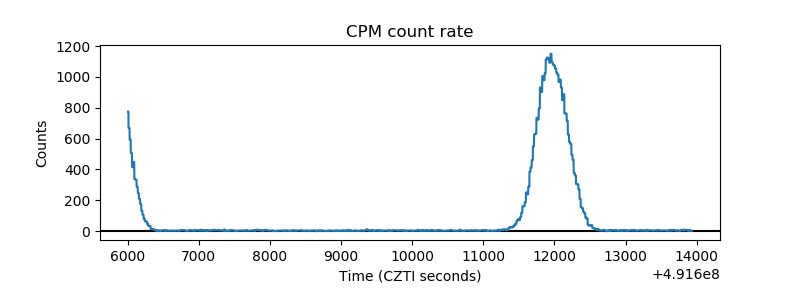 |
| CZT Counter | 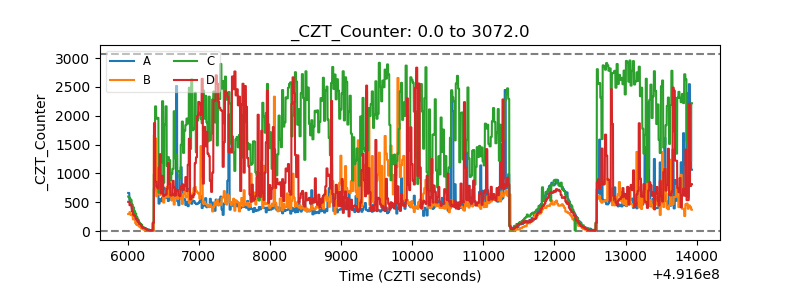 |
| +2.5 Volts monitor |  |
| +5 Volts monitor |  |
| _ROLL_ROT | 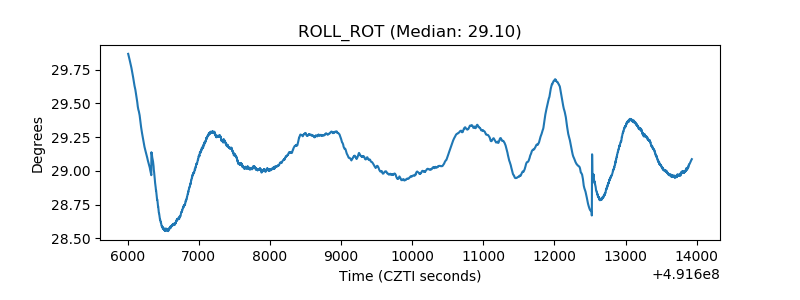 |
| _Roll_DEC | 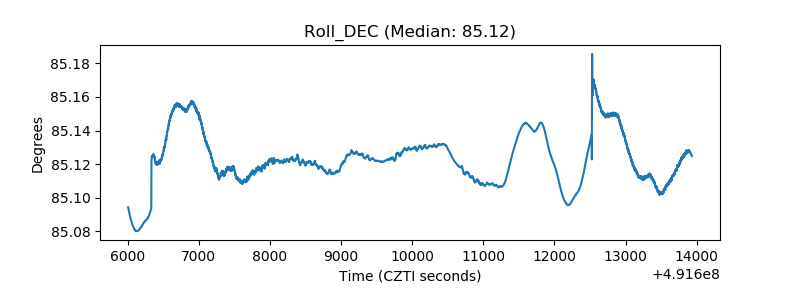 |
| _Roll_RA | 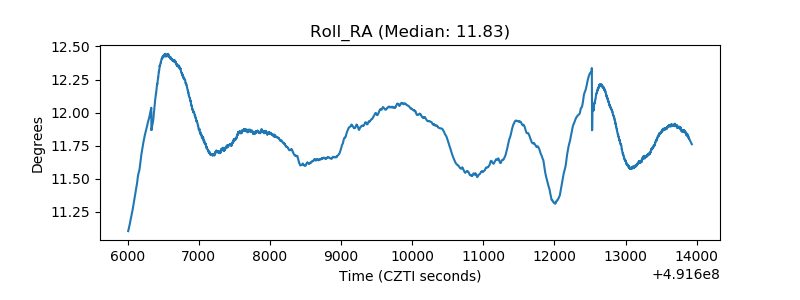 |
| Veto Counter | 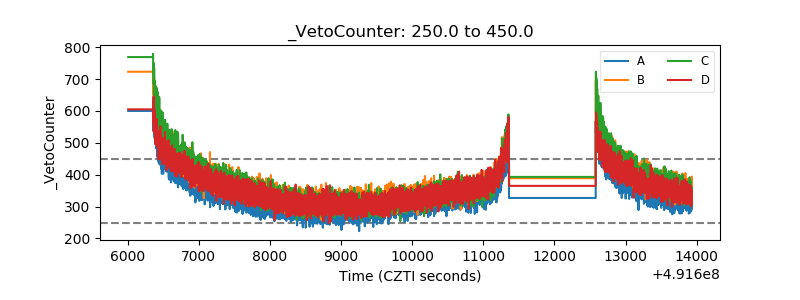 |