| Param | Original file | Final file |
|---|---|---|
| Filename | modeM0/AS1C09_011T06_9000006490_53224cztM0_level2.fits | modeM0/AS1C09_011T06_9000006490_53224cztM0_level2_quad_clean.evt |
| Size (bytes) | 611,389,440 | 89,320,320 |
| Size | 583.1 MB | 85.2 MB |
| Events in quadrant A | 4,040,929 | 615,914 |
| Events in quadrant B | 3,322,539 | 677,130 |
| Events in quadrant C | 9,868,844 | 409,178 |
| Events in quadrant D | 4,905,579 | 557,613 |
| Mode M9 | |||
|---|---|---|---|
| Quadrant | BADHDUFLAG | Total packets | Discarded packets |
| A | 0 | 23 | 0 |
| B | 0 | 24 | 0 |
| C | 0 | 24 | 0 |
| D | 0 | 24 | 0 |
| Mode SS | |||
|---|---|---|---|
| Quadrant | BADHDUFLAG | Total packets | Discarded packets |
| A | 0 | 132 | 0 |
| B | 0 | 132 | 0 |
| C | 0 | 132 | 0 |
| D | 0 | 132 | 0 |
| Mode M0 | |||
|---|---|---|---|
| Quadrant | BADHDUFLAG | Total packets | Discarded packets |
| A | 0 | 16578 | 2 |
| B | 0 | 14518 | 2 |
| C | 0 | 33755 | 8 |
| D | 0 | 18954 | 2 |
| Quadrant | Total seconds | Saturated seconds | Saturation percentage |
|---|---|---|---|
| A | 6371 | 229 | 3.594412% |
| B | 6371 | 100 | 1.569612% |
| C | 6370 | 2202 | 34.568289% |
| D | 6370 | 253 | 3.971743% |
Noise dominated data is calculated using 1-second bins in cleaned event files. If a bin has >2000 counts, and if more than 50% of those come from <1% of pixels, then it is considered to be noise-dominated and hence unusable.
| Quadrant | # 1 sec bins | Bins with >0 counts | Bins with >2000 counts | High rate bins dominated by noise | Noise dominated (total time) | Noise dominated (detector-on time) | Marked lightcurve |
|---|---|---|---|---|---|---|---|
| A | 7596 | 6372 | 188 | 188 | 2.47% | 2.95% | 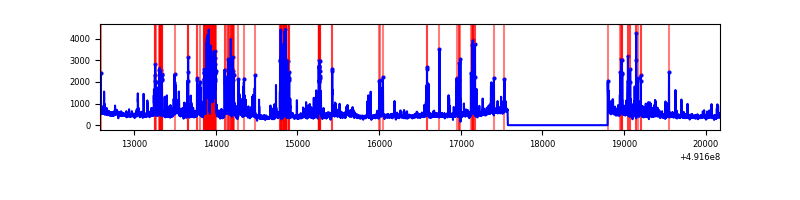 |
| B | 7596 | 6372 | 45 | 45 | 0.59% | 0.71% | 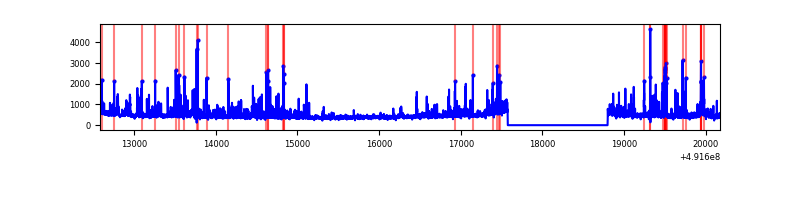 |
| C | 7595 | 6371 | 2133 | 2133 | 28.08% | 33.48% | 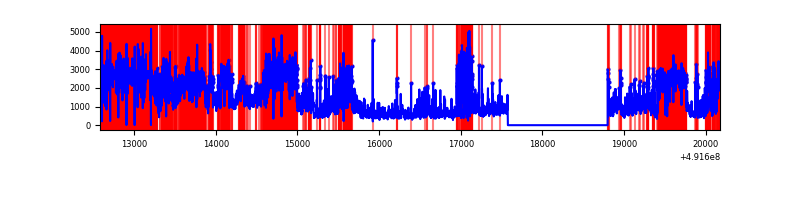 |
| D | 7595 | 6371 | 248 | 248 | 3.27% | 3.89% | 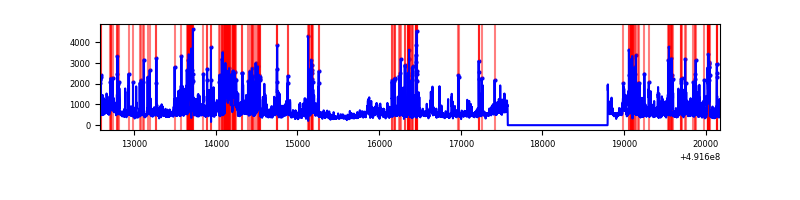 |
Top three noisy pixels from each quadrant. If the there are fewer than three noisy pixels in the level2.evt file, extra rows are filled as -1
| Pixel properties | Quadrant properties | ||||||
|---|---|---|---|---|---|---|---|
| Quadrant | DetID | PixID | Counts | Sigma | Mean | Median | Sigma |
| A | 3 | 62 | 644724 | 3918.06 | 653 | 638 | 164.4 |
| A | 0 | 8 | 297623 | 1806.6 | 653 | 638 | 164.4 |
| A | 15 | 174 | 124173 | 751.48 | 653 | 638 | 164.4 |
| B | 4 | 81 | 163862 | 1179.41 | 660 | 638 | 138.4 |
| B | 12 | 3 | 93728 | 672.64 | 660 | 638 | 138.4 |
| B | 5 | 185 | 89397 | 641.35 | 660 | 638 | 138.4 |
| C | 1 | 241 | 2919718 | 19848.39 | 532 | 528 | 147.1 |
| C | 9 | 38 | 2197744 | 14939.49 | 532 | 528 | 147.1 |
| C | 0 | 240 | 1007695 | 6848.01 | 532 | 528 | 147.1 |
| D | 12 | 3 | 595356 | 3281.19 | 631 | 603 | 181.3 |
| D | 11 | 176 | 337774 | 1860.14 | 631 | 603 | 181.3 |
| D | 6 | 42 | 270883 | 1491.11 | 631 | 603 | 181.3 |
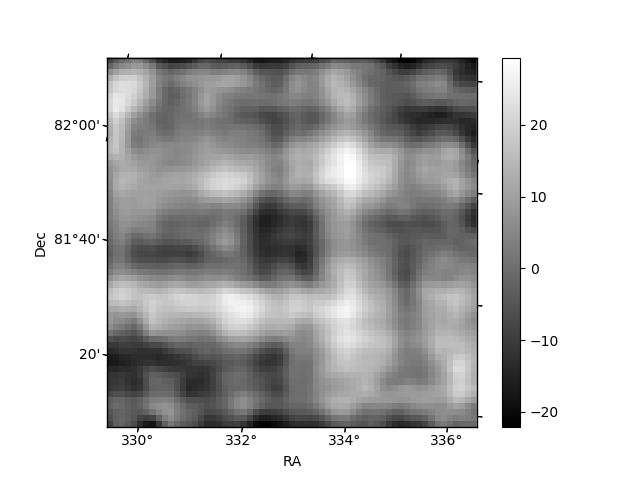
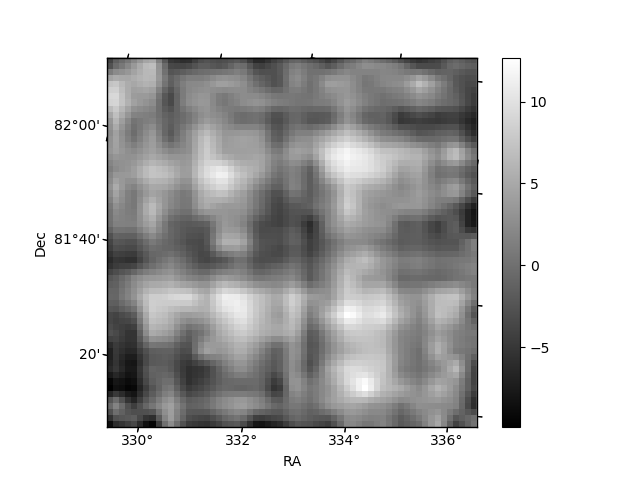
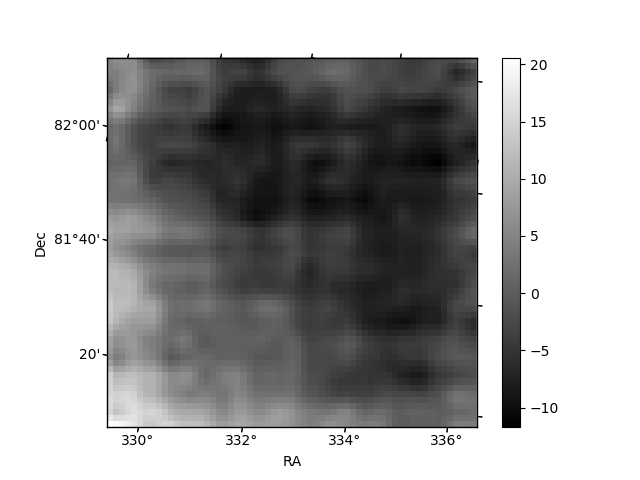
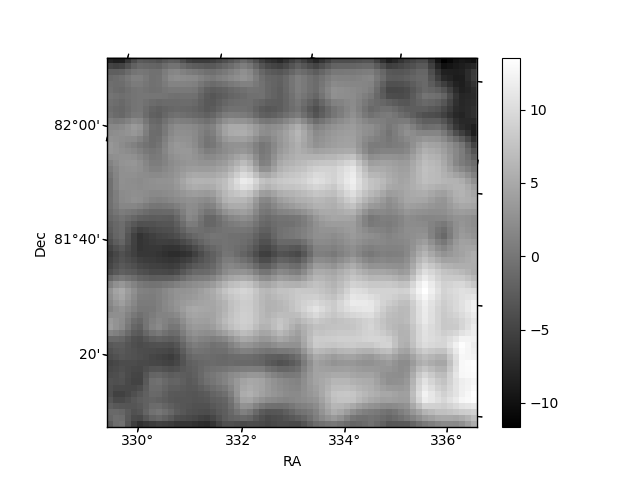
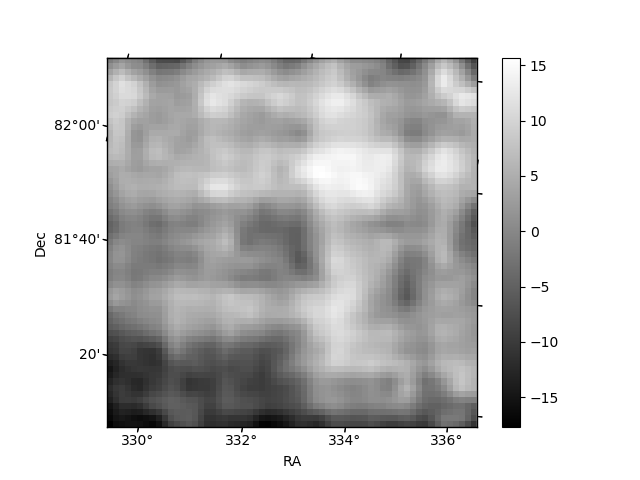
Histogram calculated using DETX and DETY for each event in the final _common_clean file
| Quadrant A | 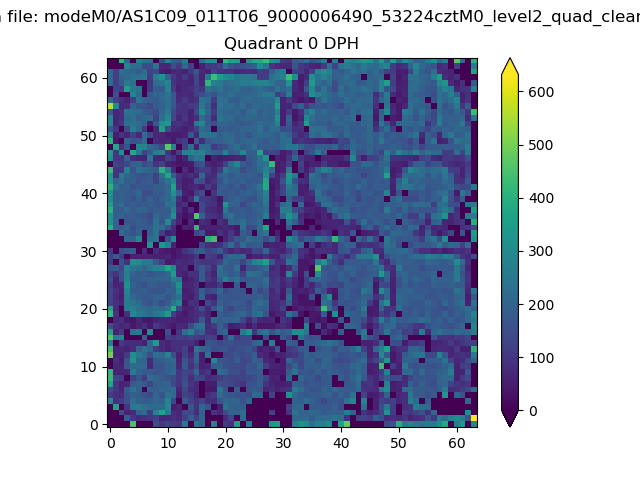 |
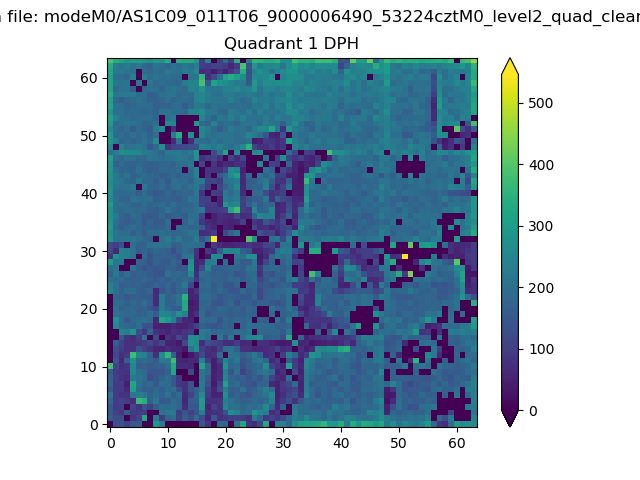 |
Quadrant B |
|---|---|---|---|
| Quadrant D | 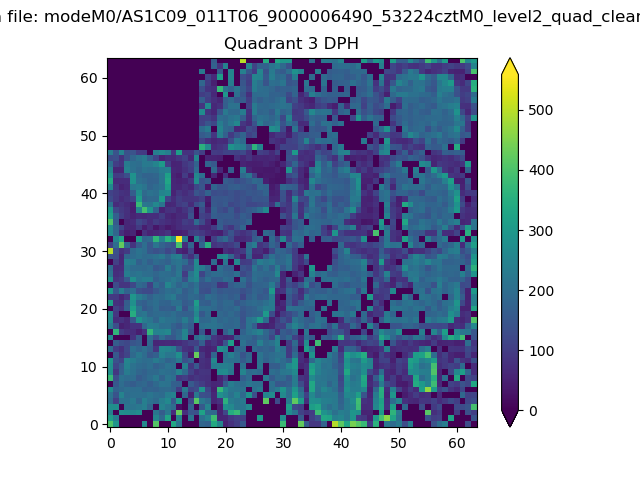 |
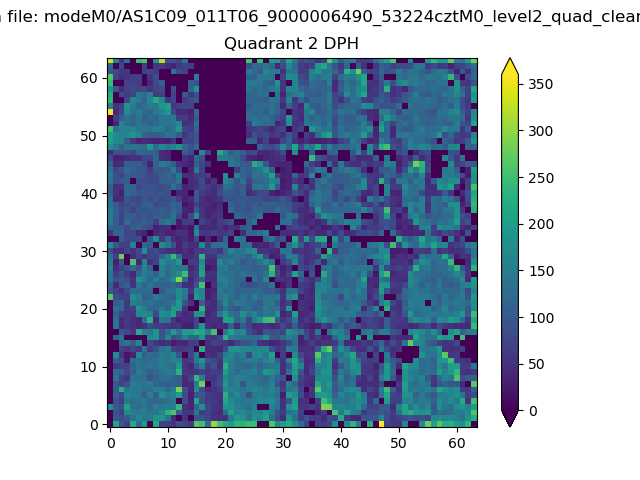 |
Quadrant C |
| Plot type | Count rate plots | Images |
|---|---|---|
| Comparison with Poisson distribution Blue bars denote a histogram of data divided into 1 sec bins. Red curve is a Poisson curve with rate = median count rate of data. |
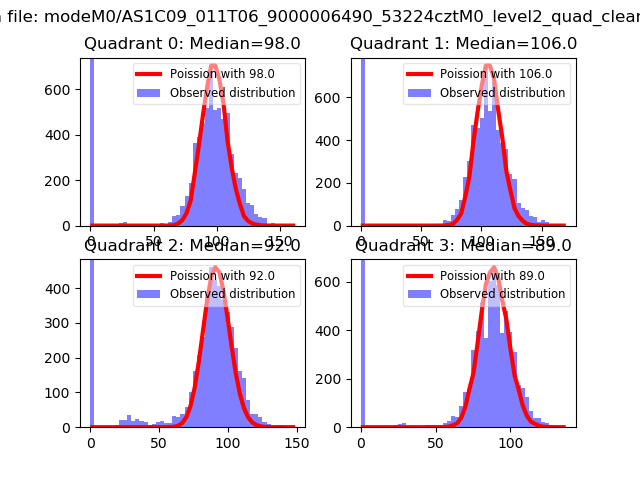 |
 |
| Quadrant-wise count rates Data is divided into 100 sec bins |
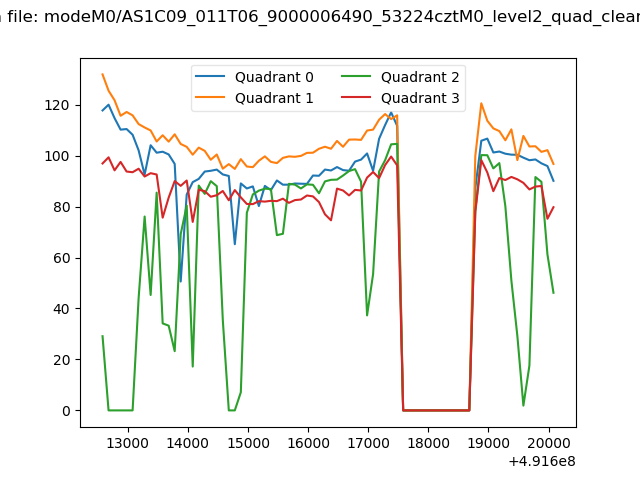 |
|
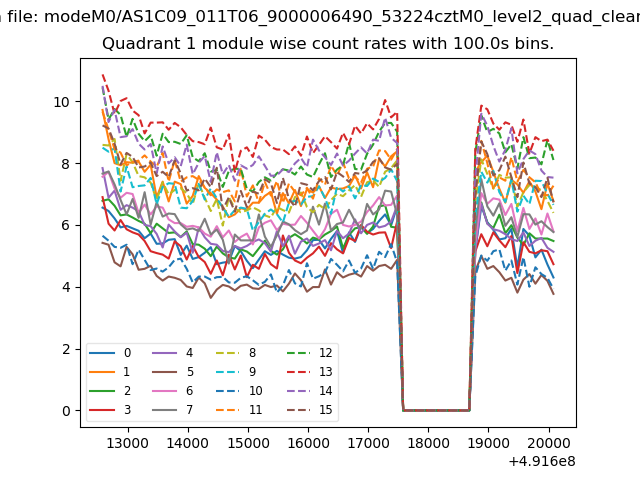
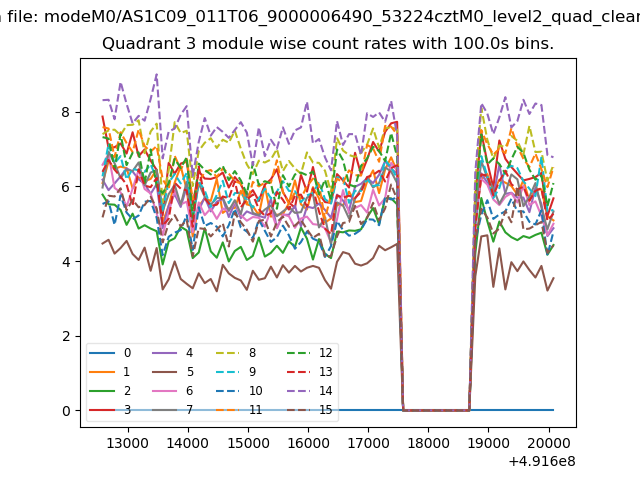
| Module-wise count rates for Quadrant A Data is divided into 100 sec bins |
 |
 |
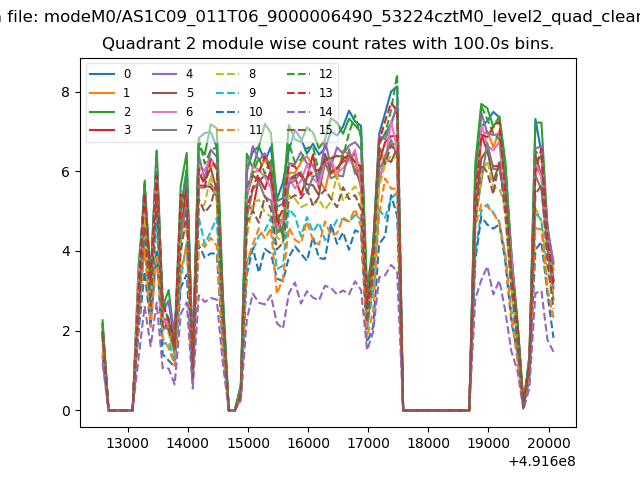
| Module-wise count rates for Quadrant B Data is divided into 100 sec bins |
 |
 |
| Module-wise count rates for Quadrant C Data is divided into 100 sec bins |
 |
 |
| Module-wise count rates for Quadrant D Data is divided into 100 sec bins |
 |
 |
| Parameter | Plot |
|---|---|
| CZT HV Monitor | 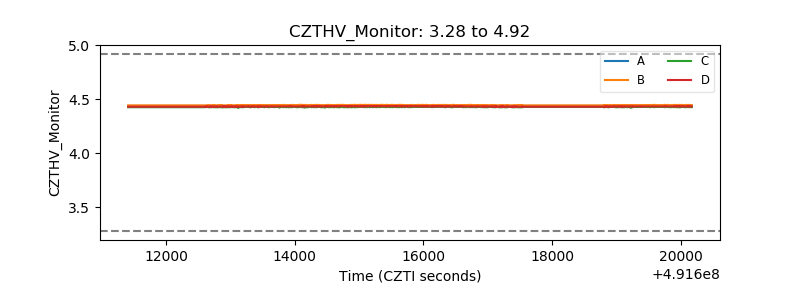 |
| D_VDD | 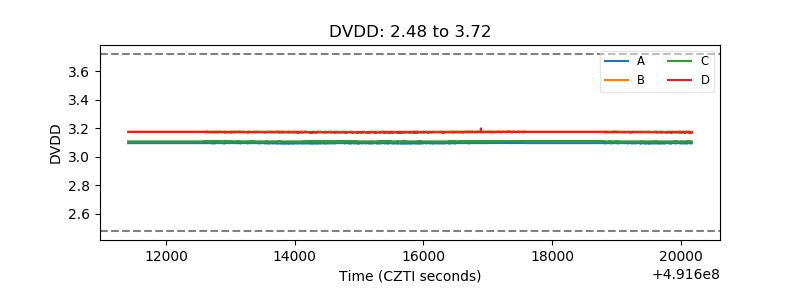 |
| Temperature 1 | 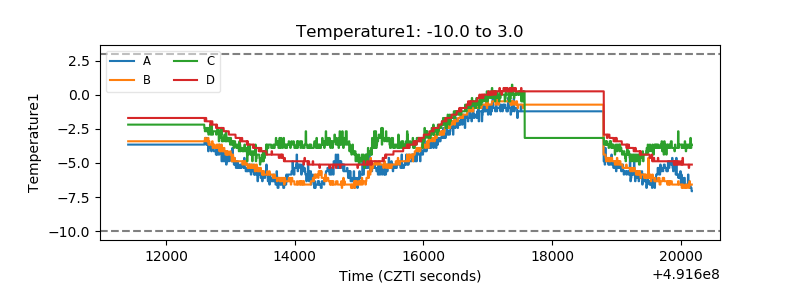 |
| Veto HV Monitor |  |
| Veto LLD | 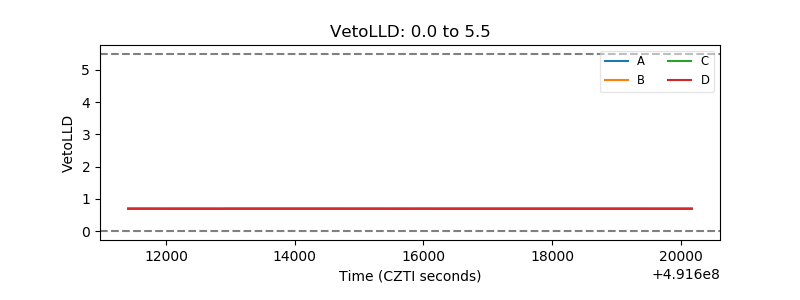 |
| Alpha Counter | 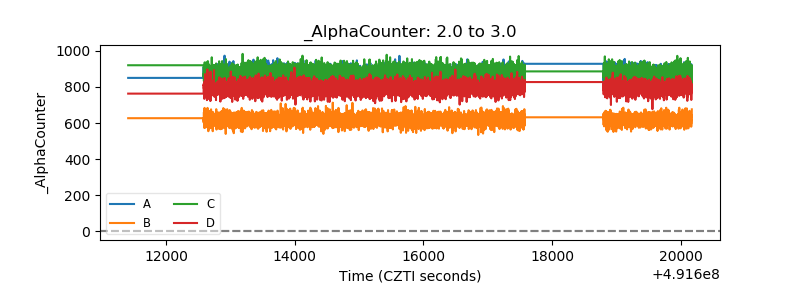 |
| _CPM_Rate | 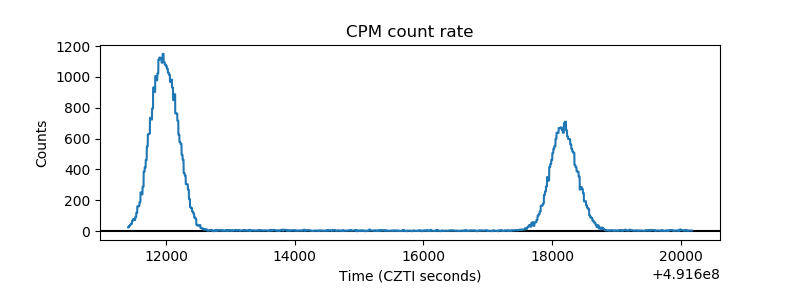 |
| CZT Counter | 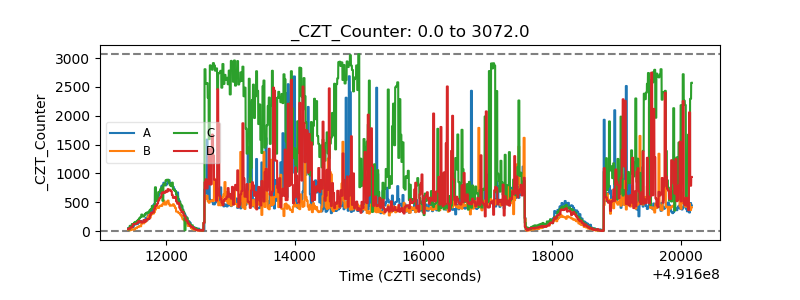 |
| +2.5 Volts monitor |  |
| +5 Volts monitor |  |
| _ROLL_ROT | 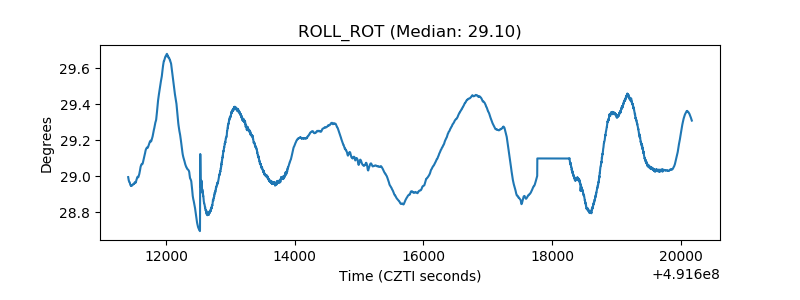 |
| _Roll_DEC | 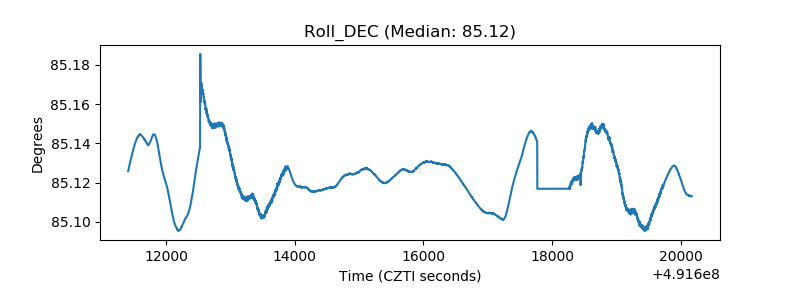 |
| _Roll_RA | 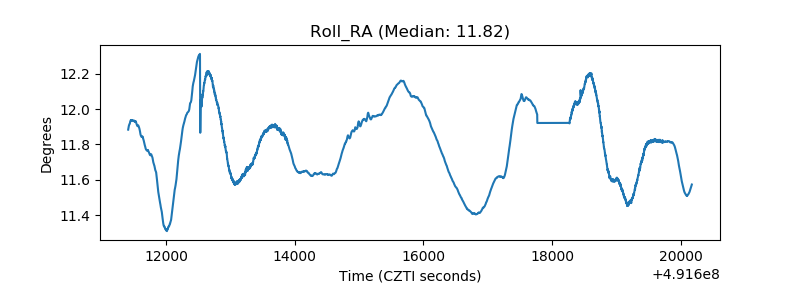 |
| Veto Counter | 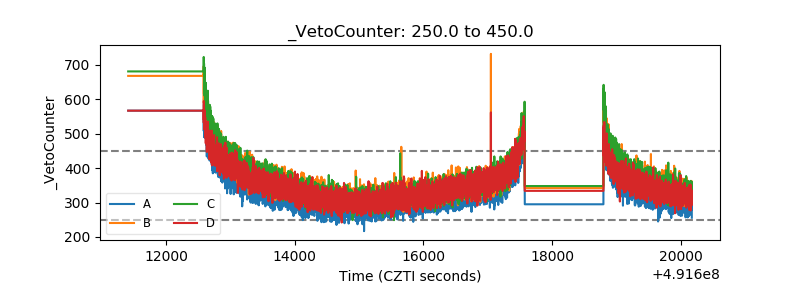 |