| Param | Original file | Final file |
|---|---|---|
| Filename | modeM0/AS1C09_011T06_9000006490_53225cztM0_level2.fits | modeM0/AS1C09_011T06_9000006490_53225cztM0_level2_quad_clean.evt |
| Size (bytes) | 637,545,600 | 91,460,160 |
| Size | 608.0 MB | 87.2 MB |
| Events in quadrant A | 3,471,053 | 639,815 |
| Events in quadrant B | 4,601,545 | 665,814 |
| Events in quadrant C | 9,726,523 | 426,304 |
| Events in quadrant D | 5,278,762 | 567,750 |
| Mode M9 | |||
|---|---|---|---|
| Quadrant | BADHDUFLAG | Total packets | Discarded packets |
| A | 0 | 14 | 0 |
| B | 0 | 15 | 0 |
| C | 0 | 15 | 0 |
| D | 0 | 15 | 0 |
| Mode SS | |||
|---|---|---|---|
| Quadrant | BADHDUFLAG | Total packets | Discarded packets |
| A | 0 | 138 | 0 |
| B | 0 | 138 | 0 |
| C | 0 | 138 | 0 |
| D | 0 | 138 | 0 |
| Mode M0 | |||
|---|---|---|---|
| Quadrant | BADHDUFLAG | Total packets | Discarded packets |
| A | 0 | 15426 | 2 |
| B | 0 | 18448 | 3 |
| C | 0 | 33609 | 2 |
| D | 0 | 20535 | 2 |
| Quadrant | Total seconds | Saturated seconds | Saturation percentage |
|---|---|---|---|
| A | 6730 | 113 | 1.679049% |
| B | 6729 | 431 | 6.405112% |
| C | 6729 | 2243 | 33.333333% |
| D | 6729 | 347 | 5.156784% |
Noise dominated data is calculated using 1-second bins in cleaned event files. If a bin has >2000 counts, and if more than 50% of those come from <1% of pixels, then it is considered to be noise-dominated and hence unusable.
| Quadrant | # 1 sec bins | Bins with >0 counts | Bins with >2000 counts | High rate bins dominated by noise | Noise dominated (total time) | Noise dominated (detector-on time) | Marked lightcurve |
|---|---|---|---|---|---|---|---|
| A | 7805 | 6731 | 86 | 86 | 1.10% | 1.28% | 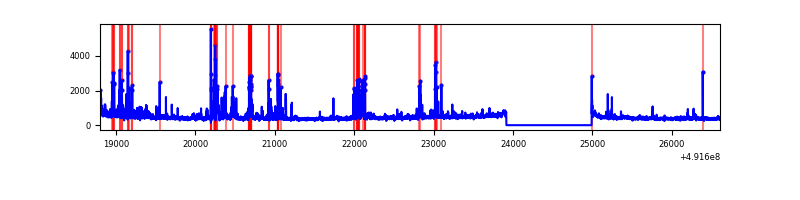 |
| B | 7804 | 6730 | 317 | 317 | 4.06% | 4.71% | 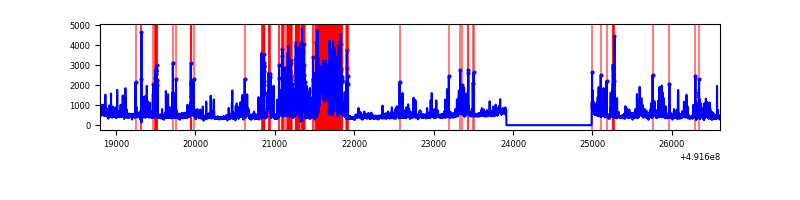 |
| C | 7804 | 6729 | 2077 | 2077 | 26.61% | 30.87% | 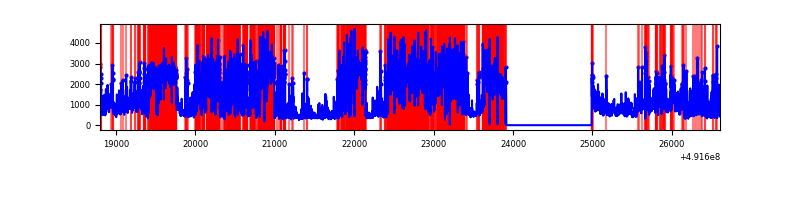 |
| D | 7804 | 6730 | 297 | 297 | 3.81% | 4.41% | 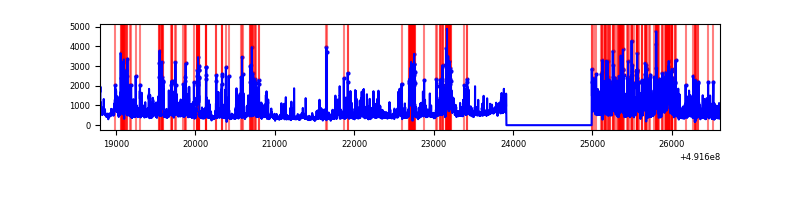 |
Top three noisy pixels from each quadrant. If the there are fewer than three noisy pixels in the level2.evt file, extra rows are filled as -1
| Pixel properties | Quadrant properties | ||||||
|---|---|---|---|---|---|---|---|
| Quadrant | DetID | PixID | Counts | Sigma | Mean | Median | Sigma |
| A | 15 | 174 | 167959 | 977.66 | 683 | 667 | 171.1 |
| A | 3 | 62 | 158371 | 921.63 | 683 | 667 | 171.1 |
| A | 7 | 206 | 118970 | 691.37 | 683 | 667 | 171.1 |
| B | 2 | 249 | 1317047 | 9307.83 | 673 | 652 | 141.4 |
| B | 4 | 81 | 229473 | 1617.92 | 673 | 652 | 141.4 |
| B | 5 | 185 | 65480 | 458.38 | 673 | 652 | 141.4 |
| C | 1 | 241 | 3755567 | 24621.05 | 549 | 543 | 152.5 |
| C | 15 | 224 | 1330152 | 8718.02 | 549 | 543 | 152.5 |
| C | 9 | 38 | 841556 | 5514.38 | 549 | 543 | 152.5 |
| D | 6 | 239 | 568143 | 2983.4 | 651 | 621 | 190.2 |
| D | 12 | 3 | 487804 | 2561.07 | 651 | 621 | 190.2 |
| D | 11 | 176 | 447250 | 2347.88 | 651 | 621 | 190.2 |
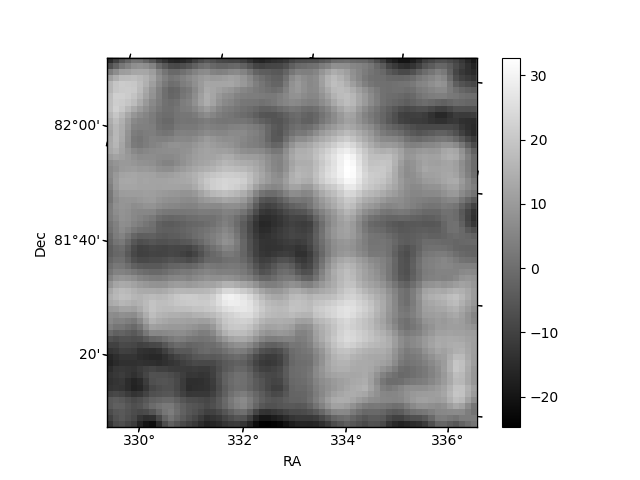
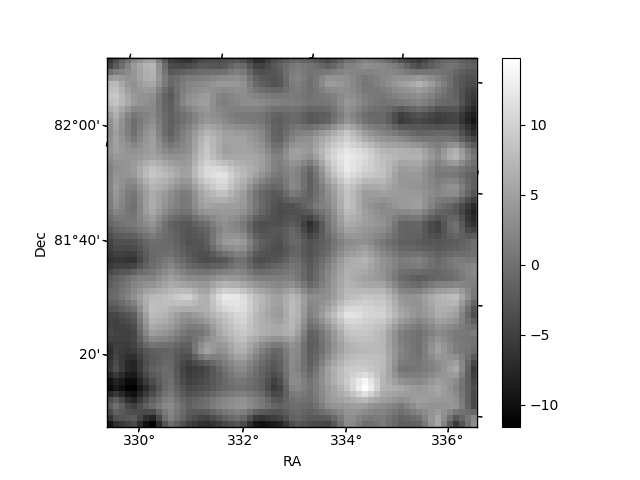
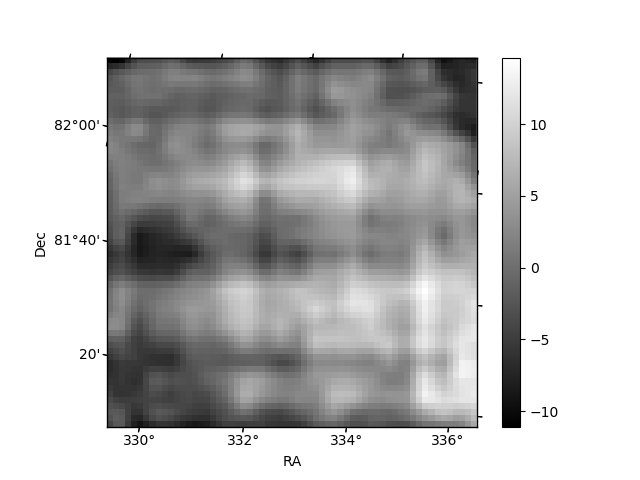
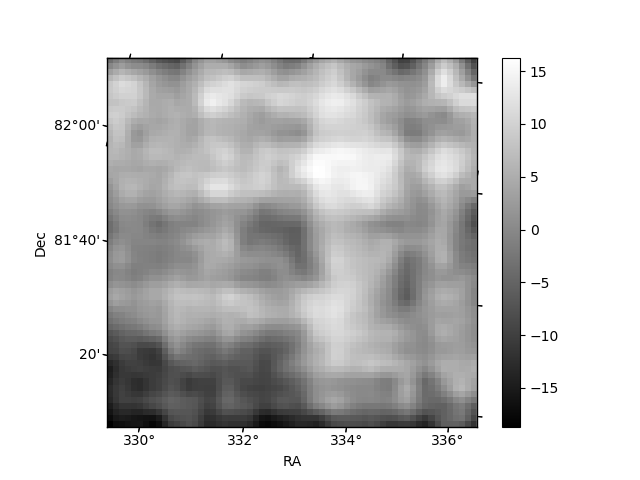
Histogram calculated using DETX and DETY for each event in the final _common_clean file
| Quadrant A | 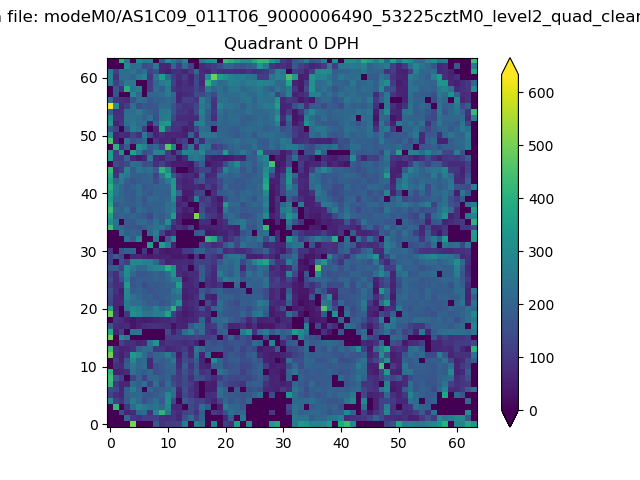 |
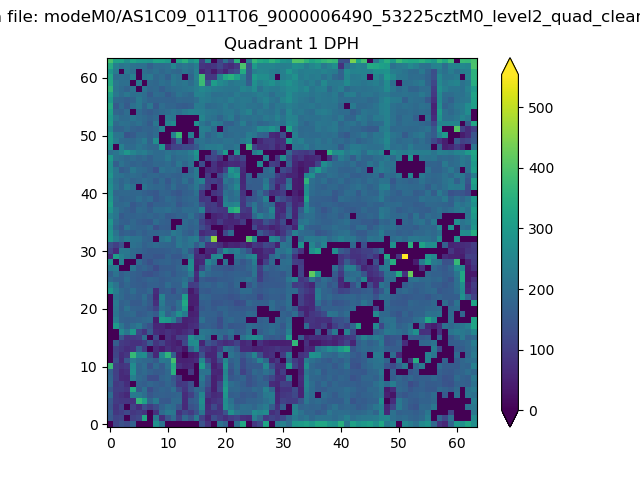 |
Quadrant B |
|---|---|---|---|
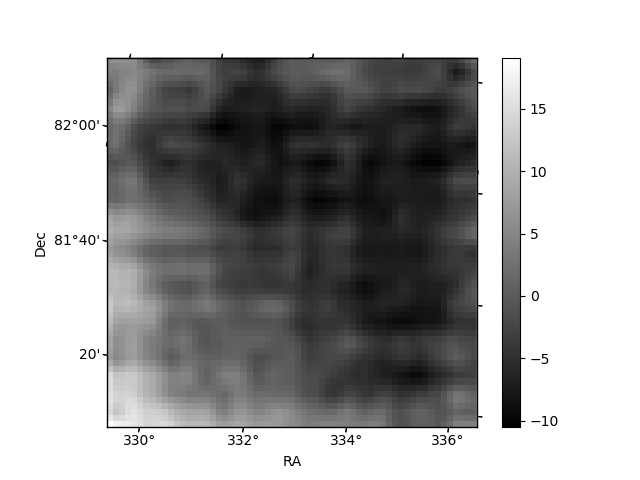
| Quadrant D | 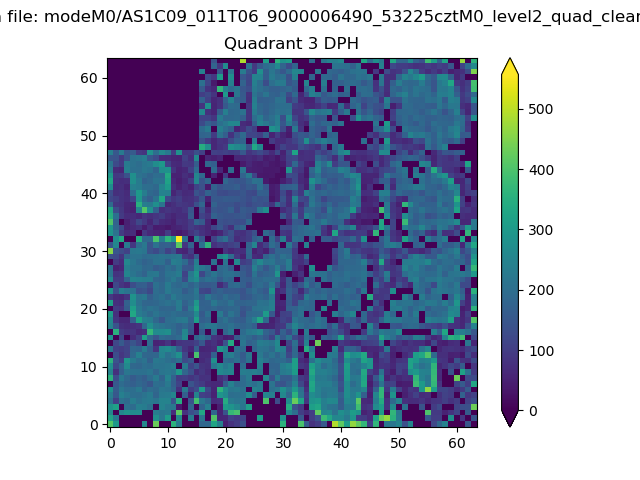 |
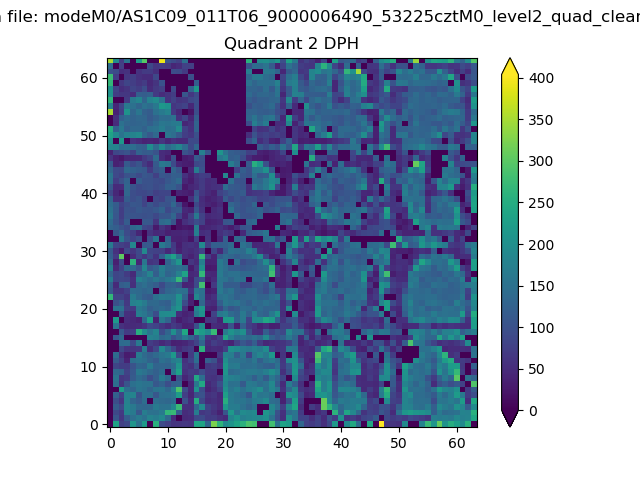 |
Quadrant C |
| Plot type | Count rate plots | Images |
|---|---|---|
| Comparison with Poisson distribution Blue bars denote a histogram of data divided into 1 sec bins. Red curve is a Poisson curve with rate = median count rate of data. |
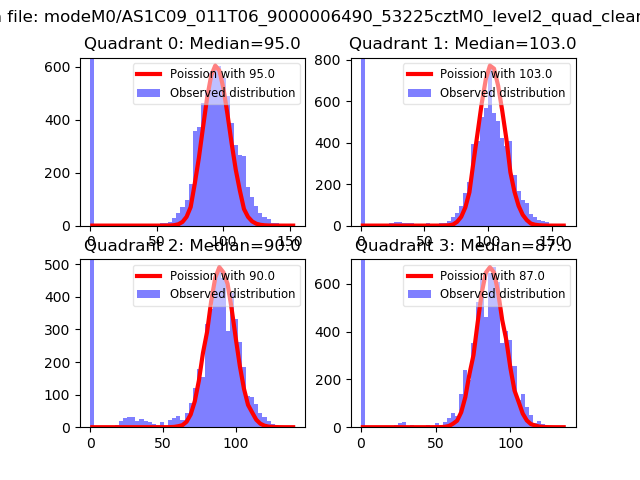 |
 |
| Quadrant-wise count rates Data is divided into 100 sec bins |
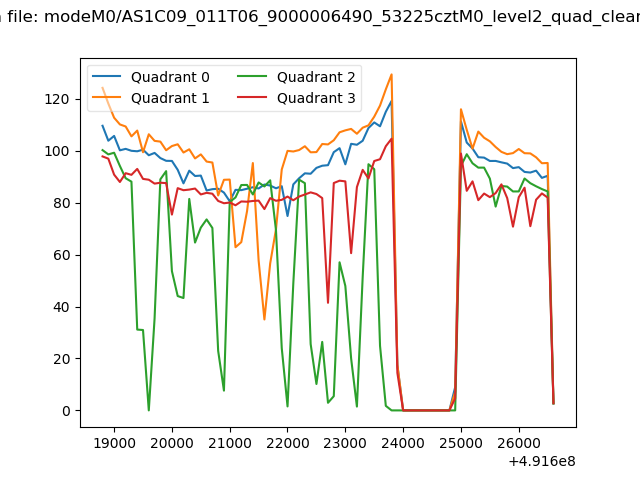 |
|
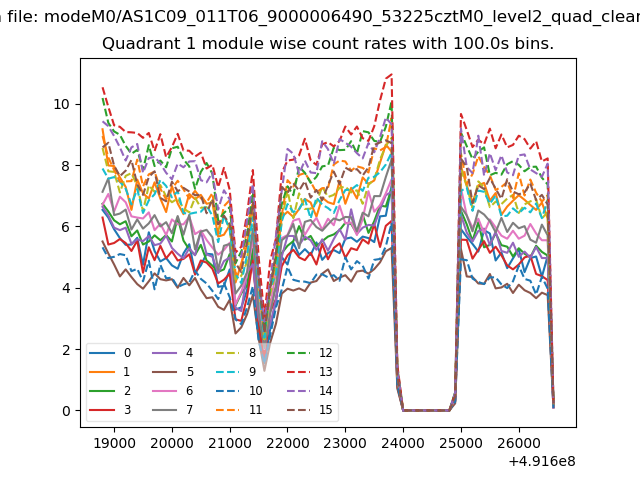
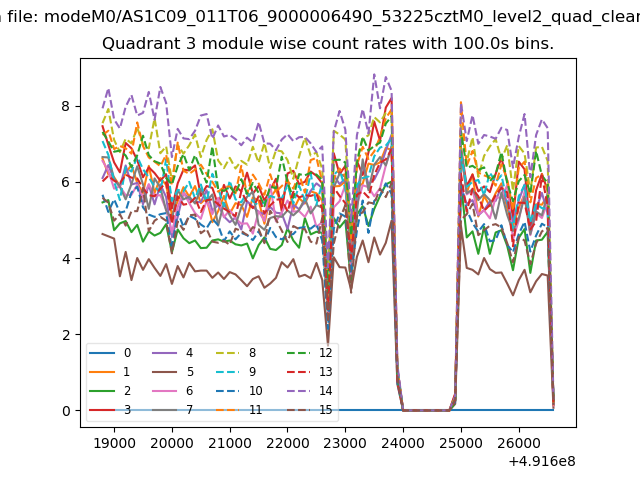
| Module-wise count rates for Quadrant A Data is divided into 100 sec bins |
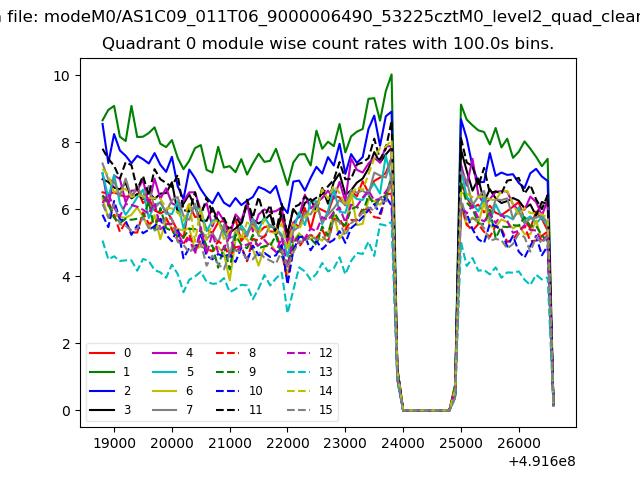 |
 |
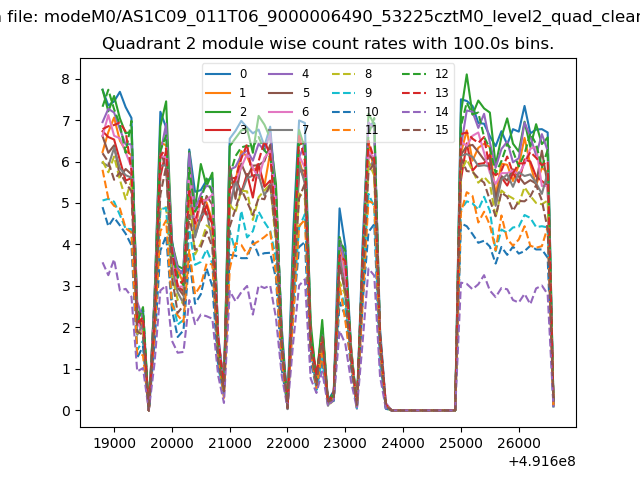
| Module-wise count rates for Quadrant B Data is divided into 100 sec bins |
 |
 |
| Module-wise count rates for Quadrant C Data is divided into 100 sec bins |
 |
 |
| Module-wise count rates for Quadrant D Data is divided into 100 sec bins |
 |
 |
| Parameter | Plot |
|---|---|
| CZT HV Monitor | 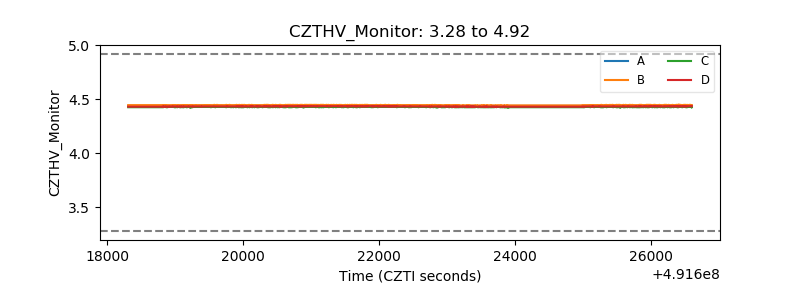 |
| D_VDD | 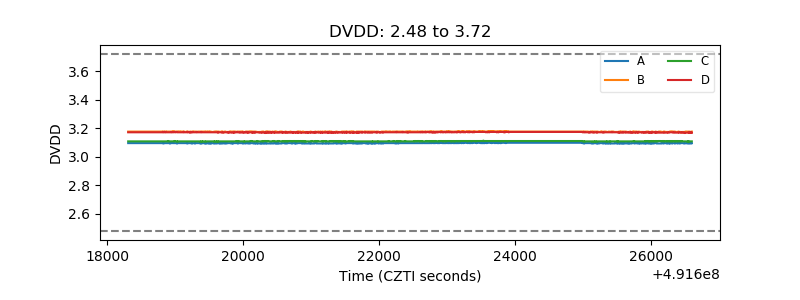 |
| Temperature 1 | 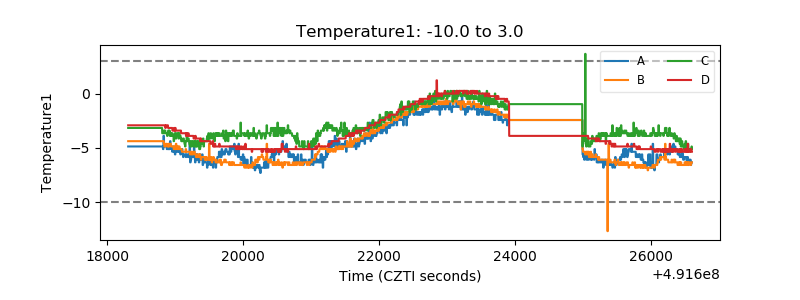 |
| Veto HV Monitor | 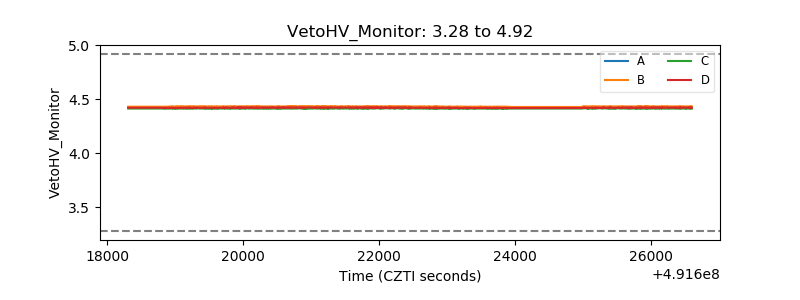 |
| Veto LLD | 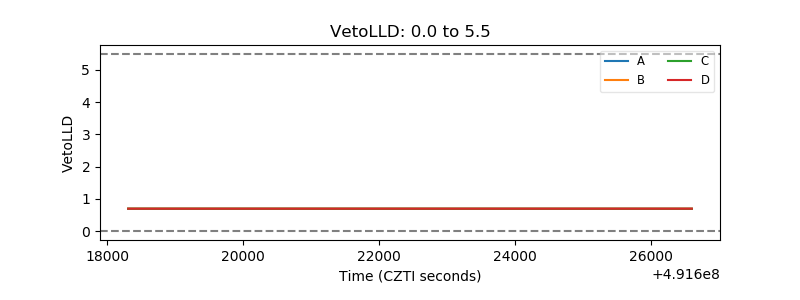 |
| Alpha Counter | 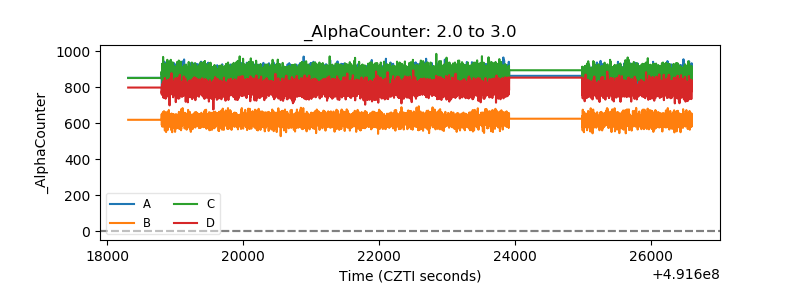 |
| _CPM_Rate | 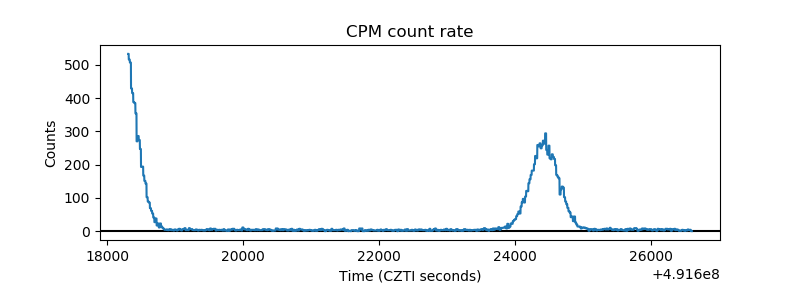 |
| CZT Counter | 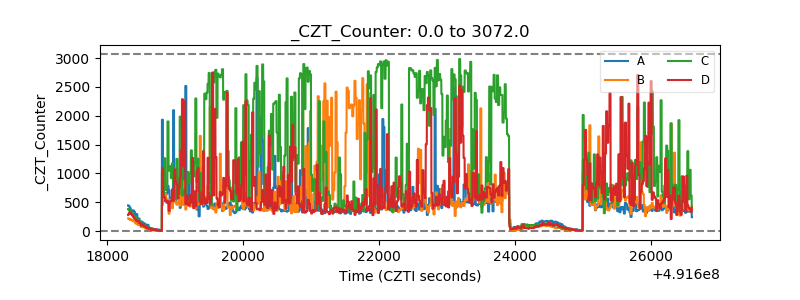 |
| +2.5 Volts monitor |  |
| +5 Volts monitor |  |
| _ROLL_ROT | 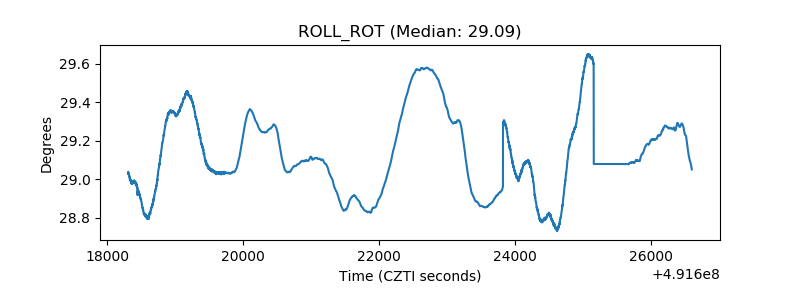 |
| _Roll_DEC | 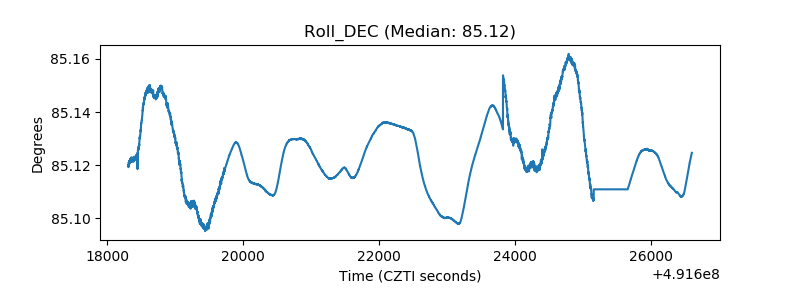 |
| _Roll_RA | 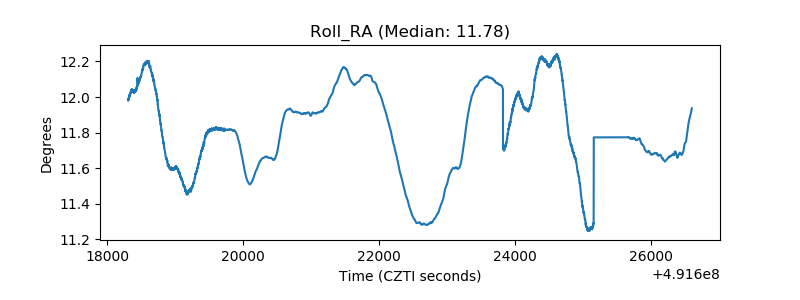 |
| Veto Counter | 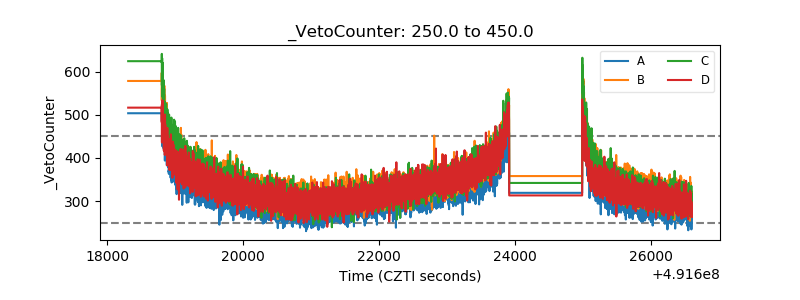 |