| Param | Original file | Final file |
|---|---|---|
| Filename | modeM0/AS1C09_011T06_9000006490_53226cztM0_level2.fits | modeM0/AS1C09_011T06_9000006490_53226cztM0_level2_quad_clean.evt |
| Size (bytes) | 531,253,440 | 89,640,000 |
| Size | 506.6 MB | 85.5 MB |
| Events in quadrant A | 3,287,509 | 606,064 |
| Events in quadrant B | 3,779,578 | 629,426 |
| Events in quadrant C | 7,236,863 | 494,455 |
| Events in quadrant D | 4,859,046 | 532,609 |
| Mode M9 | |||
|---|---|---|---|
| Quadrant | BADHDUFLAG | Total packets | Discarded packets |
| A | 0 | 7 | 0 |
| B | 0 | 7 | 0 |
| C | 0 | 7 | 0 |
| D | 0 | 7 | 0 |
| Mode SS | |||
|---|---|---|---|
| Quadrant | BADHDUFLAG | Total packets | Discarded packets |
| A | 0 | 132 | 0 |
| B | 0 | 132 | 0 |
| C | 0 | 132 | 0 |
| D | 0 | 132 | 0 |
| Mode M0 | |||
|---|---|---|---|
| Quadrant | BADHDUFLAG | Total packets | Discarded packets |
| A | 0 | 14858 | 1 |
| B | 0 | 16020 | 1 |
| C | 0 | 26082 | 1 |
| D | 0 | 19146 | 1 |
| Quadrant | Total seconds | Saturated seconds | Saturation percentage |
|---|---|---|---|
| A | 6471 | 71 | 1.097203% |
| B | 6472 | 278 | 4.295426% |
| C | 6472 | 1109 | 17.135352% |
| D | 6472 | 346 | 5.346106% |
Noise dominated data is calculated using 1-second bins in cleaned event files. If a bin has >2000 counts, and if more than 50% of those come from <1% of pixels, then it is considered to be noise-dominated and hence unusable.
| Quadrant | # 1 sec bins | Bins with >0 counts | Bins with >2000 counts | High rate bins dominated by noise | Noise dominated (total time) | Noise dominated (detector-on time) | Marked lightcurve |
|---|---|---|---|---|---|---|---|
| A | 7191 | 6472 | 25 | 25 | 0.35% | 0.39% | 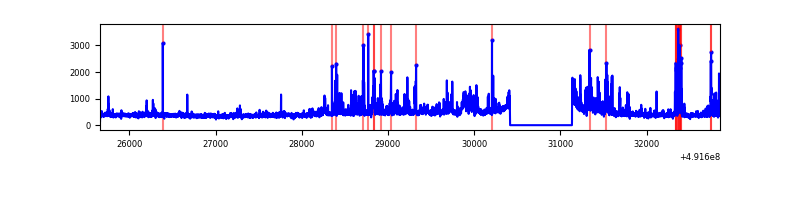 |
| B | 7192 | 6473 | 163 | 163 | 2.27% | 2.52% | 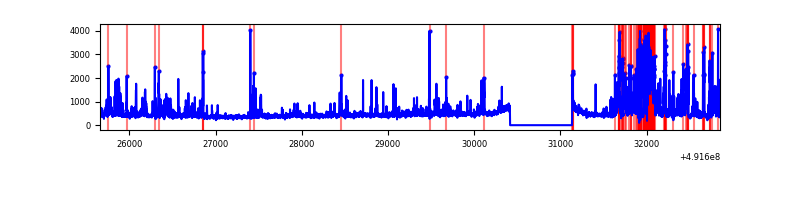 |
| C | 7192 | 6473 | 949 | 949 | 13.20% | 14.66% | 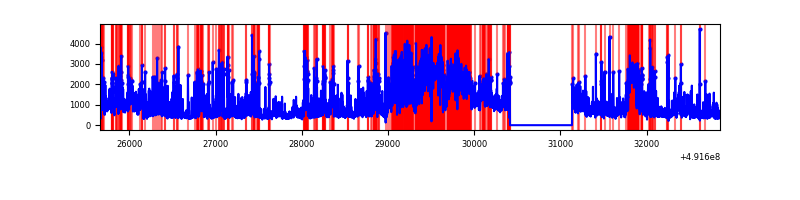 |
| D | 7192 | 6473 | 299 | 299 | 4.16% | 4.62% | 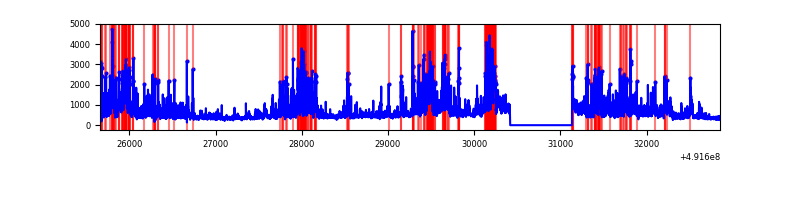 |
Top three noisy pixels from each quadrant. If the there are fewer than three noisy pixels in the level2.evt file, extra rows are filled as -1
| Pixel properties | Quadrant properties | ||||||
|---|---|---|---|---|---|---|---|
| Quadrant | DetID | PixID | Counts | Sigma | Mean | Median | Sigma |
| A | 3 | 62 | 187732 | 1150.17 | 654 | 637 | 162.7 |
| A | 3 | 27 | 98272 | 600.21 | 654 | 637 | 162.7 |
| A | 12 | 80 | 87337 | 532.99 | 654 | 637 | 162.7 |
| B | 2 | 249 | 878899 | 6407.71 | 643 | 624 | 137.1 |
| B | 4 | 81 | 128666 | 934.17 | 643 | 624 | 137.1 |
| B | 8 | 128 | 54737 | 394.8 | 643 | 624 | 137.1 |
| C | 15 | 224 | 1460104 | 9023.17 | 585 | 579 | 161.8 |
| C | 15 | 165 | 1387342 | 8573.34 | 585 | 579 | 161.8 |
| C | 7 | 80 | 742258 | 4585.26 | 585 | 579 | 161.8 |
| D | 6 | 239 | 557596 | 3187.68 | 617 | 592 | 174.7 |
| D | 11 | 176 | 450628 | 2575.51 | 617 | 592 | 174.7 |
| D | 15 | 125 | 404496 | 2311.5 | 617 | 592 | 174.7 |
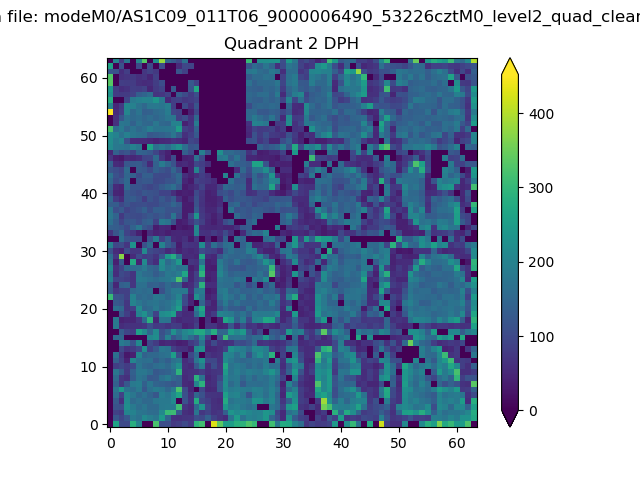
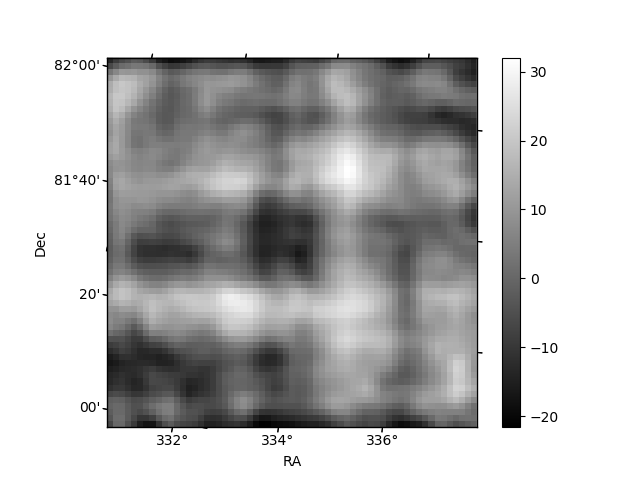
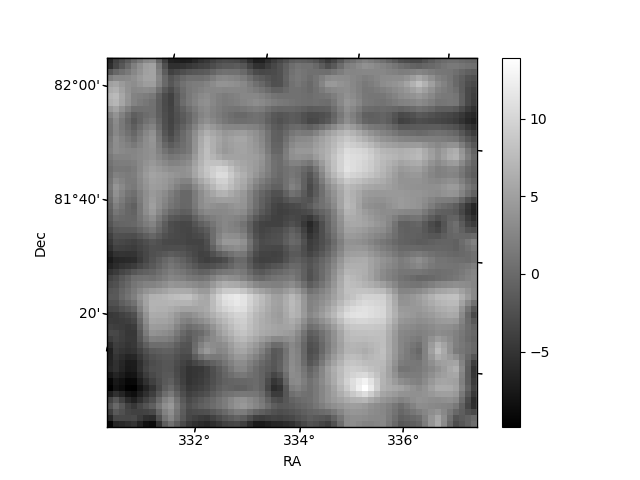
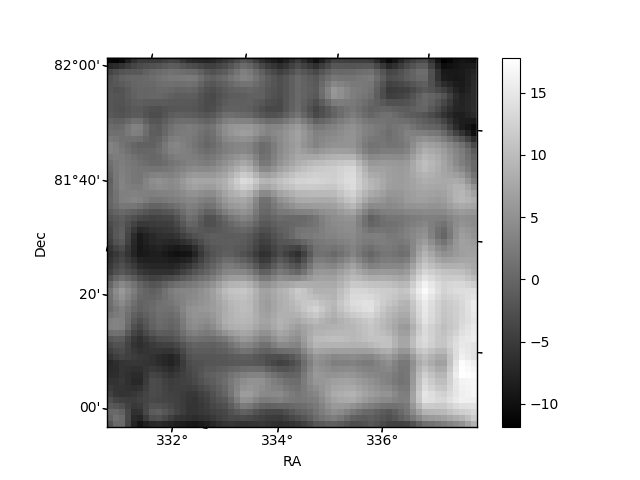
Histogram calculated using DETX and DETY for each event in the final _common_clean file
| Quadrant A | 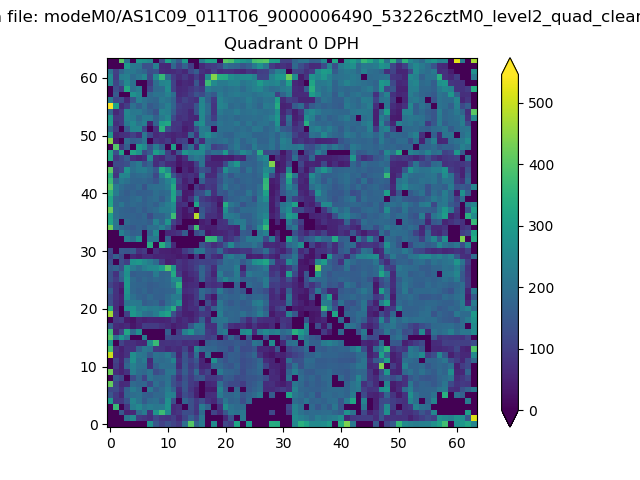 |
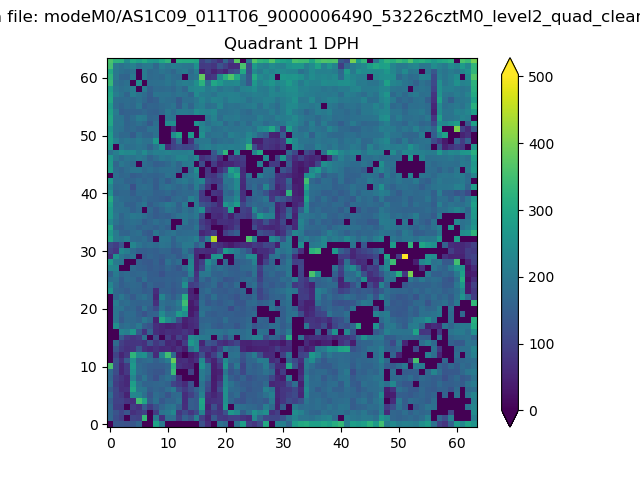 |
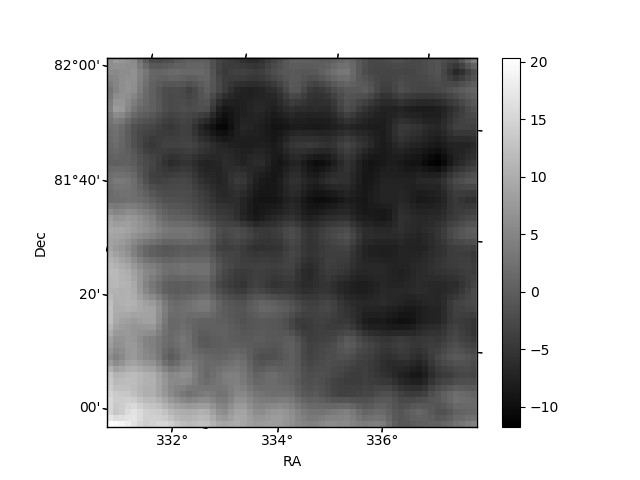
Quadrant B |
|---|---|---|---|
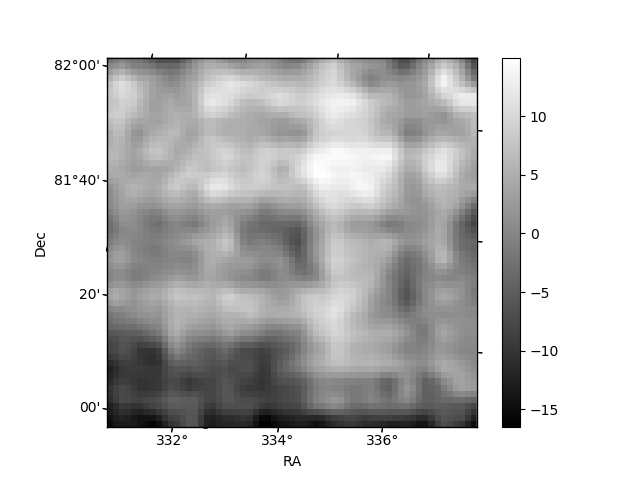
| Quadrant D | 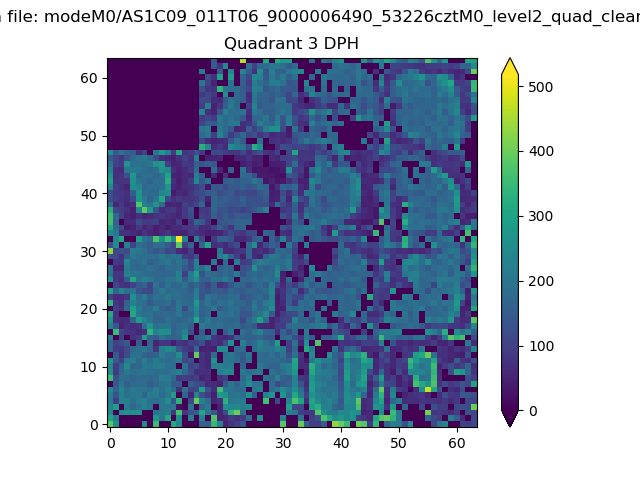 |
 |
Quadrant C |
| Plot type | Count rate plots | Images |
|---|---|---|
| Comparison with Poisson distribution Blue bars denote a histogram of data divided into 1 sec bins. Red curve is a Poisson curve with rate = median count rate of data. |
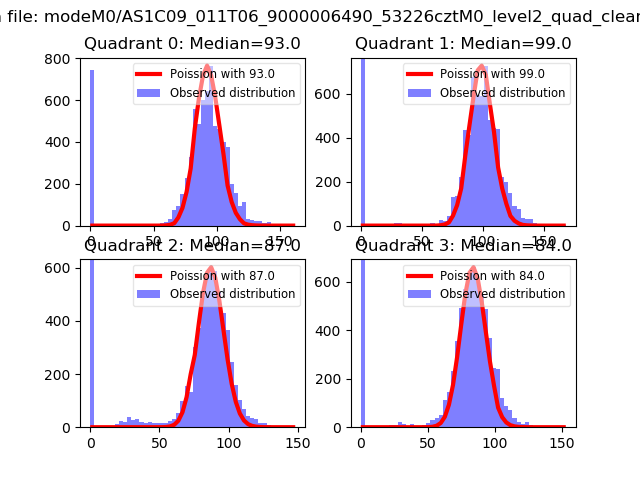 |
 |
| Quadrant-wise count rates Data is divided into 100 sec bins |
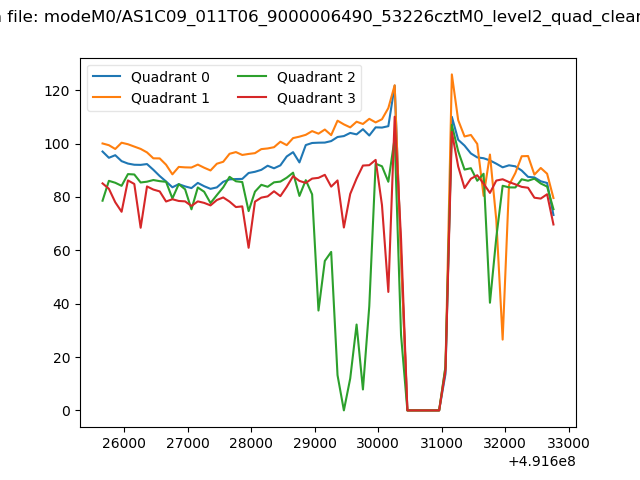 |
|
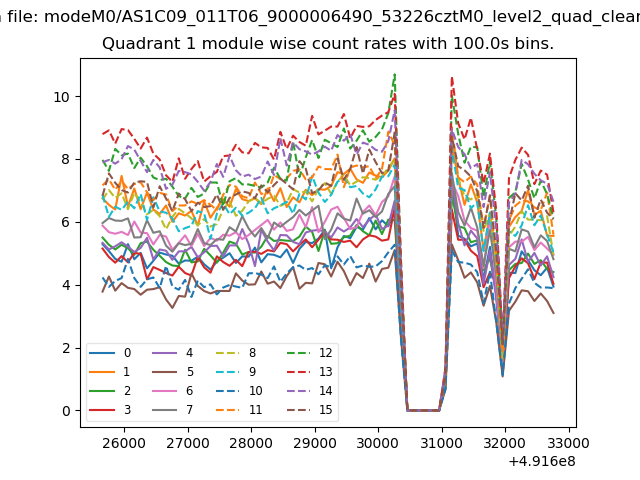
| Module-wise count rates for Quadrant A Data is divided into 100 sec bins |
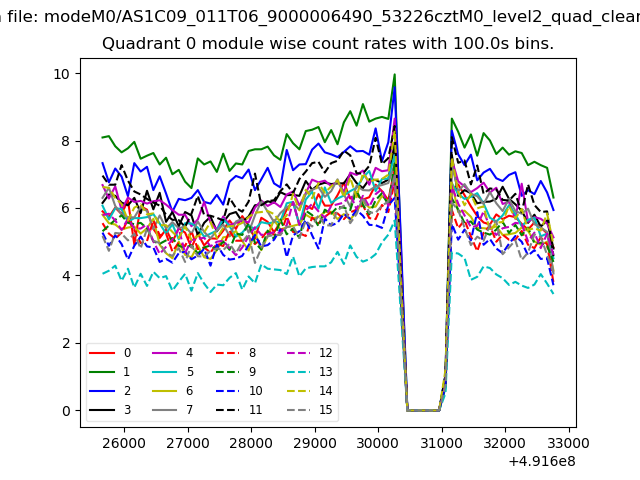 |
 |
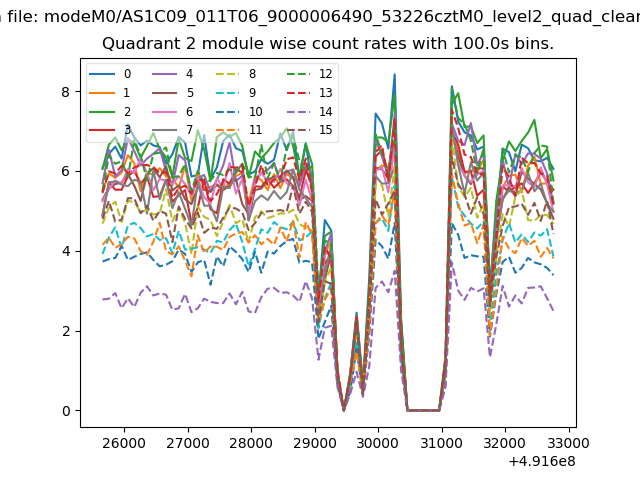
| Module-wise count rates for Quadrant B Data is divided into 100 sec bins |
 |
 |
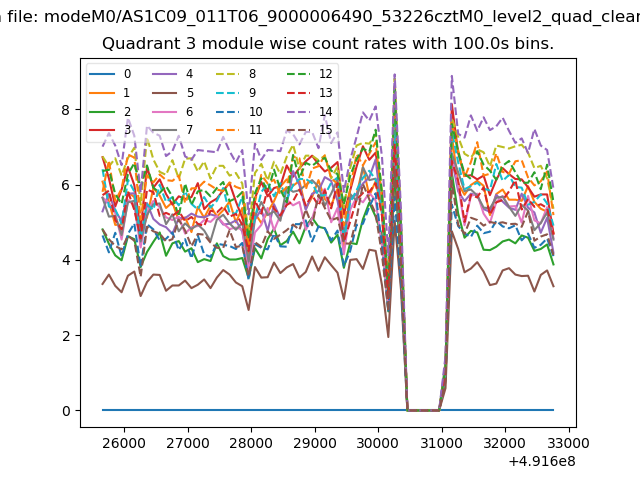
| Module-wise count rates for Quadrant C Data is divided into 100 sec bins |
 |
 |
| Module-wise count rates for Quadrant D Data is divided into 100 sec bins |
 |
 |
| Parameter | Plot |
|---|---|
| CZT HV Monitor |  |
| D_VDD | 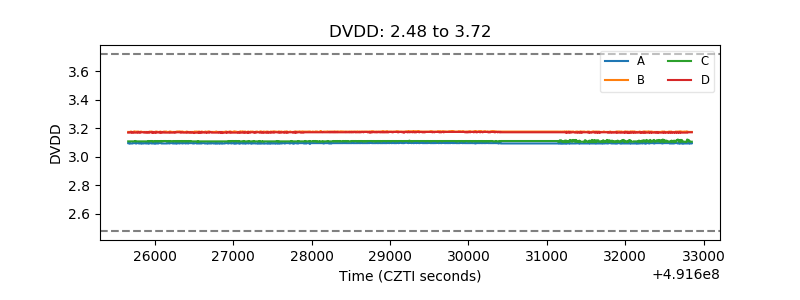 |
| Temperature 1 | 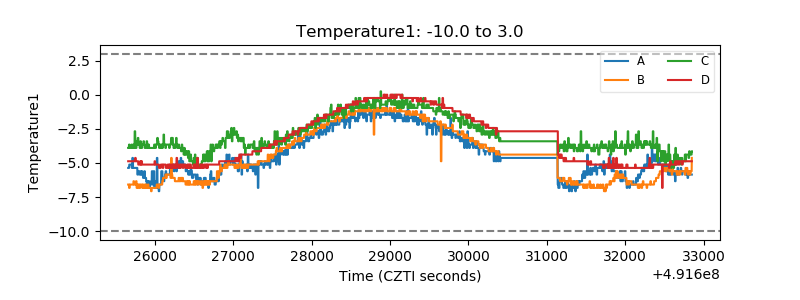 |
| Veto HV Monitor | 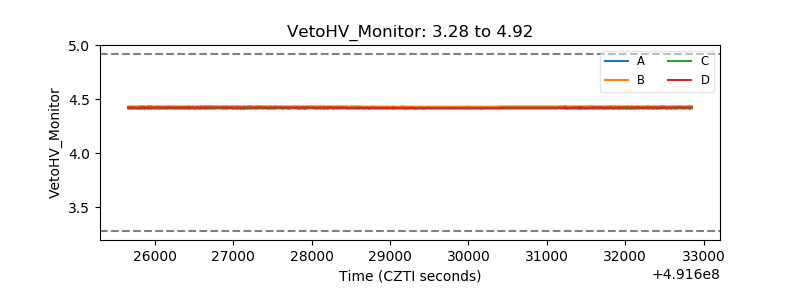 |
| Veto LLD | 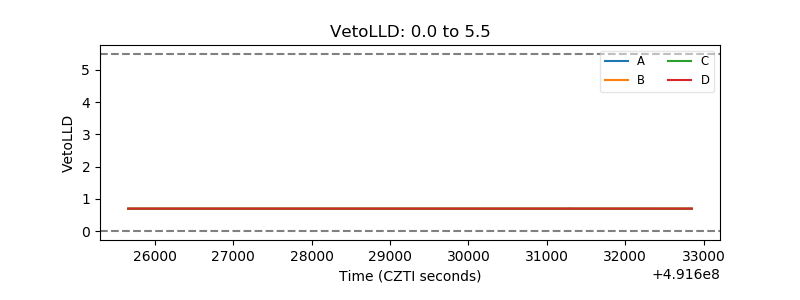 |
| Alpha Counter |  |
| _CPM_Rate | 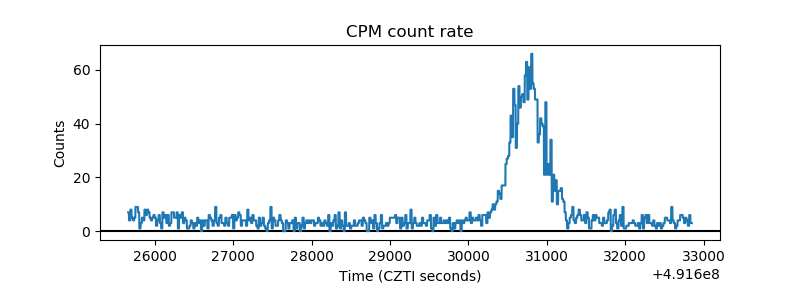 |
| CZT Counter | 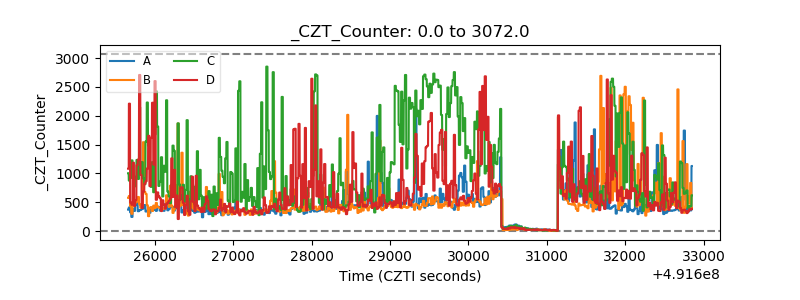 |
| +2.5 Volts monitor |  |
| +5 Volts monitor |  |
| _ROLL_ROT | 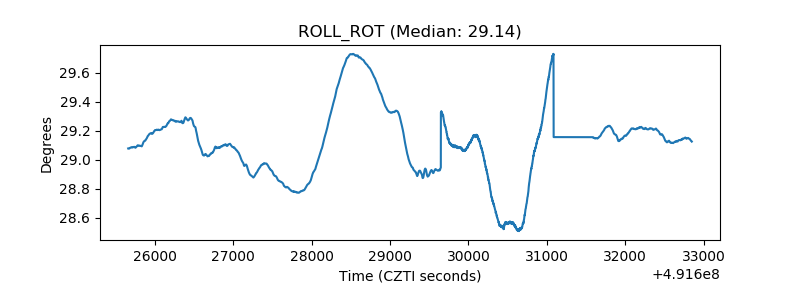 |
| _Roll_DEC | 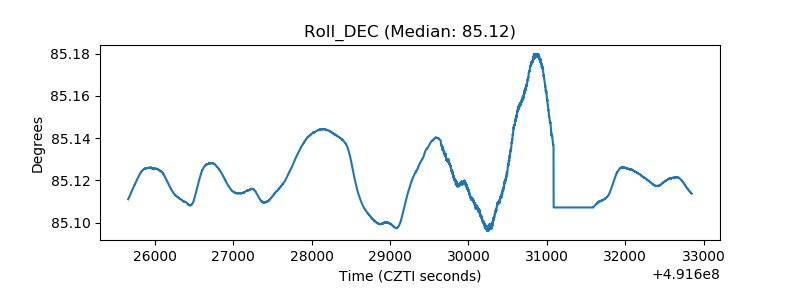 |
| _Roll_RA | 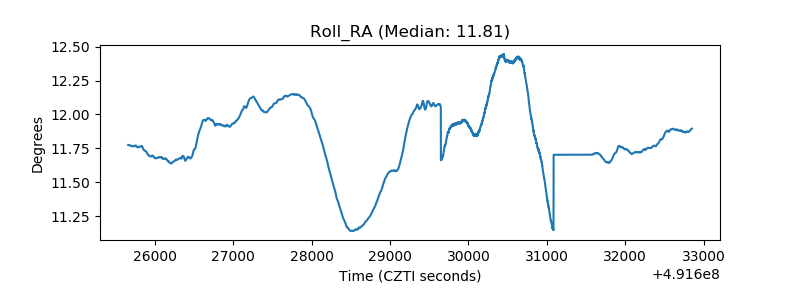 |
| Veto Counter | 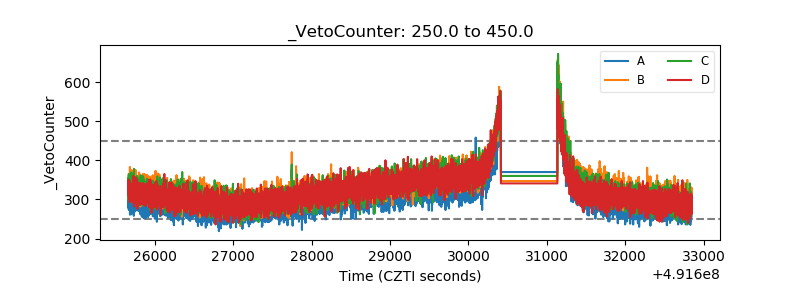 |