| Param | Original file | Final file |
|---|---|---|
| Filename | modeM0/AS1C09_011T06_9000006490_53227cztM0_level2.fits | modeM0/AS1C09_011T06_9000006490_53227cztM0_level2_quad_clean.evt |
| Size (bytes) | 766,203,840 | 92,537,280 |
| Size | 730.7 MB | 88.3 MB |
| Events in quadrant A | 7,102,871 | 574,257 |
| Events in quadrant B | 6,220,313 | 628,942 |
| Events in quadrant C | 9,593,623 | 480,930 |
| Events in quadrant D | 4,879,126 | 608,132 |
| Mode SS | |||
|---|---|---|---|
| Quadrant | BADHDUFLAG | Total packets | Discarded packets |
| A | 0 | 148 | 0 |
| B | 0 | 148 | 0 |
| C | 0 | 148 | 0 |
| D | 0 | 148 | 0 |
| Mode M0 | |||
|---|---|---|---|
| Quadrant | BADHDUFLAG | Total packets | Discarded packets |
| A | 0 | 26521 | 2 |
| B | 0 | 23857 | 2 |
| C | 0 | 33672 | 2 |
| D | 0 | 19903 | 2 |
| Quadrant | Total seconds | Saturated seconds | Saturation percentage |
|---|---|---|---|
| A | 7310 | 1250 | 17.099863% |
| B | 7310 | 1188 | 16.251710% |
| C | 7310 | 2121 | 29.015048% |
| D | 7309 | 256 | 3.502531% |
Noise dominated data is calculated using 1-second bins in cleaned event files. If a bin has >2000 counts, and if more than 50% of those come from <1% of pixels, then it is considered to be noise-dominated and hence unusable.
| Quadrant | # 1 sec bins | Bins with >0 counts | Bins with >2000 counts | High rate bins dominated by noise | Noise dominated (total time) | Noise dominated (detector-on time) | Marked lightcurve |
|---|---|---|---|---|---|---|---|
| A | 7380 | 7312 | 1046 | 1046 | 14.17% | 14.31% | 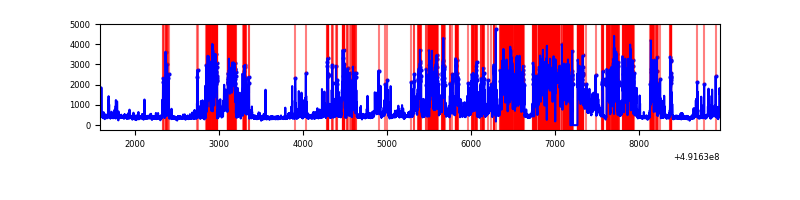 |
| B | 7380 | 7312 | 902 | 902 | 12.22% | 12.34% | 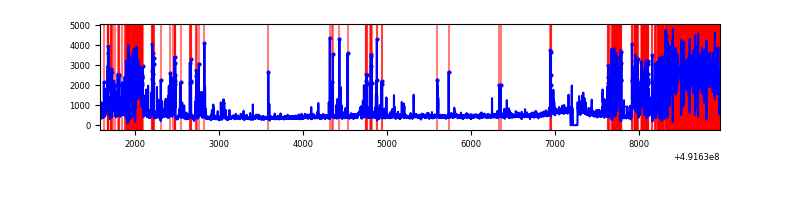 |
| C | 7380 | 7312 | 1923 | 1923 | 26.06% | 26.30% | 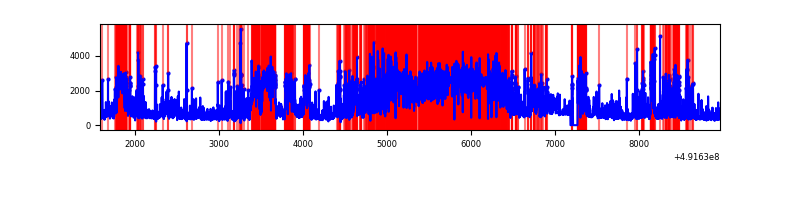 |
| D | 7379 | 7311 | 203 | 203 | 2.75% | 2.78% | 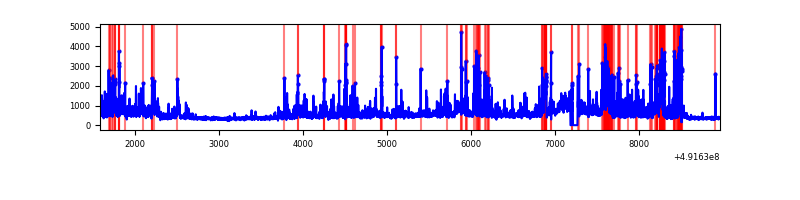 |
Top three noisy pixels from each quadrant. If the there are fewer than three noisy pixels in the level2.evt file, extra rows are filled as -1
| Pixel properties | Quadrant properties | ||||||
|---|---|---|---|---|---|---|---|
| Quadrant | DetID | PixID | Counts | Sigma | Mean | Median | Sigma |
| A | 3 | 62 | 3932900 | 23007.91 | 687 | 671 | 170.9 |
| A | 12 | 115 | 171852 | 1001.6 | 687 | 671 | 170.9 |
| A | 0 | 8 | 83115 | 482.39 | 687 | 671 | 170.9 |
| B | 2 | 249 | 3045648 | 20602.39 | 690 | 665 | 147.8 |
| B | 4 | 81 | 118157 | 794.95 | 690 | 665 | 147.8 |
| B | 5 | 185 | 57334 | 383.42 | 690 | 665 | 147.8 |
| C | 15 | 165 | 2686195 | 15506.75 | 629 | 624 | 173.2 |
| C | 0 | 240 | 1689792 | 9753.42 | 629 | 624 | 173.2 |
| C | 15 | 224 | 1214646 | 7009.88 | 629 | 624 | 173.2 |
| D | 3 | 12 | 547884 | 2708.47 | 722 | 690 | 202.0 |
| D | 15 | 125 | 373669 | 1846.15 | 722 | 690 | 202.0 |
| D | 12 | 3 | 237145 | 1170.39 | 722 | 690 | 202.0 |
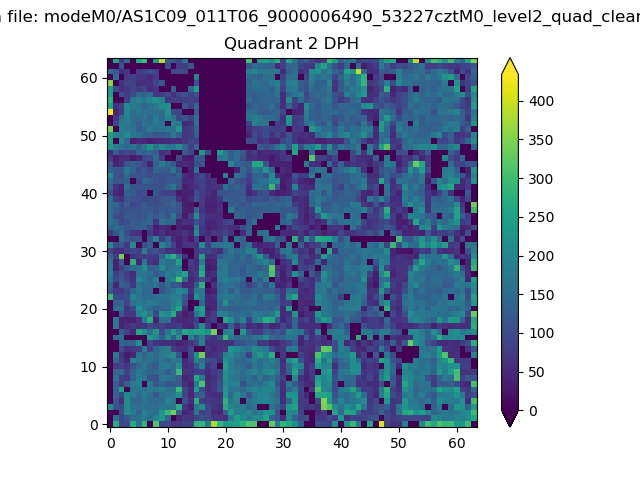
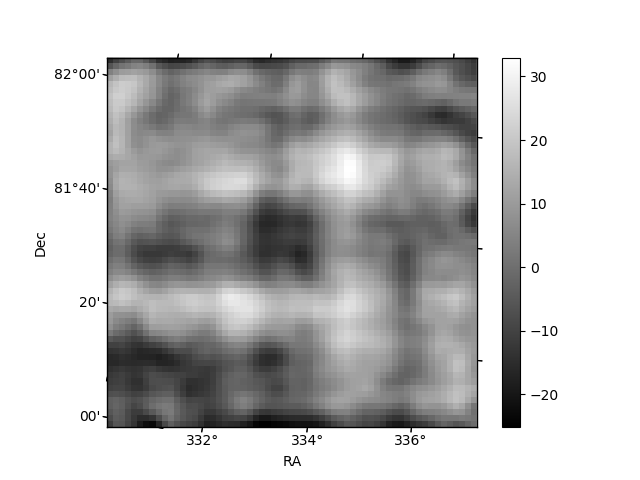
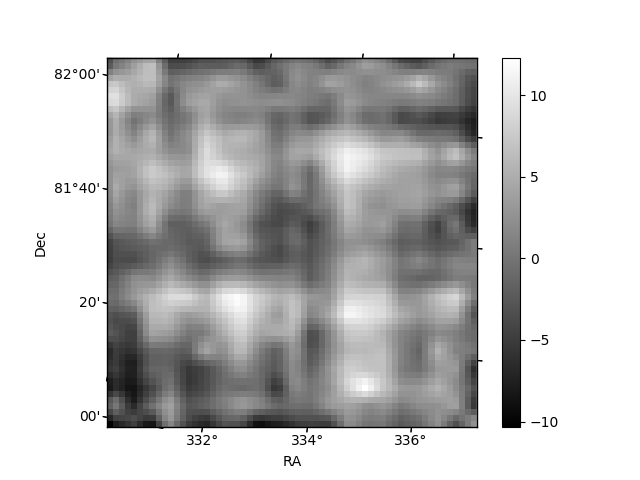
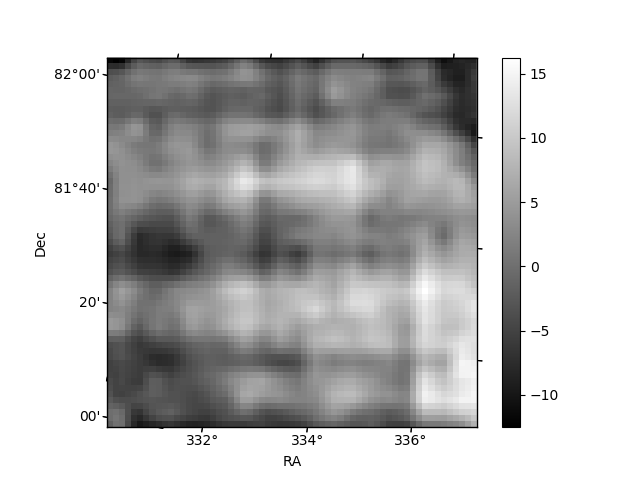
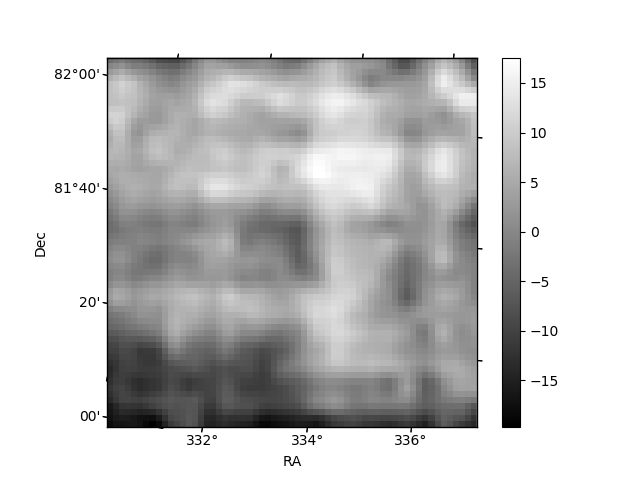
Histogram calculated using DETX and DETY for each event in the final _common_clean file
| Quadrant A | 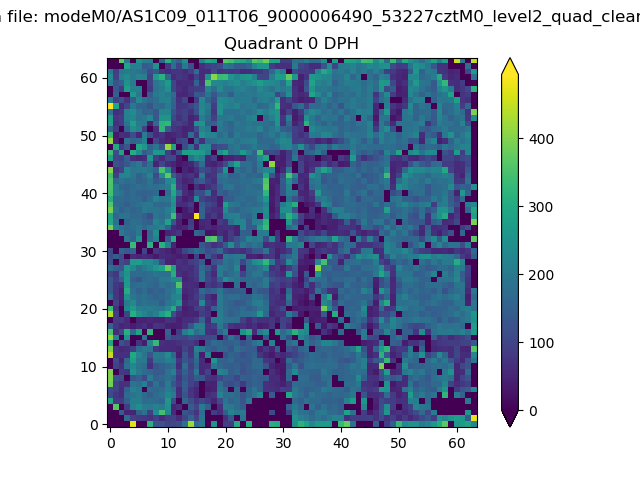 |
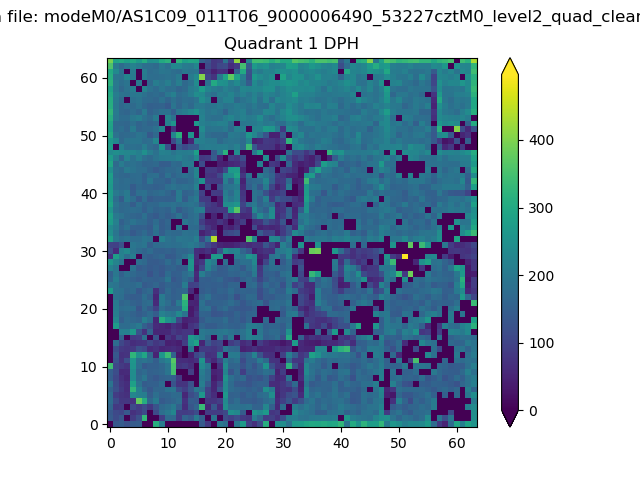 |
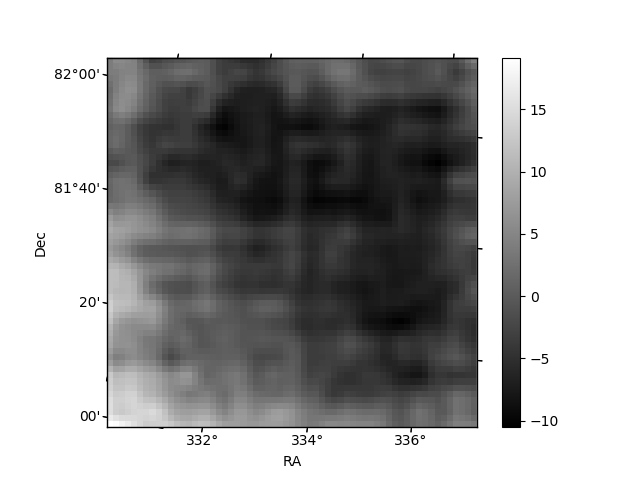
Quadrant B |
|---|---|---|---|
| Quadrant D | 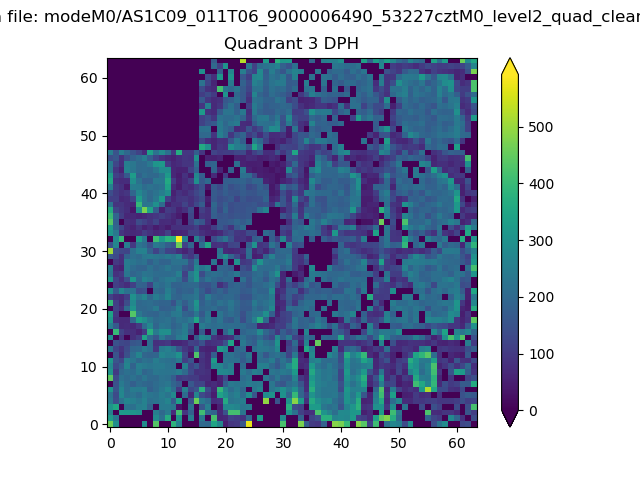 |
 |
Quadrant C |
| Plot type | Count rate plots | Images |
|---|---|---|
| Comparison with Poisson distribution Blue bars denote a histogram of data divided into 1 sec bins. Red curve is a Poisson curve with rate = median count rate of data. |
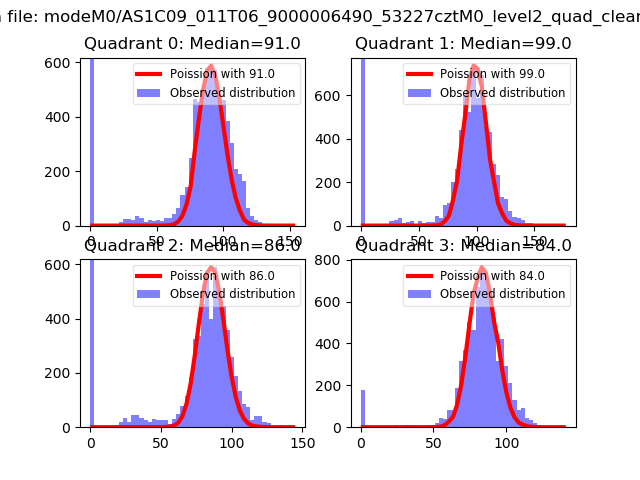 |
 |
| Quadrant-wise count rates Data is divided into 100 sec bins |
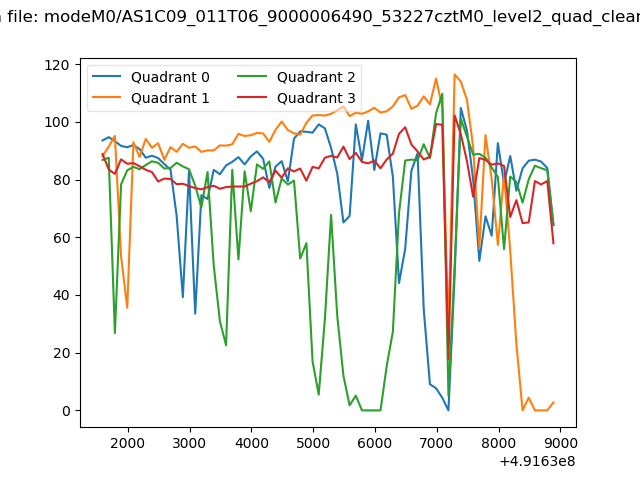 |
|
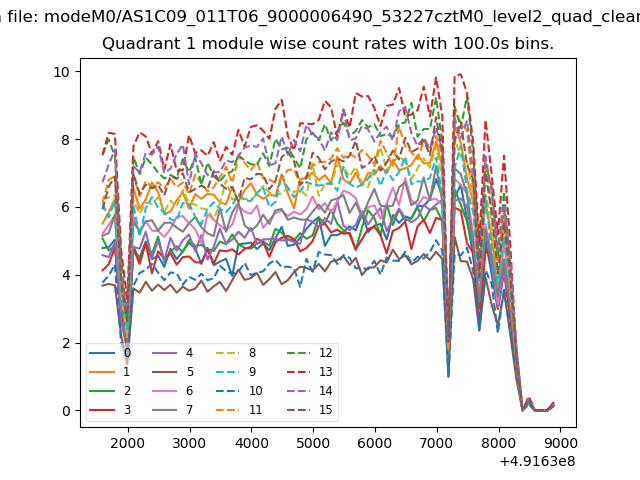
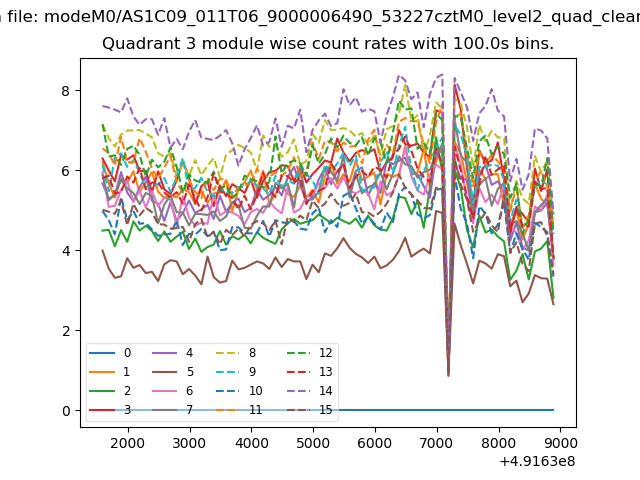
| Module-wise count rates for Quadrant A Data is divided into 100 sec bins |
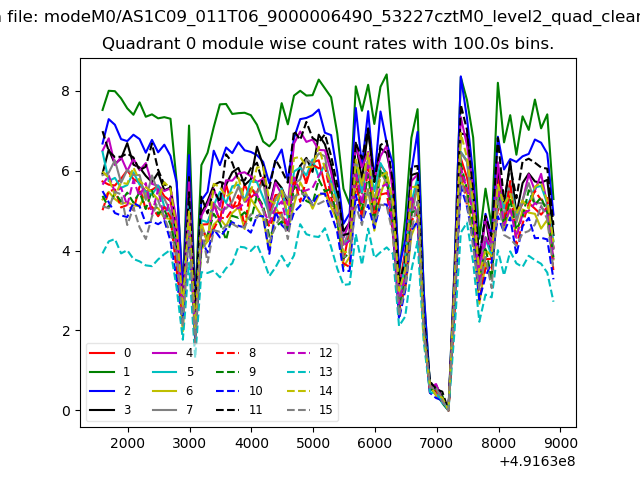 |
 |
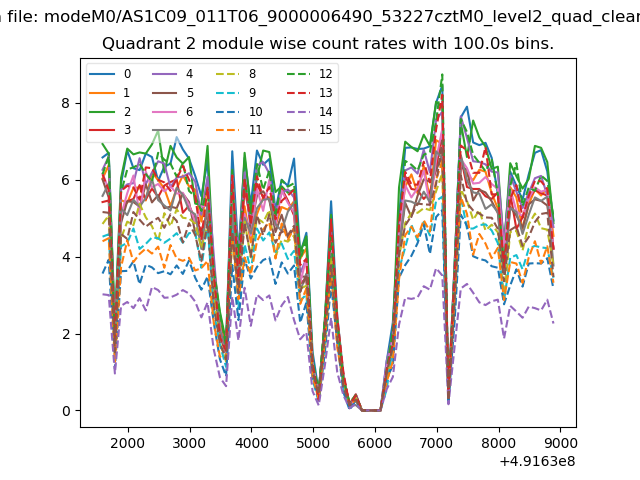
| Module-wise count rates for Quadrant B Data is divided into 100 sec bins |
 |
 |
| Module-wise count rates for Quadrant C Data is divided into 100 sec bins |
 |
 |
| Module-wise count rates for Quadrant D Data is divided into 100 sec bins |
 |
 |
| Parameter | Plot |
|---|---|
| CZT HV Monitor | 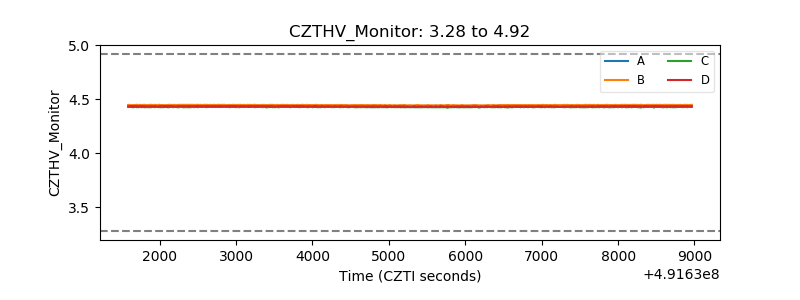 |
| D_VDD | 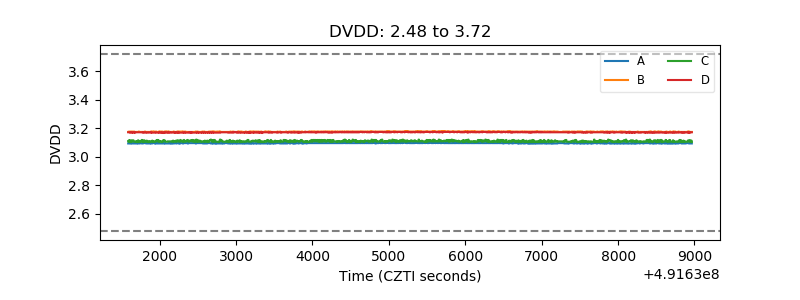 |
| Temperature 1 | 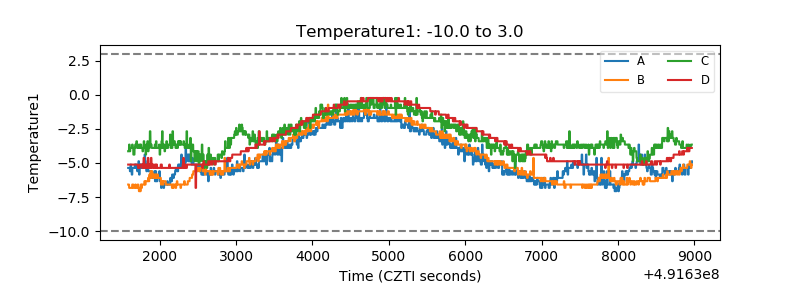 |
| Veto HV Monitor | 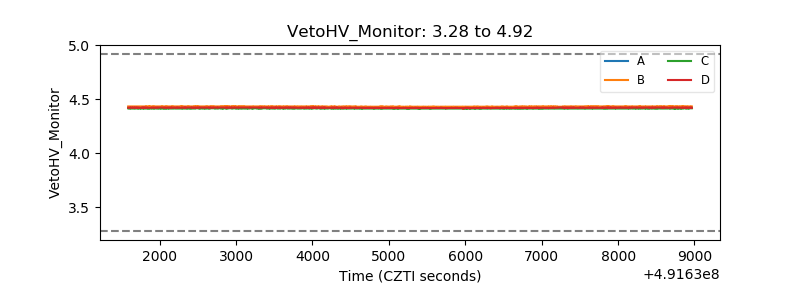 |
| Veto LLD | 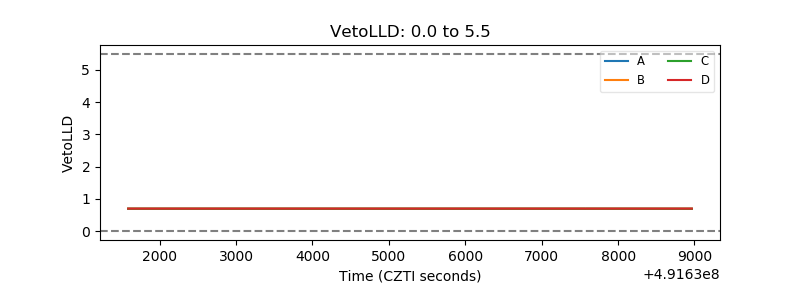 |
| Alpha Counter | 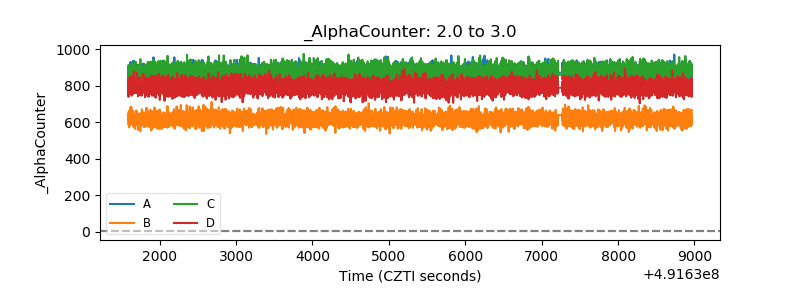 |
| _CPM_Rate | 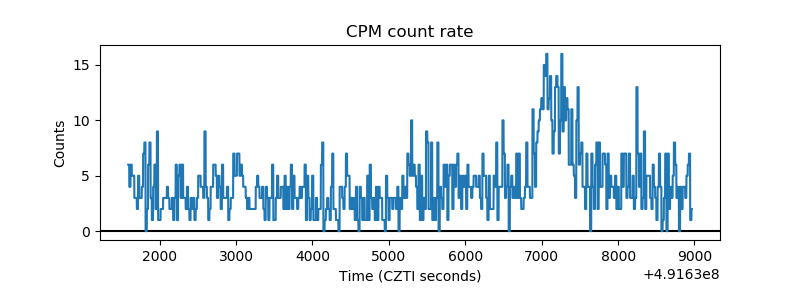 |
| CZT Counter | 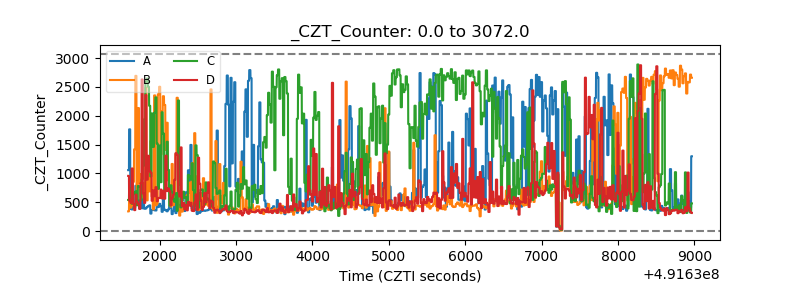 |
| +2.5 Volts monitor | 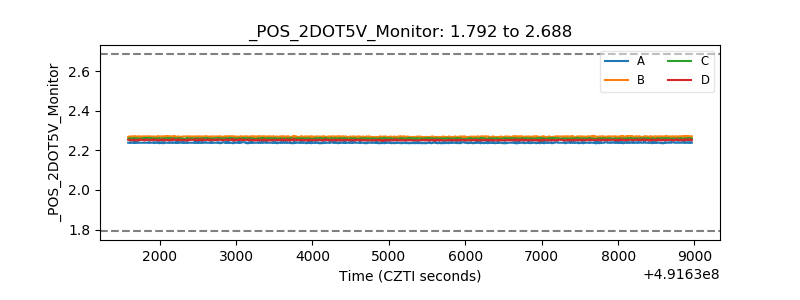 |
| +5 Volts monitor | 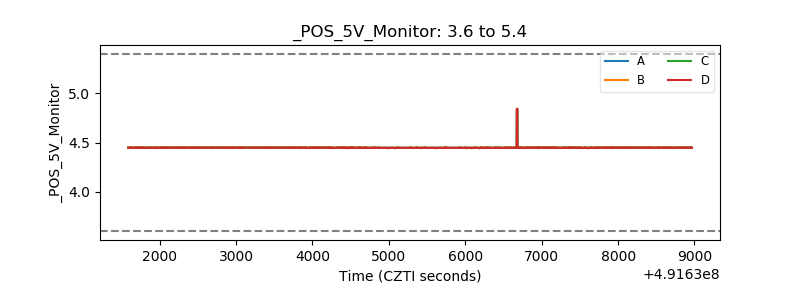 |
| _ROLL_ROT | 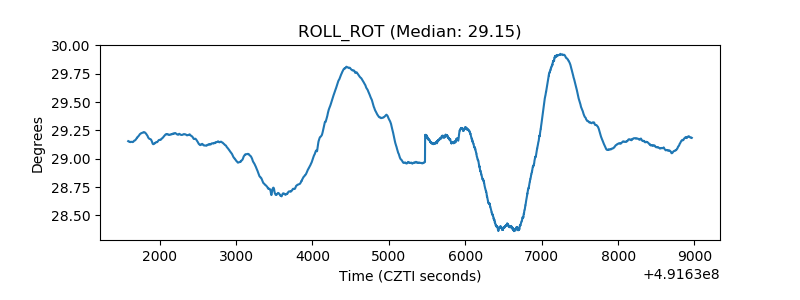 |
| _Roll_DEC | 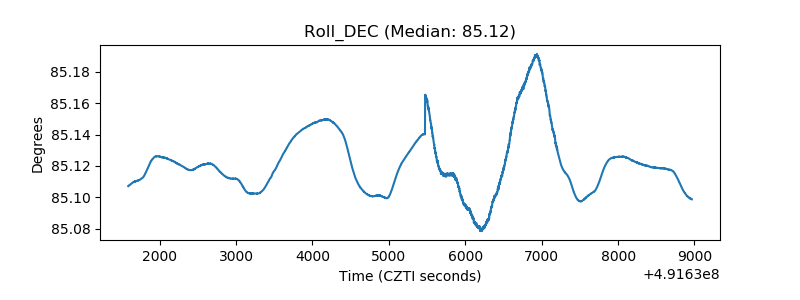 |
| _Roll_RA | 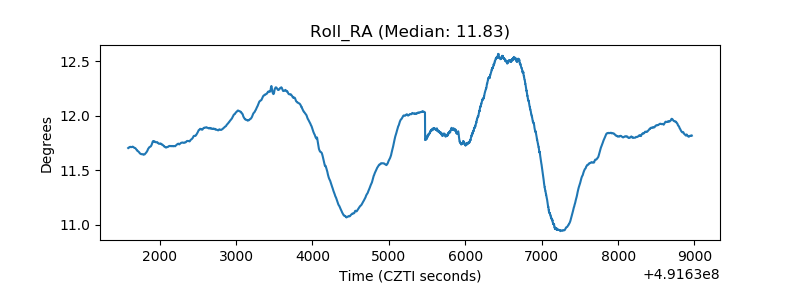 |
| Veto Counter | 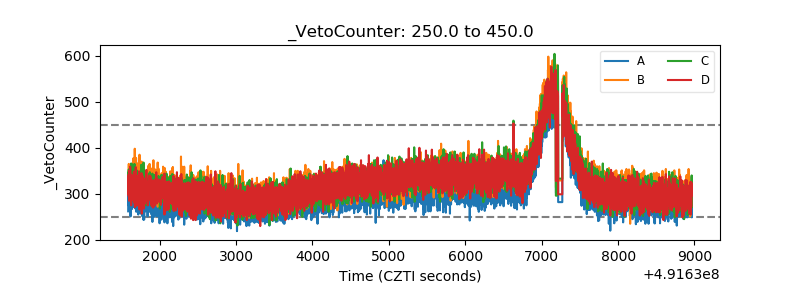 |