| Param | Original file | Final file |
|---|---|---|
| Filename | modeM0/AS1C09_011T06_9000006490_53228cztM0_level2.fits | modeM0/AS1C09_011T06_9000006490_53228cztM0_level2_quad_clean.evt |
| Size (bytes) | 790,191,360 | 95,990,400 |
| Size | 753.6 MB | 91.5 MB |
| Events in quadrant A | 7,690,894 | 565,727 |
| Events in quadrant B | 5,790,267 | 662,272 |
| Events in quadrant C | 8,767,110 | 553,329 |
| Events in quadrant D | 6,422,188 | 603,341 |
| Mode SS | |||
|---|---|---|---|
| Quadrant | BADHDUFLAG | Total packets | Discarded packets |
| A | 0 | 150 | 0 |
| B | 0 | 150 | 0 |
| C | 0 | 150 | 0 |
| D | 0 | 150 | 0 |
| Mode M0 | |||
|---|---|---|---|
| Quadrant | BADHDUFLAG | Total packets | Discarded packets |
| A | 0 | 28249 | 4 |
| B | 0 | 22596 | 0 |
| C | 0 | 31317 | 0 |
| D | 0 | 24524 | 0 |
| Quadrant | Total seconds | Saturated seconds | Saturation percentage |
|---|---|---|---|
| A | 7493 | 1493 | 19.925264% |
| B | 7493 | 926 | 12.358201% |
| C | 7494 | 1455 | 19.415532% |
| D | 7494 | 462 | 6.164932% |
Noise dominated data is calculated using 1-second bins in cleaned event files. If a bin has >2000 counts, and if more than 50% of those come from <1% of pixels, then it is considered to be noise-dominated and hence unusable.
| Quadrant | # 1 sec bins | Bins with >0 counts | Bins with >2000 counts | High rate bins dominated by noise | Noise dominated (total time) | Noise dominated (detector-on time) | Marked lightcurve |
|---|---|---|---|---|---|---|---|
| A | 7493 | 7493 | 1273 | 1273 | 16.99% | 16.99% | 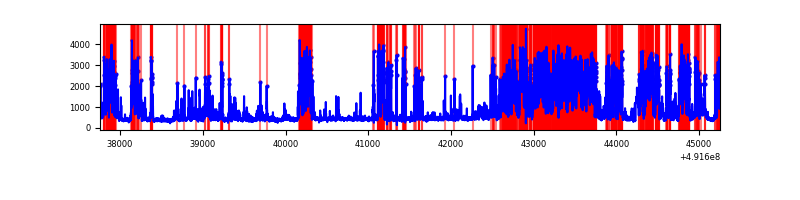 |
| B | 7493 | 7493 | 765 | 765 | 10.21% | 10.21% | 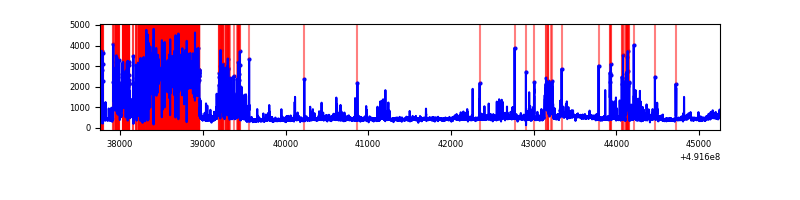 |
| C | 7494 | 7494 | 1401 | 1401 | 18.69% | 18.69% | 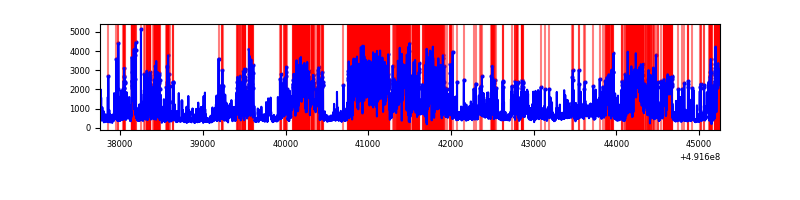 |
| D | 7494 | 7494 | 439 | 439 | 5.86% | 5.86% | 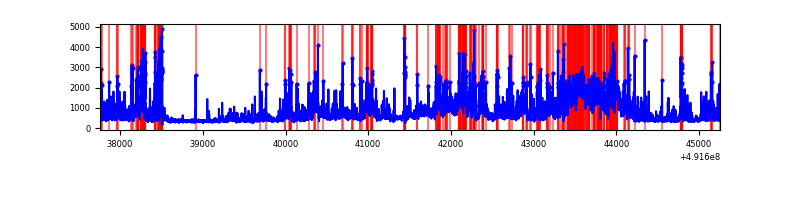 |
Top three noisy pixels from each quadrant. If the there are fewer than three noisy pixels in the level2.evt file, extra rows are filled as -1
| Pixel properties | Quadrant properties | ||||||
|---|---|---|---|---|---|---|---|
| Quadrant | DetID | PixID | Counts | Sigma | Mean | Median | Sigma |
| A | 3 | 62 | 4337023 | 25419.6 | 685 | 670 | 170.6 |
| A | 0 | 8 | 370150 | 2165.88 | 685 | 670 | 170.6 |
| A | 12 | 80 | 123880 | 722.25 | 685 | 670 | 170.6 |
| B | 2 | 249 | 2630086 | 17451.34 | 701 | 677 | 150.7 |
| B | 4 | 81 | 137085 | 905.34 | 701 | 677 | 150.7 |
| B | 7 | 0 | 58244 | 382.07 | 701 | 677 | 150.7 |
| C | 15 | 224 | 1767249 | 9550.3 | 676 | 671 | 185.0 |
| C | 0 | 240 | 1628706 | 8801.32 | 676 | 671 | 185.0 |
| C | 15 | 165 | 1383080 | 7473.44 | 676 | 671 | 185.0 |
| D | 0 | 18 | 700335 | 3480.18 | 716 | 684 | 201.0 |
| D | 3 | 12 | 614917 | 3055.3 | 716 | 684 | 201.0 |
| D | 6 | 239 | 582491 | 2894.01 | 716 | 684 | 201.0 |
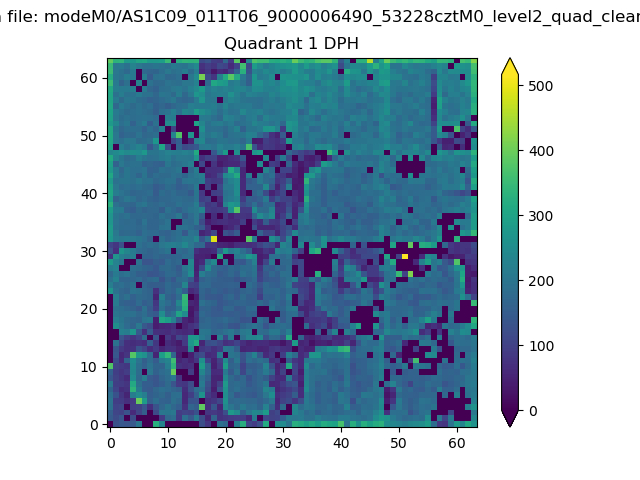
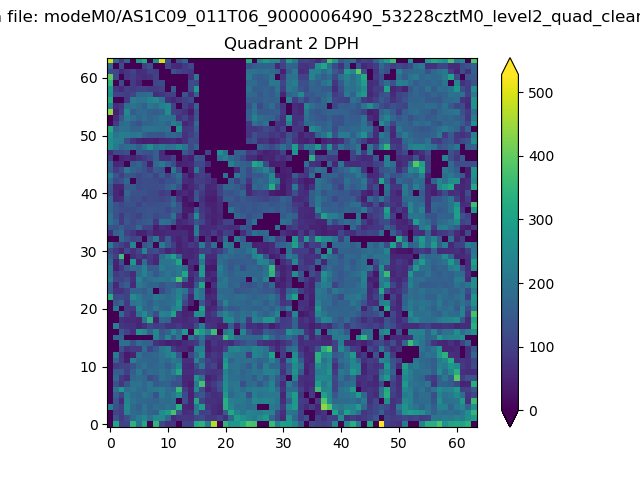
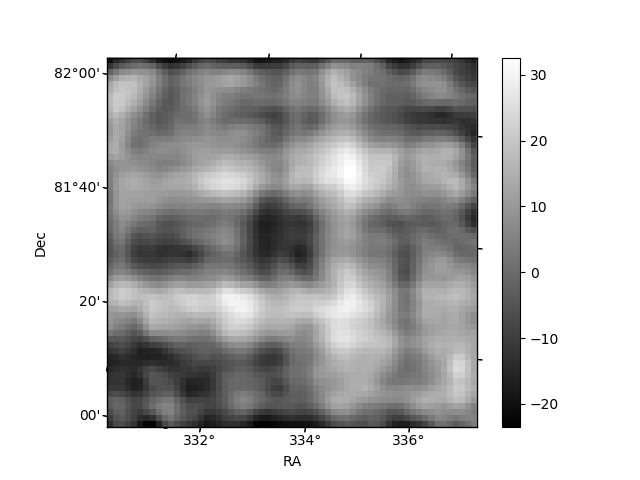
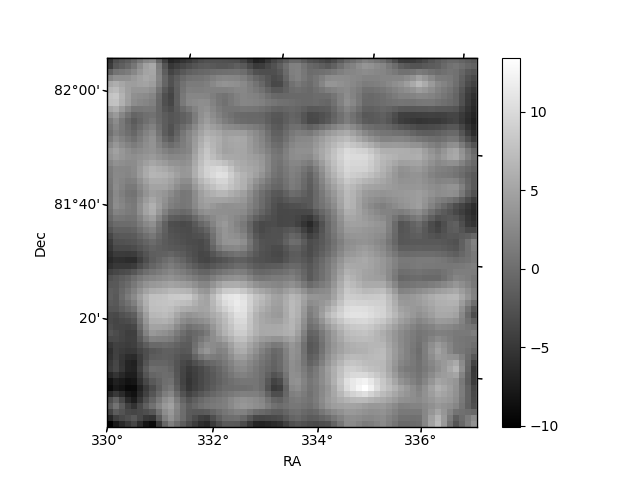
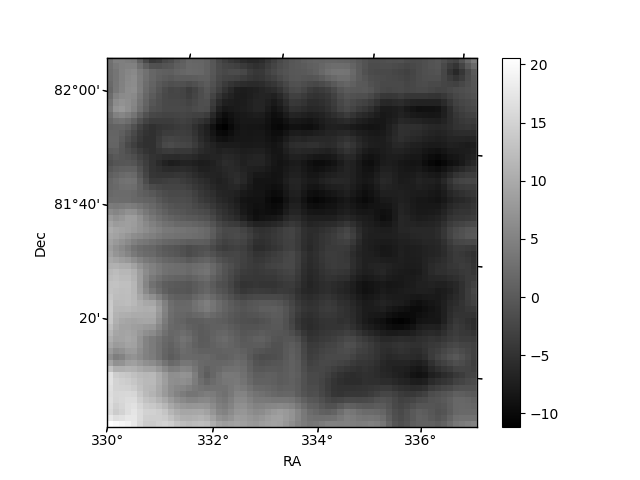
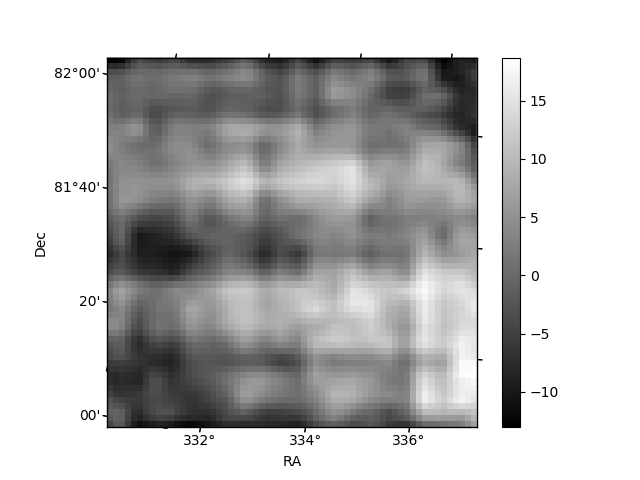
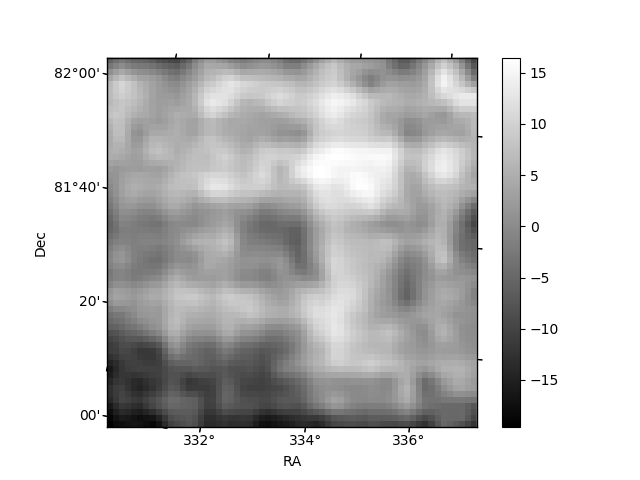
Histogram calculated using DETX and DETY for each event in the final _common_clean file
| Quadrant A |  |
 |
Quadrant B |
|---|---|---|---|
| Quadrant D | 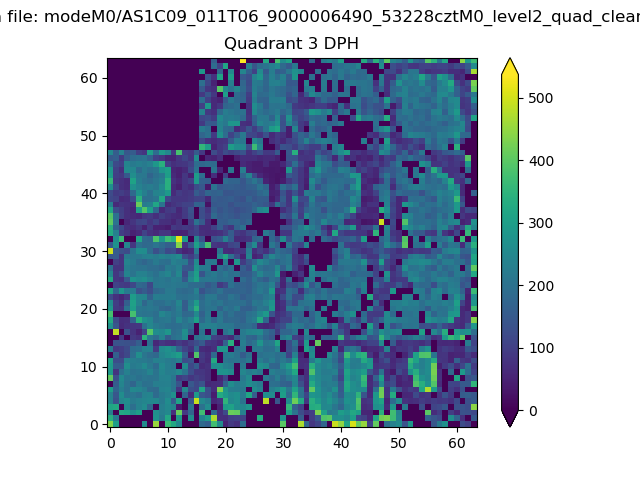 |
 |
Quadrant C |
| Plot type | Count rate plots | Images |
|---|---|---|
| Comparison with Poisson distribution Blue bars denote a histogram of data divided into 1 sec bins. Red curve is a Poisson curve with rate = median count rate of data. |
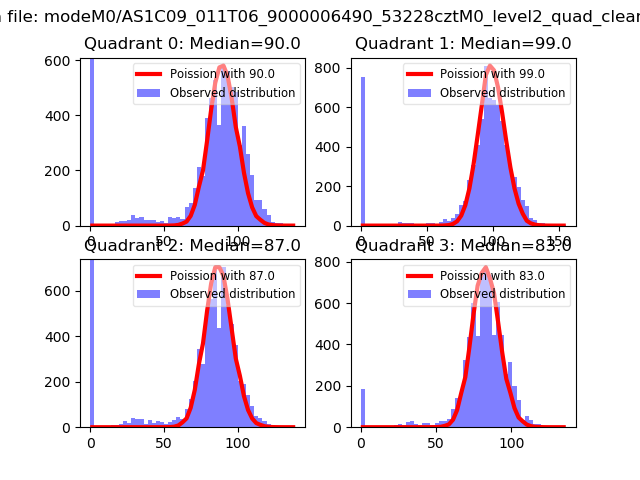 |
 |
| Quadrant-wise count rates Data is divided into 100 sec bins |
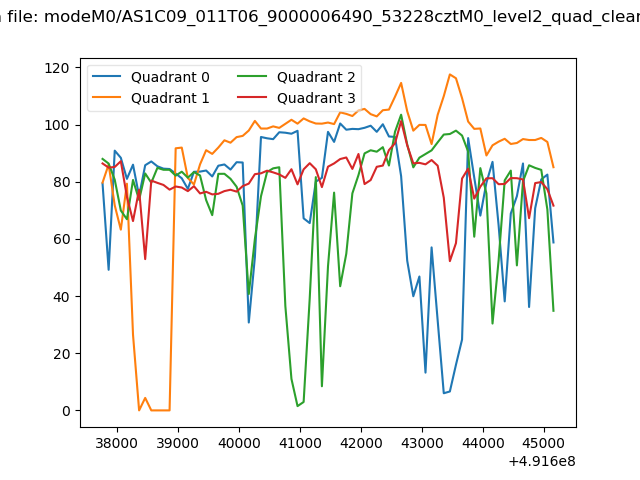 |
|
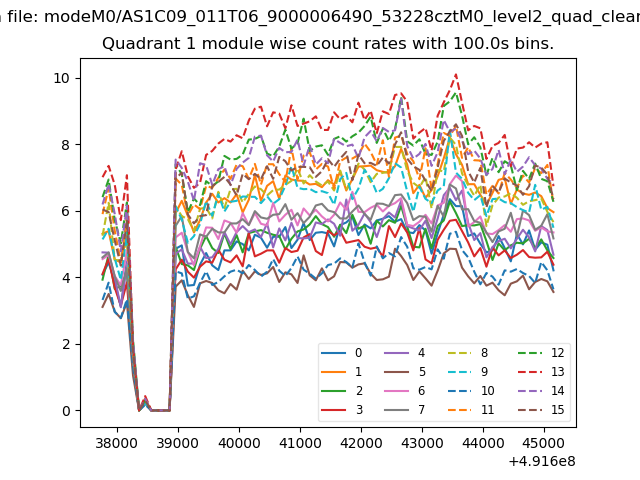
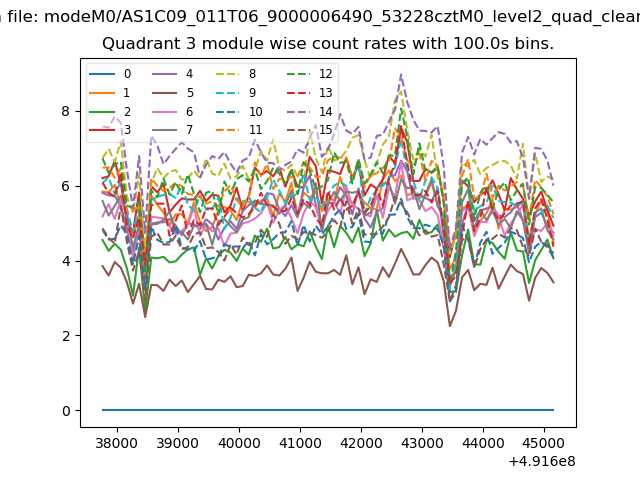
| Module-wise count rates for Quadrant A Data is divided into 100 sec bins |
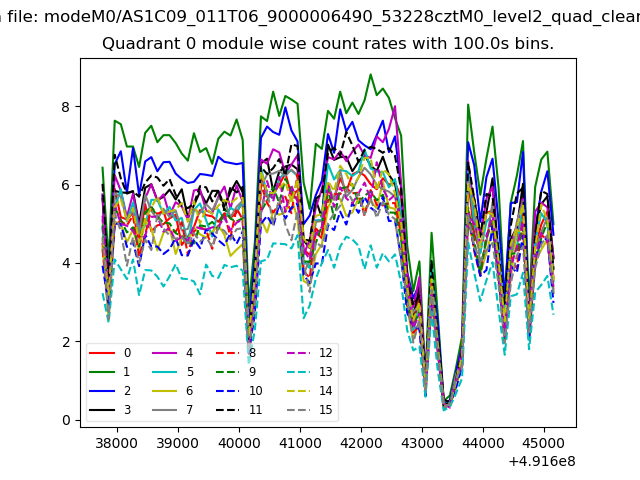 |
 |
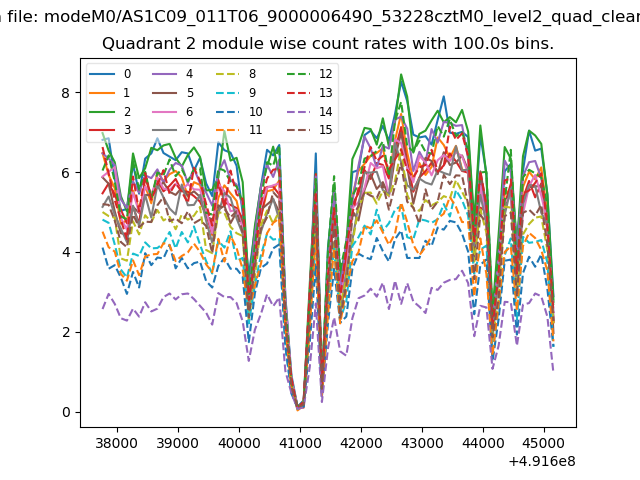
| Module-wise count rates for Quadrant B Data is divided into 100 sec bins |
 |
 |
| Module-wise count rates for Quadrant C Data is divided into 100 sec bins |
 |
 |
| Module-wise count rates for Quadrant D Data is divided into 100 sec bins |
 |
 |
| Parameter | Plot |
|---|---|
| CZT HV Monitor | 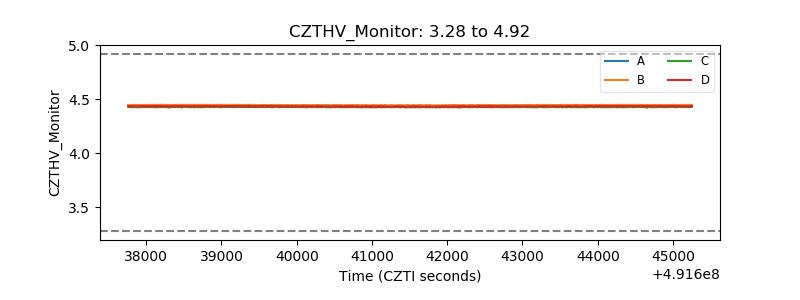 |
| D_VDD | 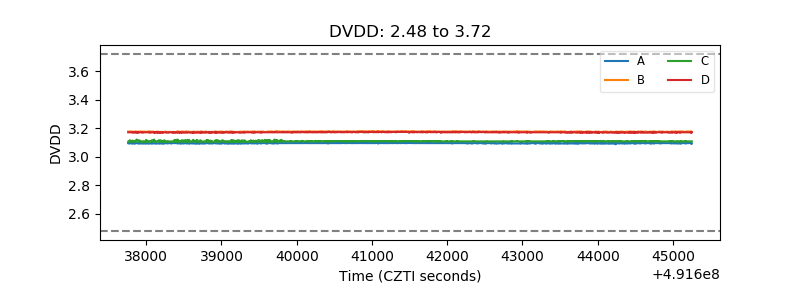 |
| Temperature 1 | 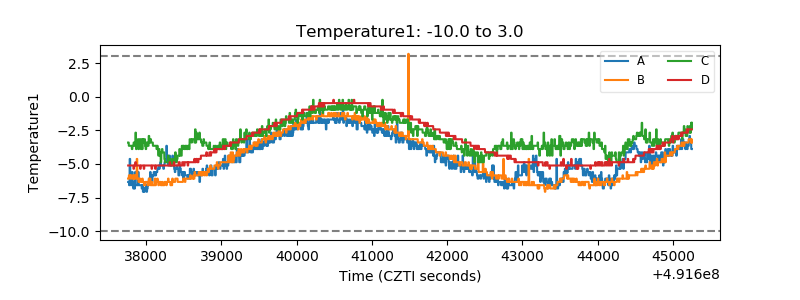 |
| Veto HV Monitor | 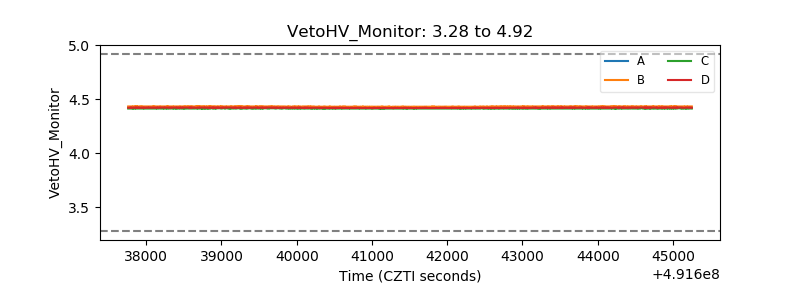 |
| Veto LLD | 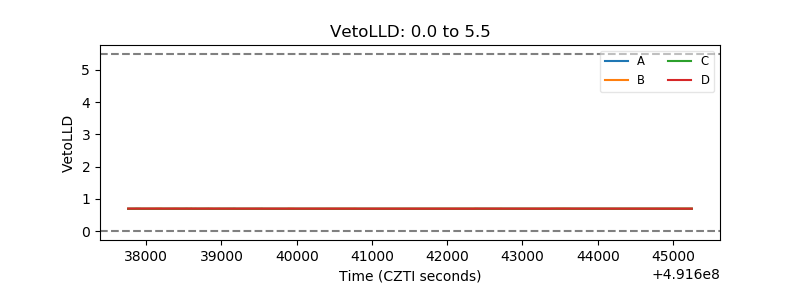 |
| Alpha Counter | 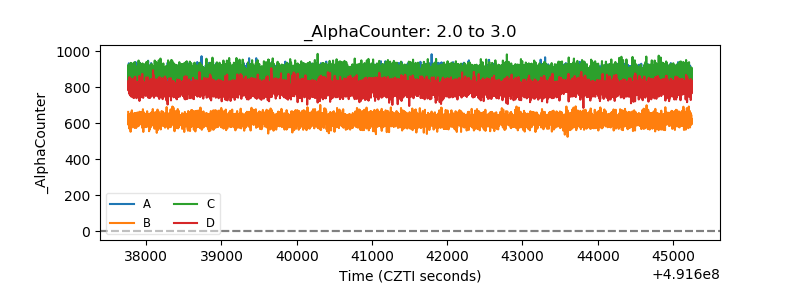 |
| _CPM_Rate | 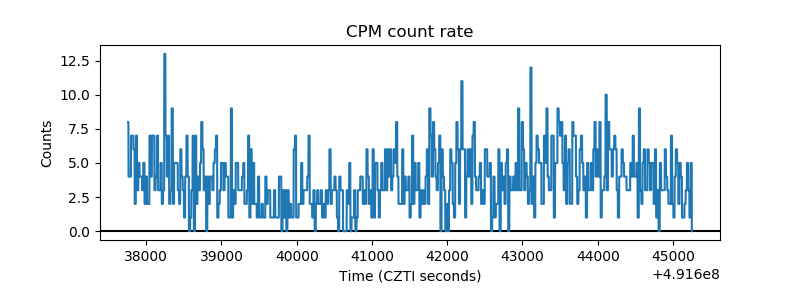 |
| CZT Counter | 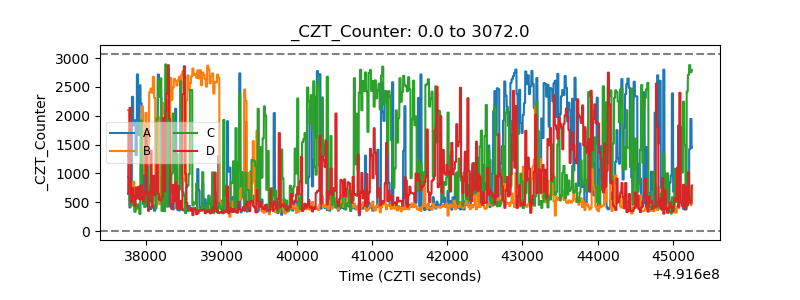 |
| +2.5 Volts monitor |  |
| +5 Volts monitor | 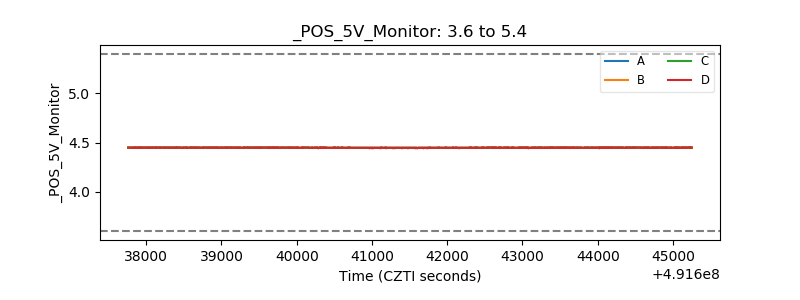 |
| _ROLL_ROT | 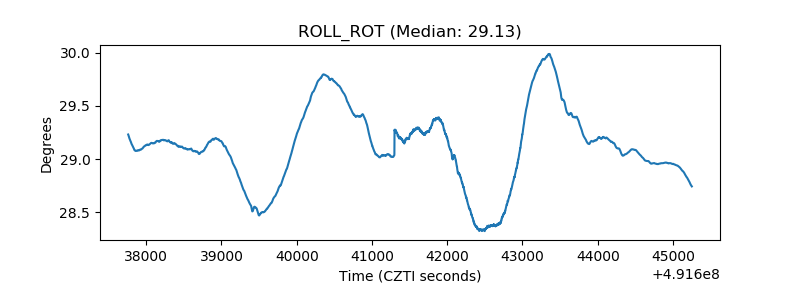 |
| _Roll_DEC | 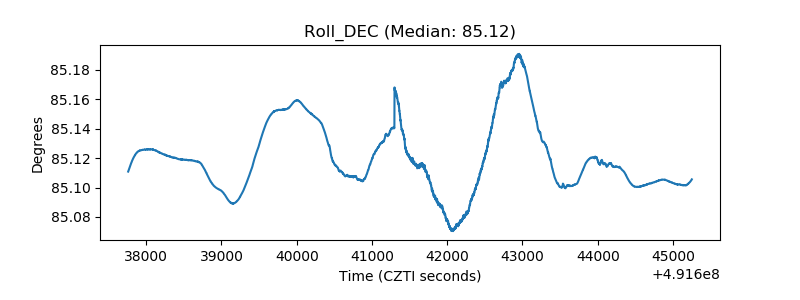 |
| _Roll_RA | 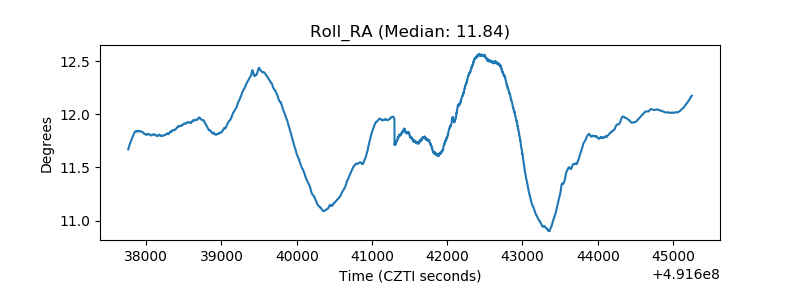 |
| Veto Counter | 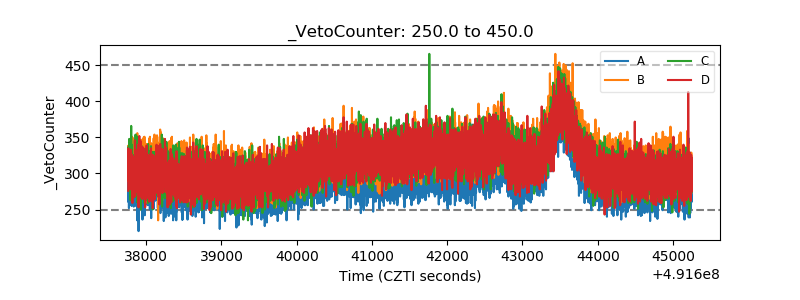 |