| Param | Original file | Final file |
|---|---|---|
| Filename | modeM0/AS1C09_011T06_9000006490_53229cztM0_level2.fits | modeM0/AS1C09_011T06_9000006490_53229cztM0_level2_quad_clean.evt |
| Size (bytes) | 738,979,200 | 89,605,440 |
| Size | 704.7 MB | 85.5 MB |
| Events in quadrant A | 5,602,111 | 619,778 |
| Events in quadrant B | 5,850,160 | 600,214 |
| Events in quadrant C | 9,681,664 | 435,210 |
| Events in quadrant D | 5,672,845 | 565,525 |
| Mode SS | |||
|---|---|---|---|
| Quadrant | BADHDUFLAG | Total packets | Discarded packets |
| A | 0 | 140 | 0 |
| B | 0 | 140 | 0 |
| C | 0 | 140 | 0 |
| D | 0 | 140 | 0 |
| Mode M0 | |||
|---|---|---|---|
| Quadrant | BADHDUFLAG | Total packets | Discarded packets |
| A | 0 | 21665 | 0 |
| B | 0 | 22302 | 0 |
| C | 0 | 33633 | 0 |
| D | 0 | 21826 | 0 |
| Quadrant | Total seconds | Saturated seconds | Saturation percentage |
|---|---|---|---|
| A | 7070 | 579 | 8.189533% |
| B | 7071 | 1060 | 14.990808% |
| C | 7071 | 2256 | 31.904964% |
| D | 7071 | 407 | 5.755904% |
Noise dominated data is calculated using 1-second bins in cleaned event files. If a bin has >2000 counts, and if more than 50% of those come from <1% of pixels, then it is considered to be noise-dominated and hence unusable.
| Quadrant | # 1 sec bins | Bins with >0 counts | Bins with >2000 counts | High rate bins dominated by noise | Noise dominated (total time) | Noise dominated (detector-on time) | Marked lightcurve |
|---|---|---|---|---|---|---|---|
| A | 7070 | 7070 | 494 | 494 | 6.99% | 6.99% | 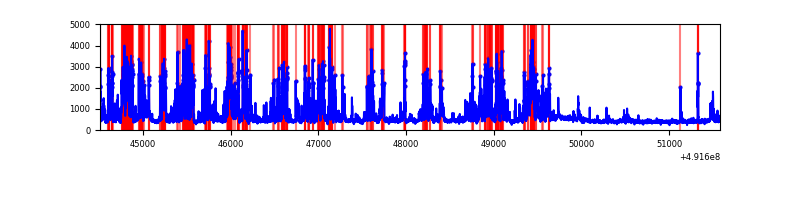 |
| B | 7071 | 7071 | 710 | 710 | 10.04% | 10.04% | 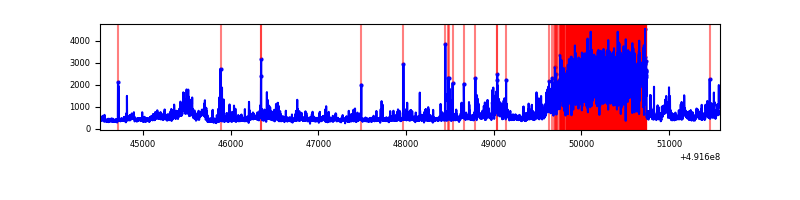 |
| C | 7071 | 7071 | 2136 | 2136 | 30.21% | 30.21% | 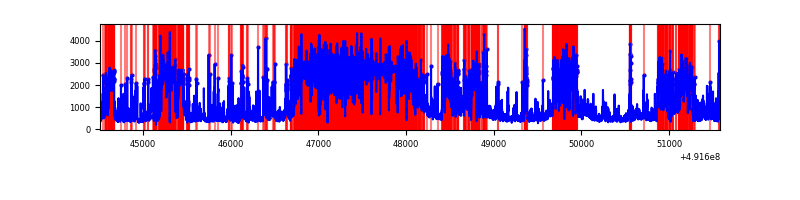 |
| D | 7071 | 7071 | 383 | 383 | 5.42% | 5.42% | 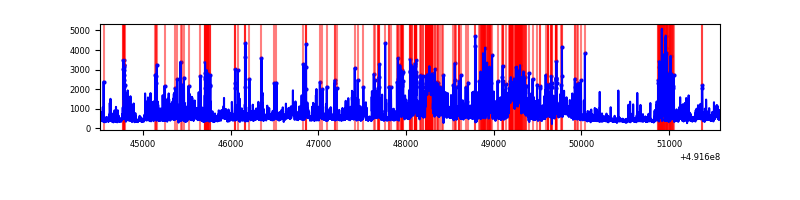 |
Top three noisy pixels from each quadrant. If the there are fewer than three noisy pixels in the level2.evt file, extra rows are filled as -1
| Pixel properties | Quadrant properties | ||||||
|---|---|---|---|---|---|---|---|
| Quadrant | DetID | PixID | Counts | Sigma | Mean | Median | Sigma |
| A | 3 | 62 | 2246423 | 12750.4 | 709 | 690 | 176.1 |
| A | 0 | 8 | 222344 | 1258.47 | 709 | 690 | 176.1 |
| A | 15 | 174 | 96133 | 541.89 | 709 | 690 | 176.1 |
| B | 12 | 17 | 2170652 | 15468.02 | 660 | 638 | 140.3 |
| B | 12 | 33 | 254872 | 1812.2 | 660 | 638 | 140.3 |
| B | 7 | 0 | 229390 | 1630.56 | 660 | 638 | 140.3 |
| C | 1 | 241 | 3467707 | 21503.65 | 584 | 580 | 161.2 |
| C | 15 | 165 | 1305415 | 8092.79 | 584 | 580 | 161.2 |
| C | 15 | 224 | 773574 | 4794.23 | 584 | 580 | 161.2 |
| D | 6 | 239 | 1109549 | 5662.07 | 687 | 656 | 195.8 |
| D | 0 | 18 | 309659 | 1577.79 | 687 | 656 | 195.8 |
| D | 3 | 12 | 244991 | 1247.59 | 687 | 656 | 195.8 |
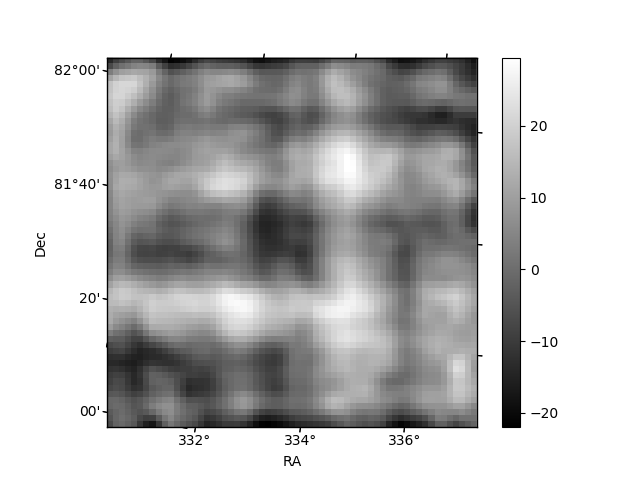
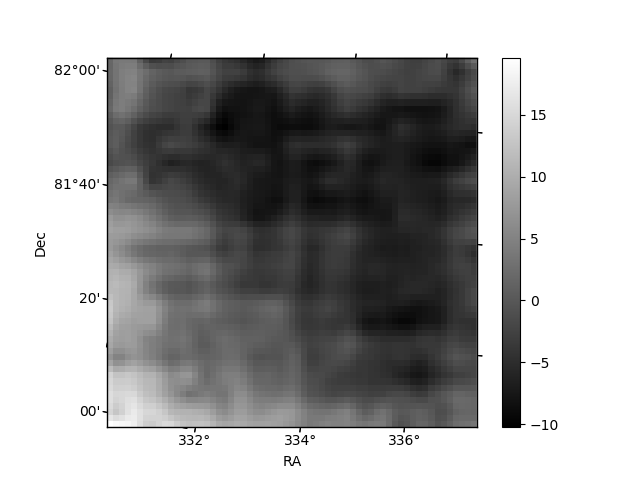
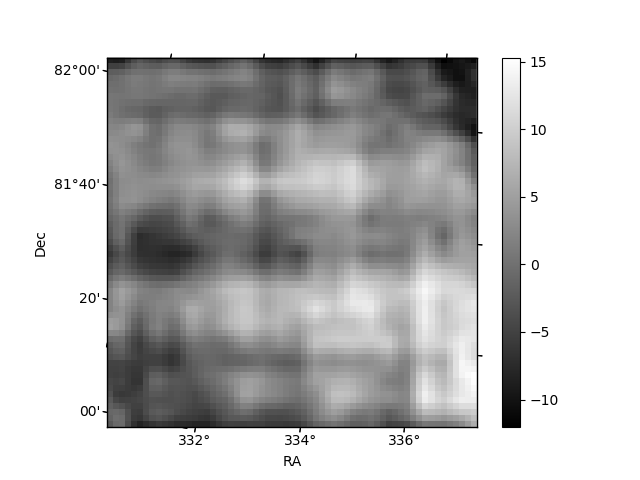
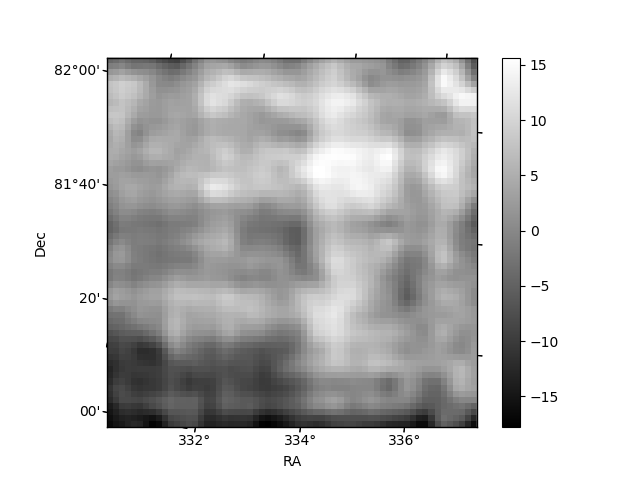
Histogram calculated using DETX and DETY for each event in the final _common_clean file
| Quadrant A | 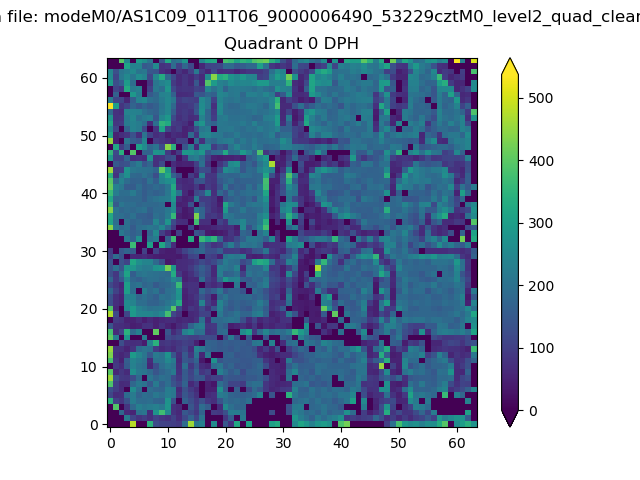 |
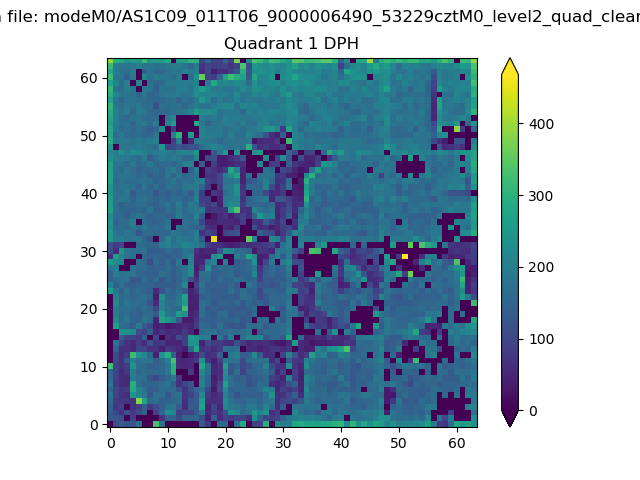 |
Quadrant B |
|---|---|---|---|
| Quadrant D | 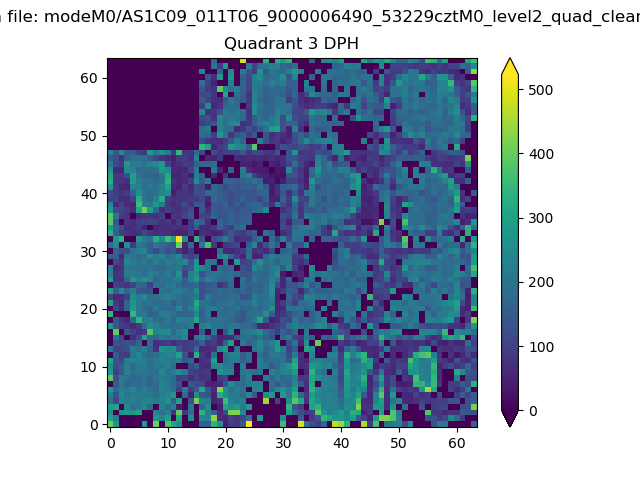 |
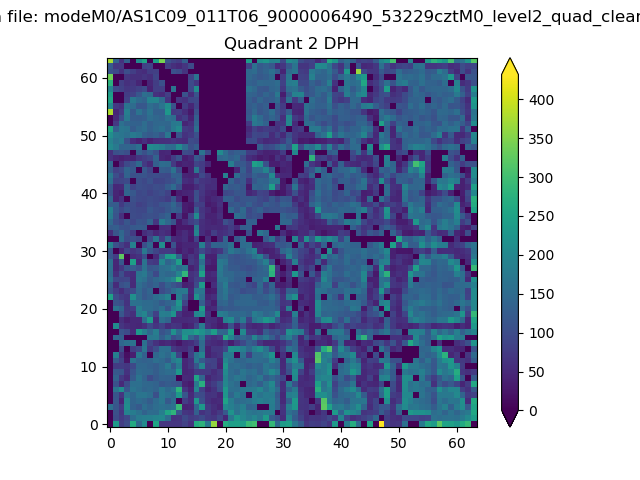 |
Quadrant C |
| Plot type | Count rate plots | Images |
|---|---|---|
| Comparison with Poisson distribution Blue bars denote a histogram of data divided into 1 sec bins. Red curve is a Poisson curve with rate = median count rate of data. |
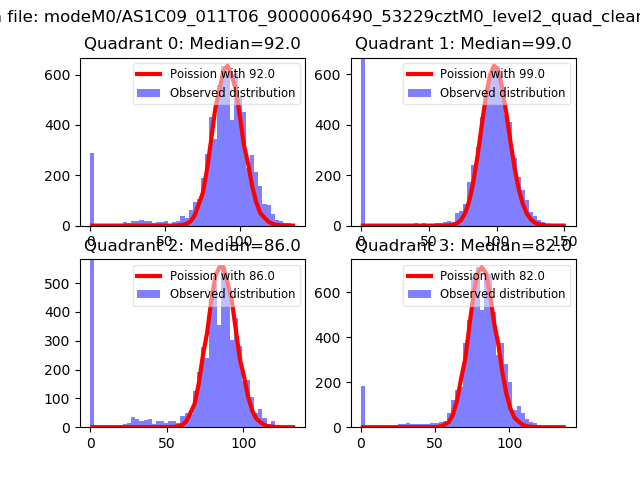 |
 |
| Quadrant-wise count rates Data is divided into 100 sec bins |
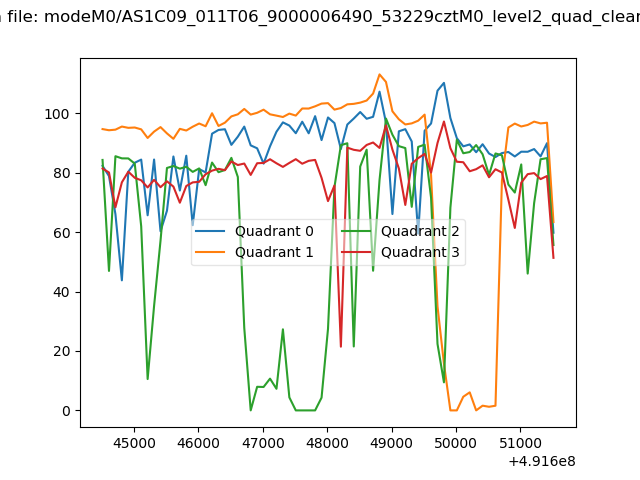 |
|
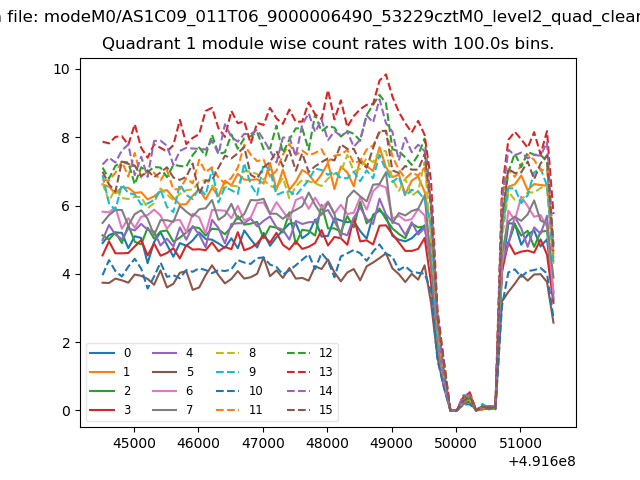
| Module-wise count rates for Quadrant A Data is divided into 100 sec bins |
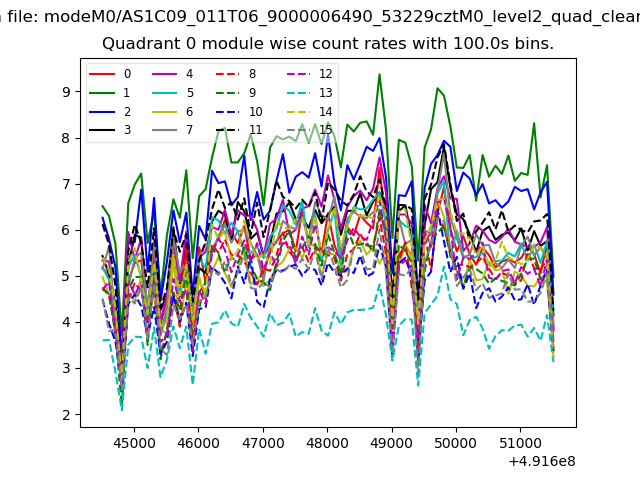 |
 |
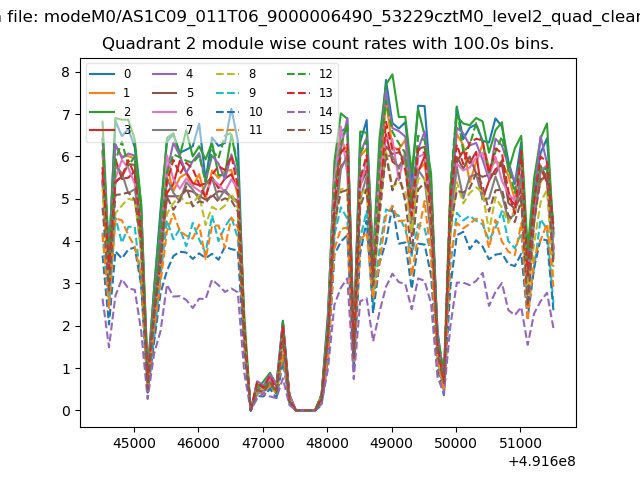
| Module-wise count rates for Quadrant B Data is divided into 100 sec bins |
 |
 |
| Module-wise count rates for Quadrant C Data is divided into 100 sec bins |
 |
 |
| Module-wise count rates for Quadrant D Data is divided into 100 sec bins |
 |
 |
| Parameter | Plot |
|---|---|
| CZT HV Monitor | 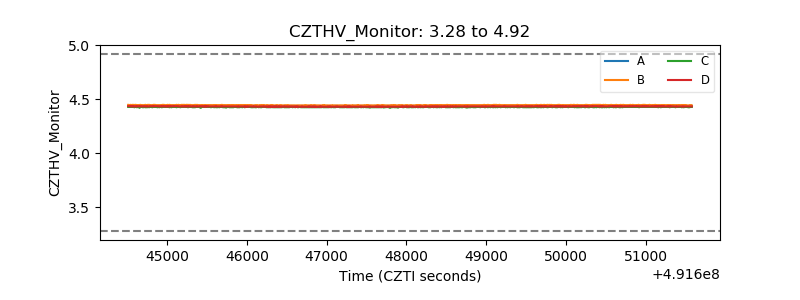 |
| D_VDD | 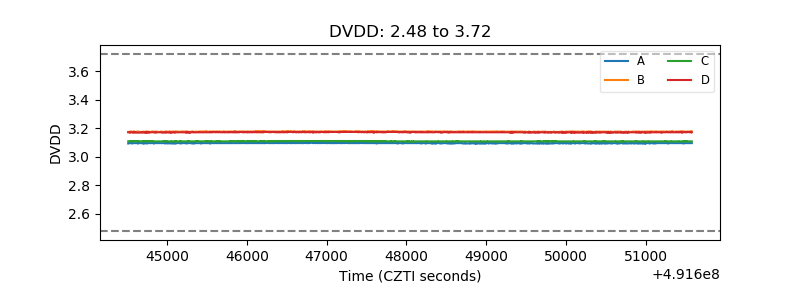 |
| Temperature 1 | 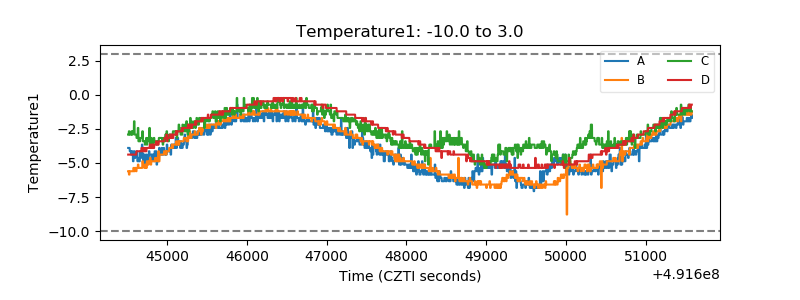 |
| Veto HV Monitor | 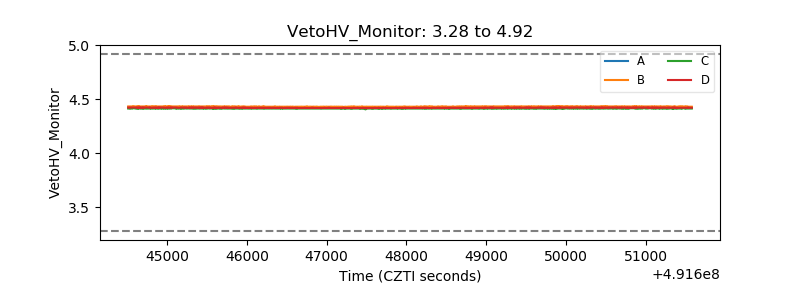 |
| Veto LLD |  |
| Alpha Counter | 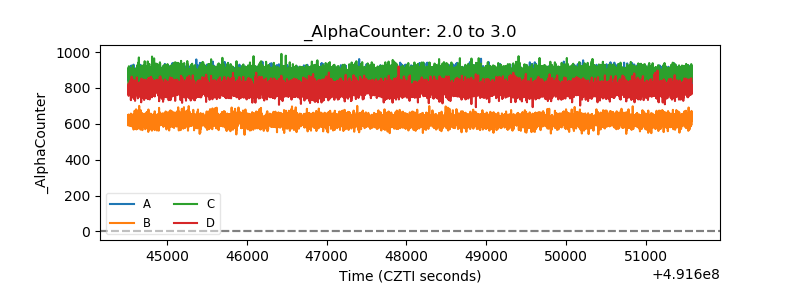 |
| _CPM_Rate | 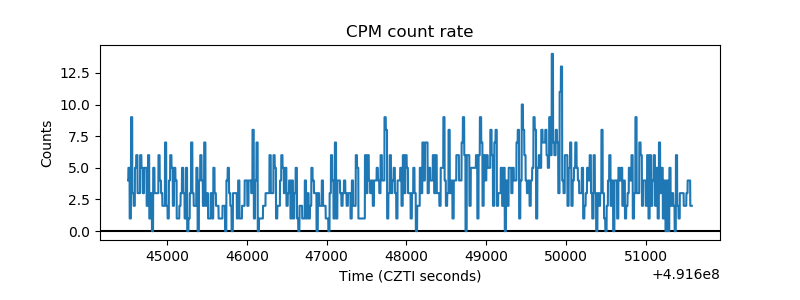 |
| CZT Counter | 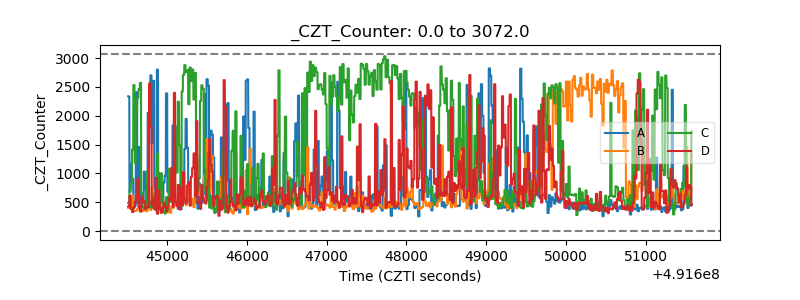 |
| +2.5 Volts monitor |  |
| +5 Volts monitor |  |
| _ROLL_ROT | 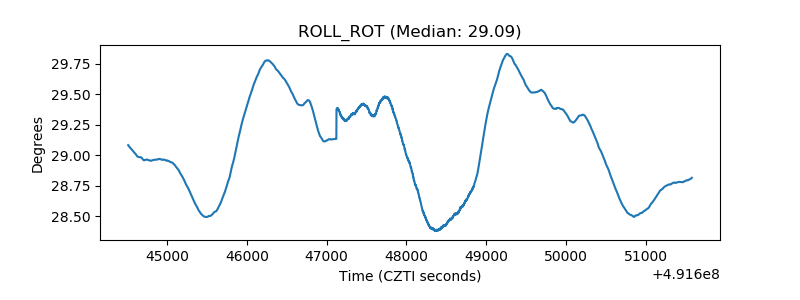 |
| _Roll_DEC | 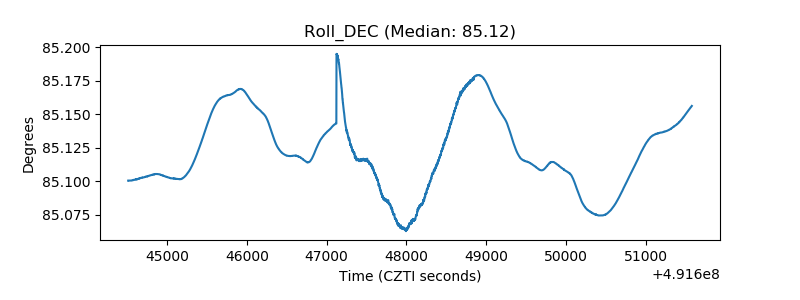 |
| _Roll_RA | 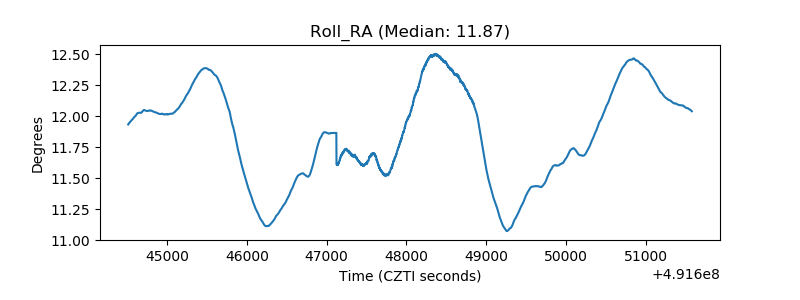 |
| Veto Counter | 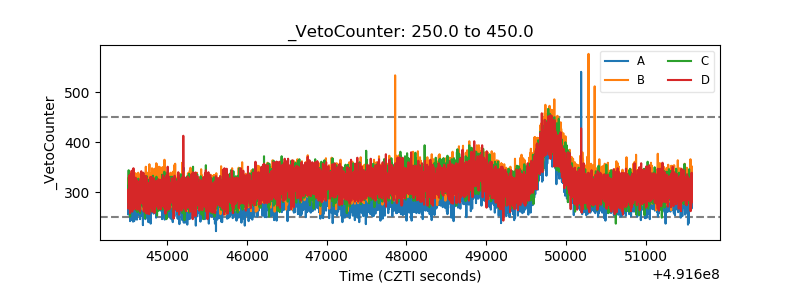 |