| Param | Original file | Final file |
|---|---|---|
| Filename | modeM0/AS1C09_011T06_9000006490_53232cztM0_level2.fits | modeM0/AS1C09_011T06_9000006490_53232cztM0_level2_quad_clean.evt |
| Size (bytes) | 2,448,472,320 | 202,512,960 |
| Size | 2.3 GB | 193.1 MB |
| Events in quadrant A | 13,728,894 | 1,608,713 |
| Events in quadrant B | 37,823,222 | 531,837 |
| Events in quadrant C | 20,967,707 | 1,318,299 |
| Events in quadrant D | 16,682,770 | 1,391,310 |
| Mode M9 | |||
|---|---|---|---|
| Quadrant | BADHDUFLAG | Total packets | Discarded packets |
| A | 0 | 13 | 0 |
| B | 0 | 13 | 0 |
| C | 0 | 13 | 0 |
| D | 0 | 13 | 0 |
| Mode SS | |||
|---|---|---|---|
| Quadrant | BADHDUFLAG | Total packets | Discarded packets |
| A | 0 | 376 | 0 |
| B | 0 | 376 | 0 |
| C | 0 | 376 | 0 |
| D | 0 | 376 | 0 |
| Mode M0 | |||
|---|---|---|---|
| Quadrant | BADHDUFLAG | Total packets | Discarded packets |
| A | 0 | 53901 | 4 |
| B | 0 | 124924 | 4 |
| C | 0 | 75082 | 4 |
| D | 0 | 62428 | 4 |
| Quadrant | Total seconds | Saturated seconds | Saturation percentage |
|---|---|---|---|
| A | 18581 | 1589 | 8.551746% |
| B | 18582 | 13801 | 74.270800% |
| C | 18582 | 3527 | 18.980734% |
| D | 18582 | 1930 | 10.386395% |
Noise dominated data is calculated using 1-second bins in cleaned event files. If a bin has >2000 counts, and if more than 50% of those come from <1% of pixels, then it is considered to be noise-dominated and hence unusable.
| Quadrant | # 1 sec bins | Bins with >0 counts | Bins with >2000 counts | High rate bins dominated by noise | Noise dominated (total time) | Noise dominated (detector-on time) | Marked lightcurve |
|---|---|---|---|---|---|---|---|
| A | 19791 | 18585 | 1137 | 1137 | 5.75% | 6.12% | 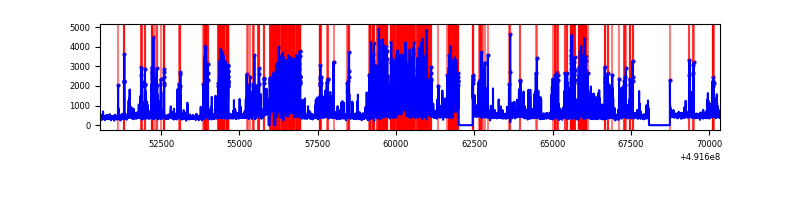 |
| B | 19791 | 18585 | 12162 | 12162 | 61.45% | 65.44% | 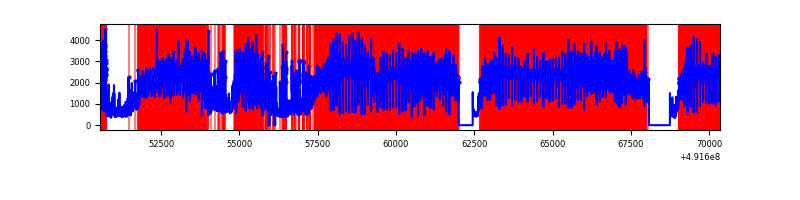 |
| C | 19792 | 18586 | 2985 | 2985 | 15.08% | 16.06% | 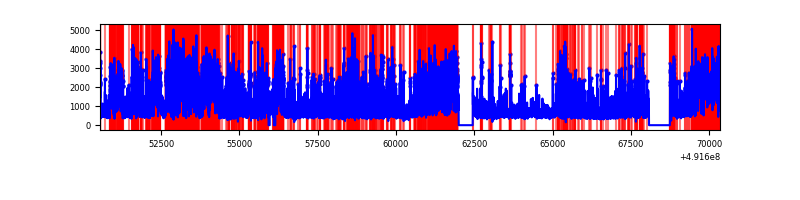 |
| D | 19792 | 18586 | 1670 | 1670 | 8.44% | 8.99% | 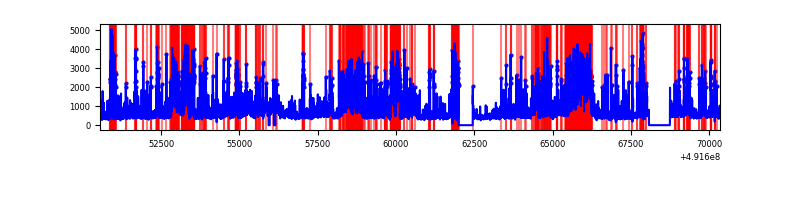 |
Top three noisy pixels from each quadrant. If the there are fewer than three noisy pixels in the level2.evt file, extra rows are filled as -1
| Pixel properties | Quadrant properties | ||||||
|---|---|---|---|---|---|---|---|
| Quadrant | DetID | PixID | Counts | Sigma | Mean | Median | Sigma |
| A | 3 | 62 | 2711950 | 5765.99 | 1890 | 1838 | 470.0 |
| A | 0 | 8 | 1561269 | 3317.82 | 1890 | 1838 | 470.0 |
| A | 14 | 254 | 839136 | 1781.42 | 1890 | 1838 | 470.0 |
| B | 12 | 33 | 29326514 | 119781.37 | 1152 | 1111 | 244.8 |
| B | 2 | 249 | 1098552 | 4482.56 | 1152 | 1111 | 244.8 |
| B | 10 | 254 | 856606 | 3494.32 | 1152 | 1111 | 244.8 |
| C | 1 | 241 | 4556197 | 9563.39 | 1739 | 1725 | 476.2 |
| C | 15 | 224 | 3641528 | 7642.79 | 1739 | 1725 | 476.2 |
| C | 9 | 38 | 1712649 | 3592.56 | 1739 | 1725 | 476.2 |
| D | 10 | 172 | 2766474 | 5273.39 | 1831 | 1747 | 524.3 |
| D | 15 | 125 | 1623700 | 3093.68 | 1831 | 1747 | 524.3 |
| D | 11 | 176 | 1194675 | 2275.37 | 1831 | 1747 | 524.3 |
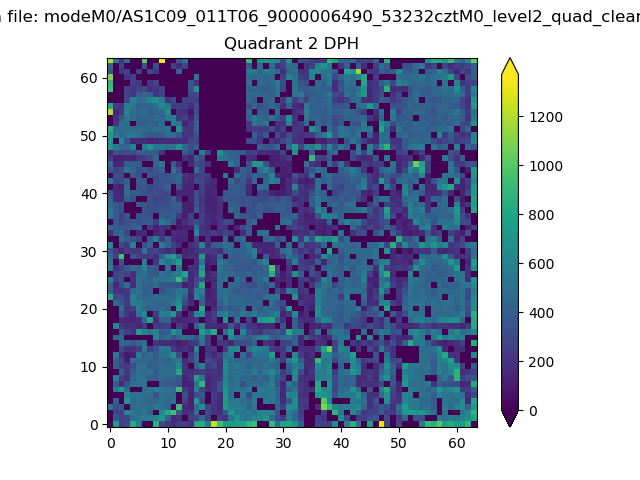
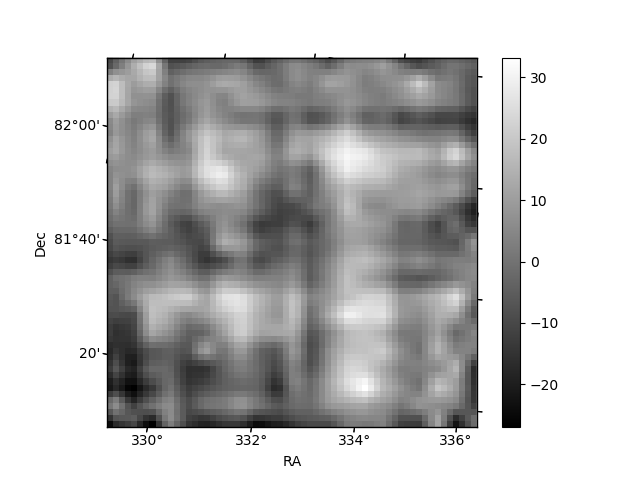
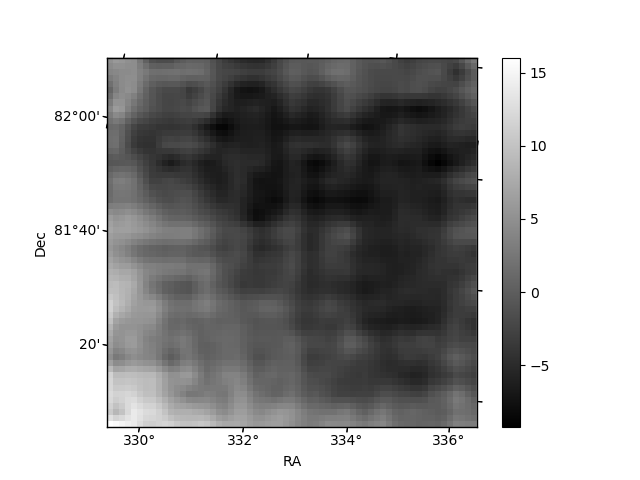
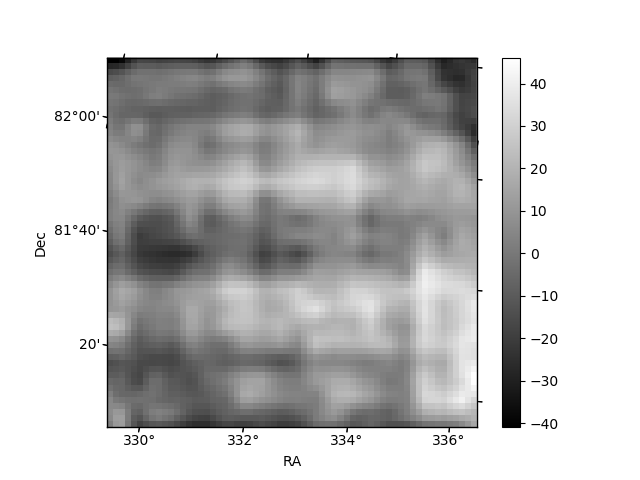
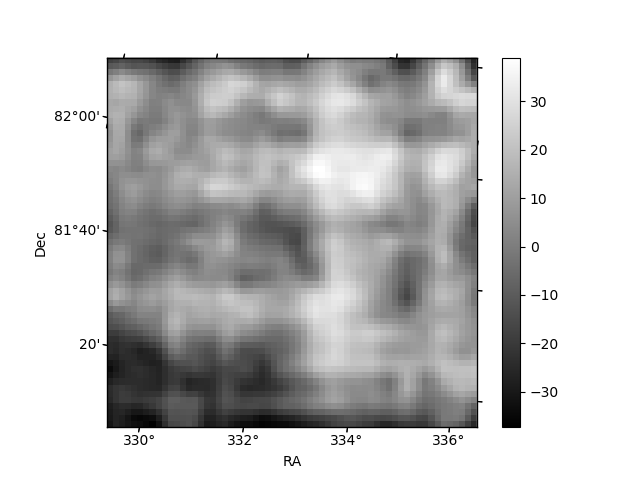
Histogram calculated using DETX and DETY for each event in the final _common_clean file
| Quadrant A | 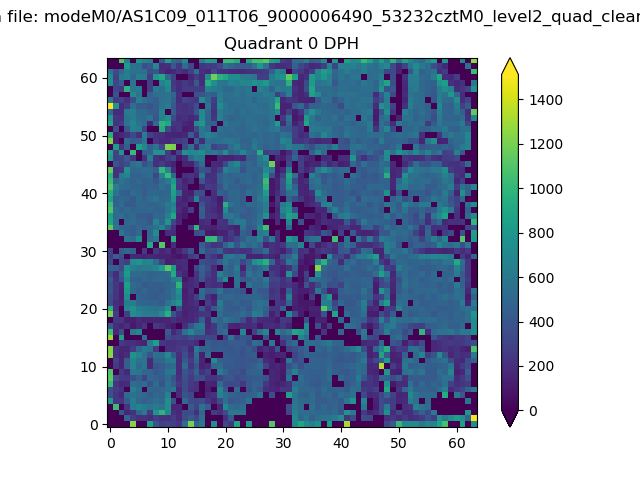 |
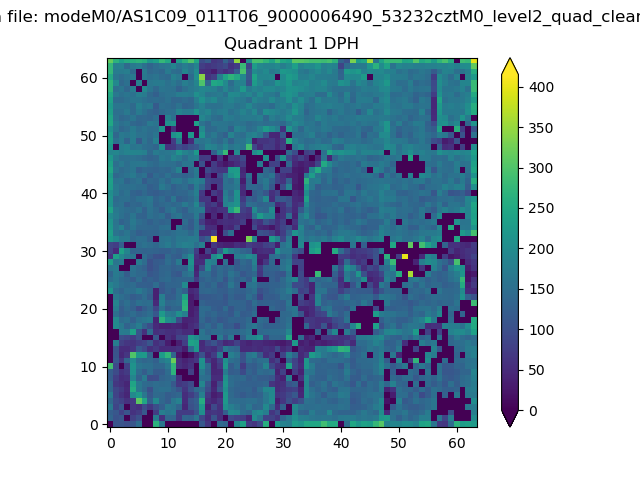 |
Quadrant B |
|---|---|---|---|
| Quadrant D | 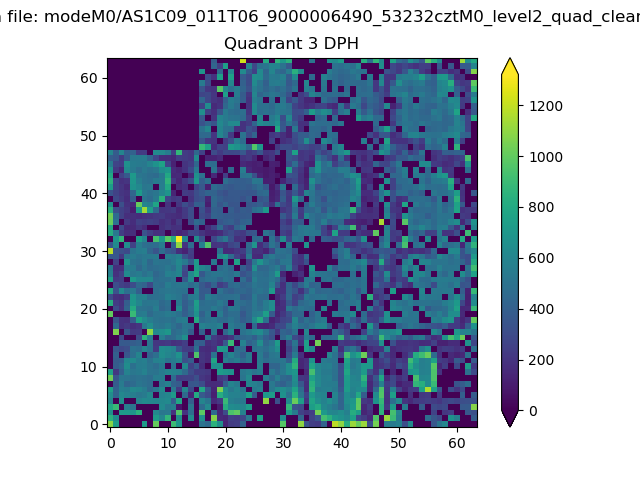 |
 |
Quadrant C |
| Plot type | Count rate plots | Images |
|---|---|---|
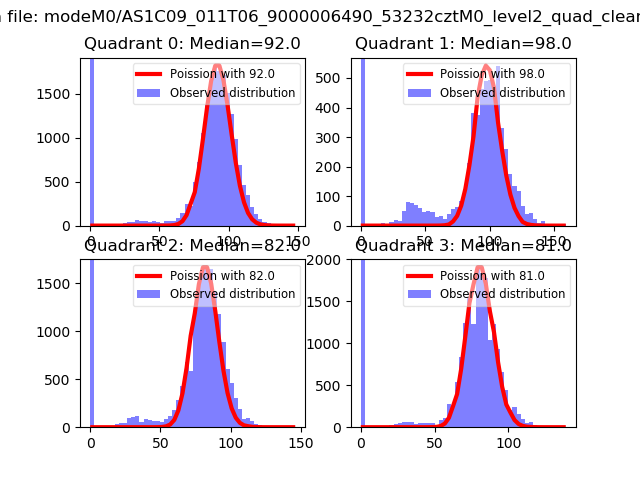
| Comparison with Poisson distribution Blue bars denote a histogram of data divided into 1 sec bins. Red curve is a Poisson curve with rate = median count rate of data. |
 |
 |
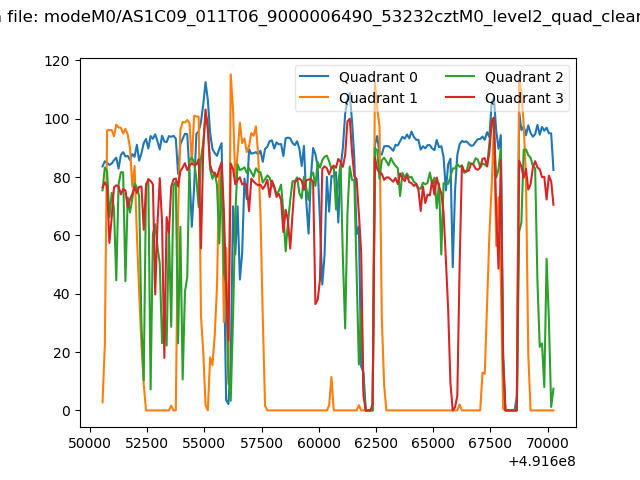
| Quadrant-wise count rates Data is divided into 100 sec bins |
 |
|
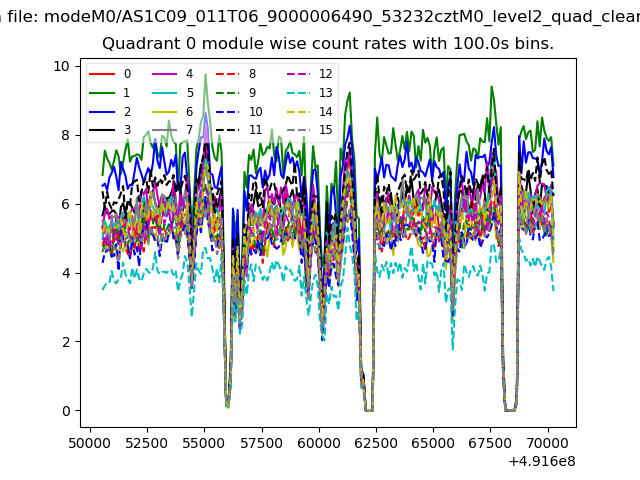
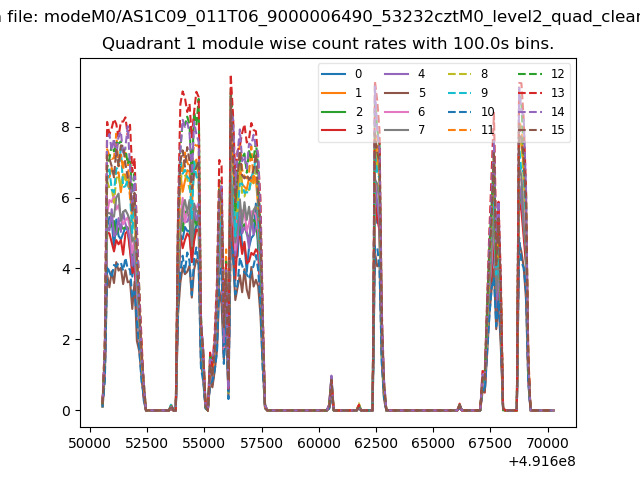
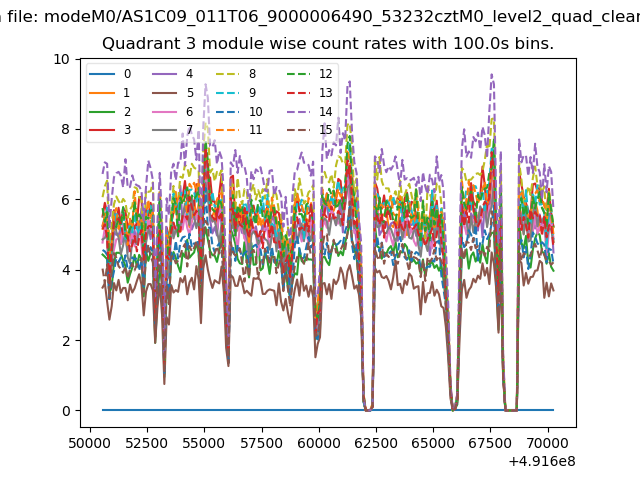
| Module-wise count rates for Quadrant A Data is divided into 100 sec bins |
 |
 |
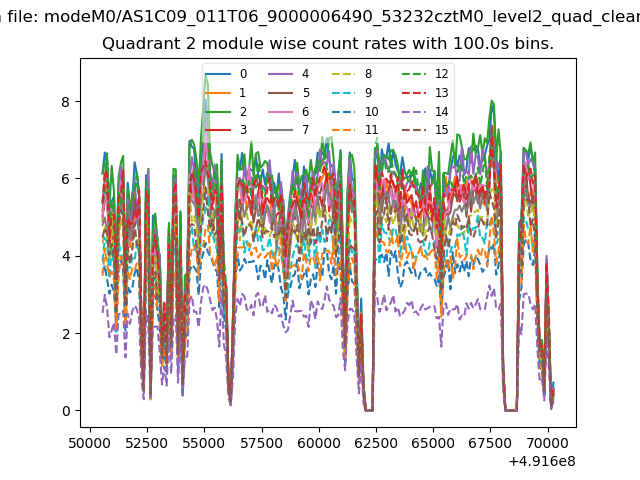
| Module-wise count rates for Quadrant B Data is divided into 100 sec bins |
 |
 |
| Module-wise count rates for Quadrant C Data is divided into 100 sec bins |
 |
 |
| Module-wise count rates for Quadrant D Data is divided into 100 sec bins |
 |
 |
| Parameter | Plot |
|---|---|
| CZT HV Monitor | 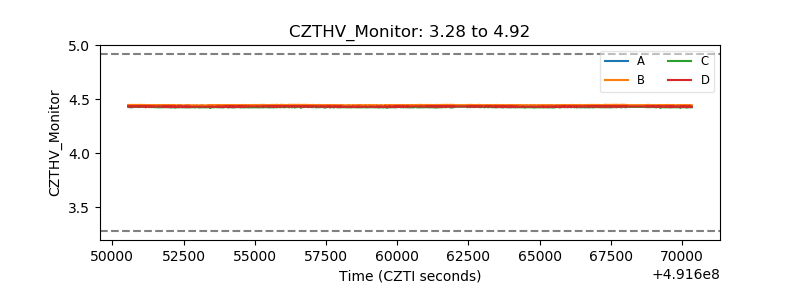 |
| D_VDD | 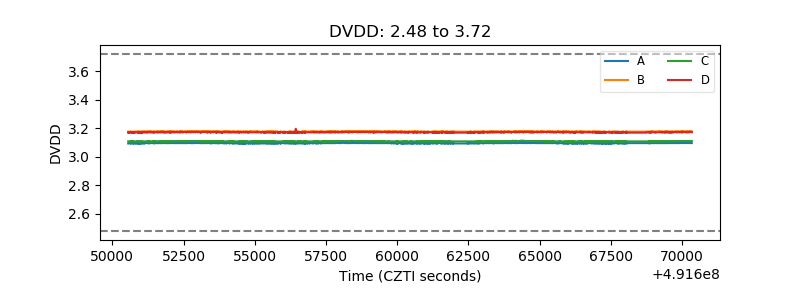 |
| Temperature 1 | 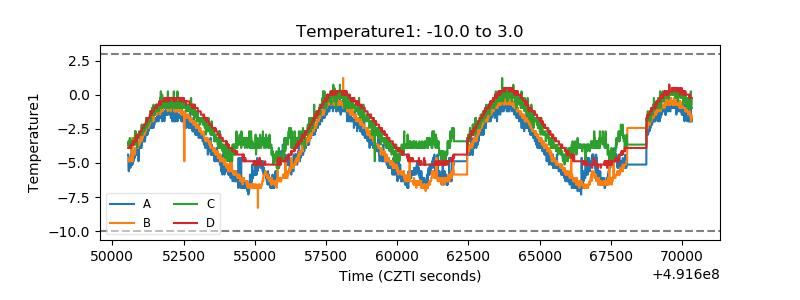 |
| Veto HV Monitor | 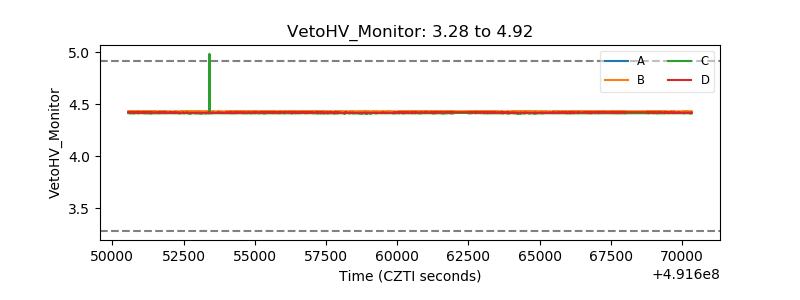 |
| Veto LLD | 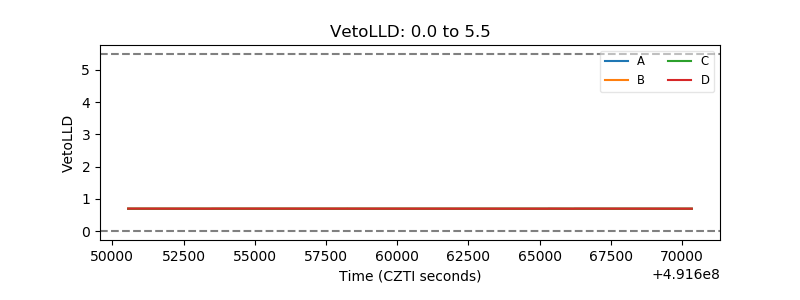 |
| Alpha Counter | 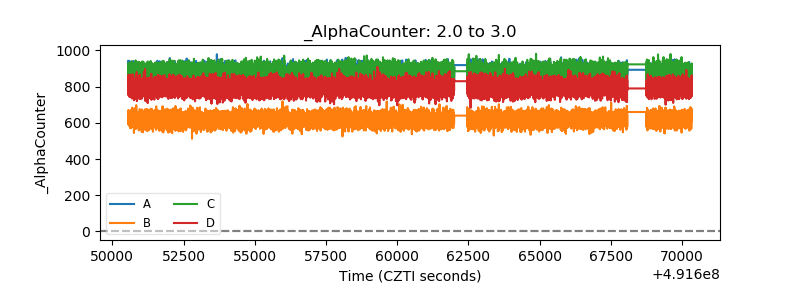 |
| _CPM_Rate | 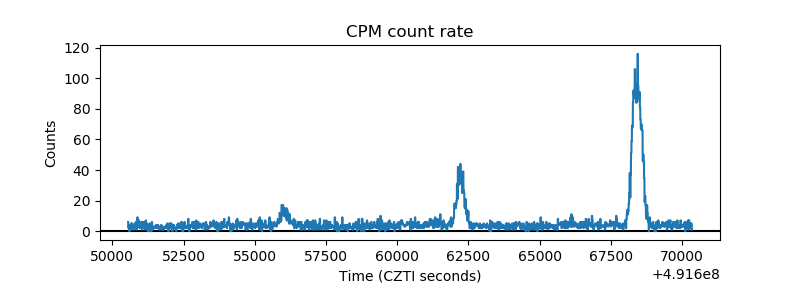 |
| CZT Counter | 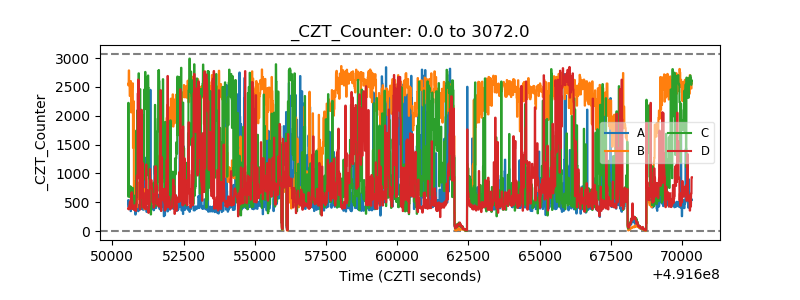 |
| +2.5 Volts monitor |  |
| +5 Volts monitor | 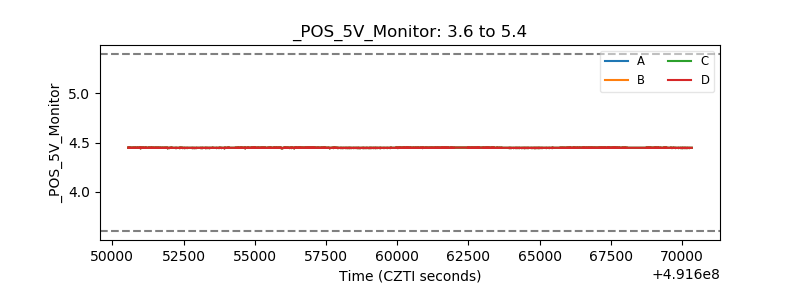 |
| _ROLL_ROT | 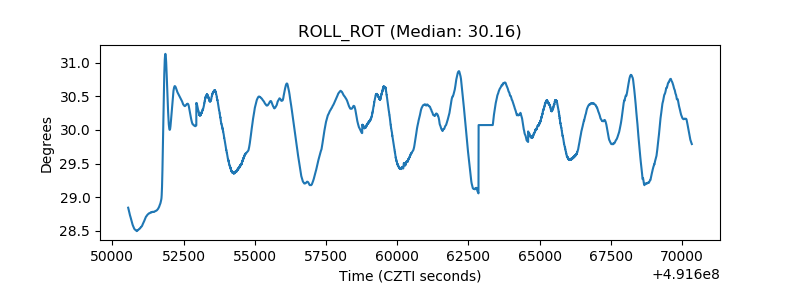 |
| _Roll_DEC | 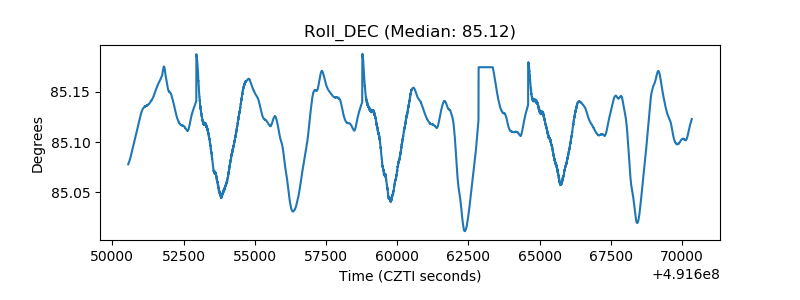 |
| _Roll_RA | 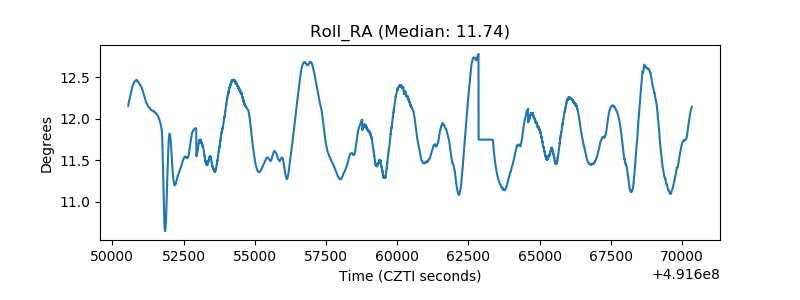 |
| Veto Counter | 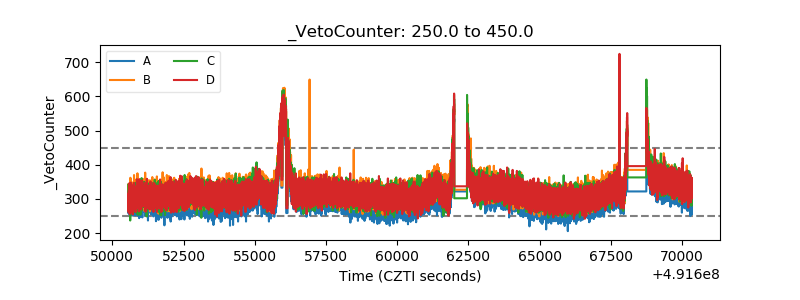 |