| Param | Original file | Final file |
|---|---|---|
| Filename | modeM0/AS1C09_011T06_9000006490_53236cztM0_level2.fits | modeM0/AS1C09_011T06_9000006490_53236cztM0_level2_quad_clean.evt |
| Size (bytes) | 896,685,120 | 79,047,360 |
| Size | 855.1 MB | 75.4 MB |
| Events in quadrant A | 6,946,499 | 550,814 |
| Events in quadrant B | 11,300,449 | 374,528 |
| Events in quadrant C | 8,801,794 | 461,410 |
| Events in quadrant D | 5,650,890 | 560,555 |
| Mode M9 | |||
|---|---|---|---|
| Quadrant | BADHDUFLAG | Total packets | Discarded packets |
| A | 0 | 11 | 0 |
| B | 0 | 11 | 0 |
| C | 0 | 11 | 0 |
| D | 0 | 11 | 0 |
| Mode SS | |||
|---|---|---|---|
| Quadrant | BADHDUFLAG | Total packets | Discarded packets |
| A | 0 | 130 | 0 |
| B | 0 | 130 | 0 |
| C | 0 | 130 | 0 |
| D | 0 | 130 | 0 |
| Mode M0 | |||
|---|---|---|---|
| Quadrant | BADHDUFLAG | Total packets | Discarded packets |
| A | 0 | 24985 | 1 |
| B | 0 | 38003 | 1 |
| C | 0 | 30626 | 1 |
| D | 0 | 21290 | 1 |
| Quadrant | Total seconds | Saturated seconds | Saturation percentage |
|---|---|---|---|
| A | 6386 | 1096 | 17.162543% |
| B | 6387 | 3159 | 49.459840% |
| C | 6386 | 1737 | 27.200125% |
| D | 6386 | 388 | 6.075791% |
Noise dominated data is calculated using 1-second bins in cleaned event files. If a bin has >2000 counts, and if more than 50% of those come from <1% of pixels, then it is considered to be noise-dominated and hence unusable.
| Quadrant | # 1 sec bins | Bins with >0 counts | Bins with >2000 counts | High rate bins dominated by noise | Noise dominated (total time) | Noise dominated (detector-on time) | Marked lightcurve |
|---|---|---|---|---|---|---|---|
| A | 7511 | 6387 | 985 | 985 | 13.11% | 15.42% | 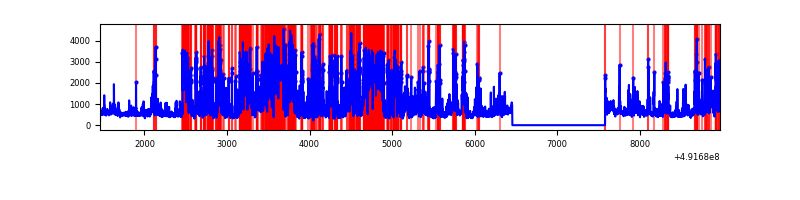 |
| B | 7512 | 6388 | 2642 | 2642 | 35.17% | 41.36% | 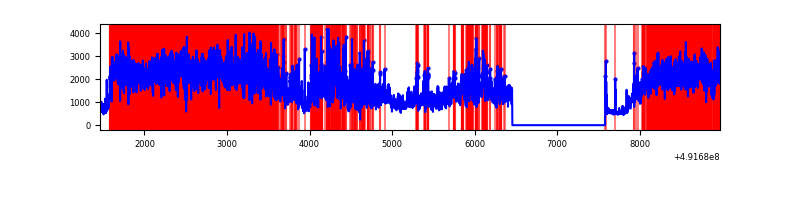 |
| C | 7510 | 6386 | 1519 | 1519 | 20.23% | 23.79% | 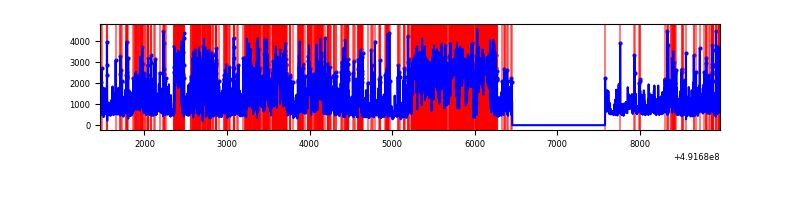 |
| D | 7511 | 6387 | 370 | 370 | 4.93% | 5.79% | 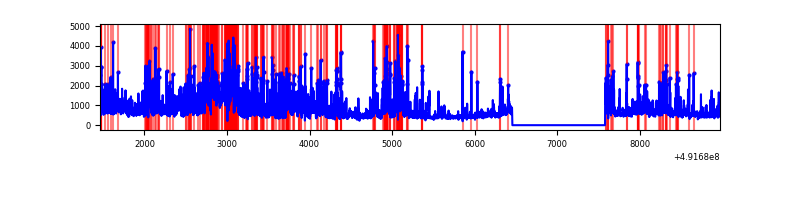 |
Top three noisy pixels from each quadrant. If the there are fewer than three noisy pixels in the level2.evt file, extra rows are filled as -1
| Pixel properties | Quadrant properties | ||||||
|---|---|---|---|---|---|---|---|
| Quadrant | DetID | PixID | Counts | Sigma | Mean | Median | Sigma |
| A | 3 | 62 | 3192623 | 20010.1 | 632 | 616 | 159.5 |
| A | 0 | 8 | 549991 | 3443.93 | 632 | 616 | 159.5 |
| A | 7 | 206 | 204165 | 1276.01 | 632 | 616 | 159.5 |
| B | 12 | 33 | 6867714 | 56191.13 | 572 | 554 | 122.2 |
| B | 10 | 254 | 685241 | 5602.51 | 572 | 554 | 122.2 |
| B | 2 | 249 | 637667 | 5213.23 | 572 | 554 | 122.2 |
| C | 1 | 241 | 3318517 | 20232.67 | 589 | 584 | 164.0 |
| C | 15 | 224 | 2062029 | 12570.64 | 589 | 584 | 164.0 |
| C | 7 | 80 | 229559 | 1396.28 | 589 | 584 | 164.0 |
| D | 11 | 245 | 1042885 | 5624.41 | 654 | 624 | 185.3 |
| D | 15 | 125 | 487407 | 2626.85 | 654 | 624 | 185.3 |
| D | 12 | 3 | 408845 | 2202.91 | 654 | 624 | 185.3 |
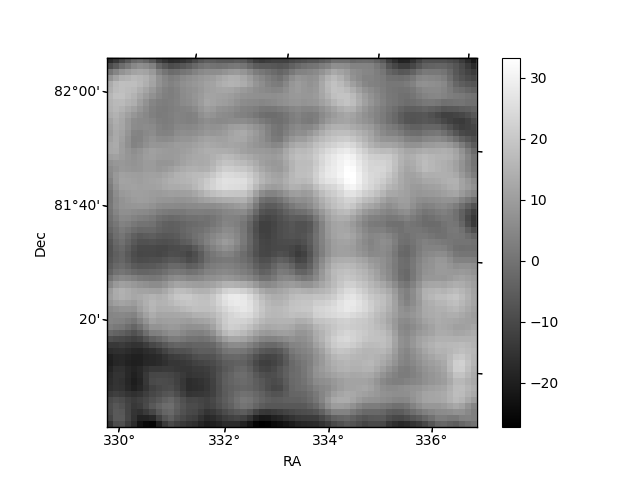
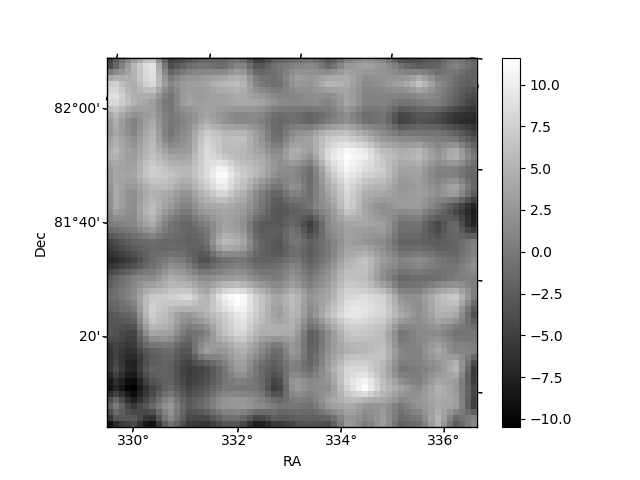
Histogram calculated using DETX and DETY for each event in the final _common_clean file
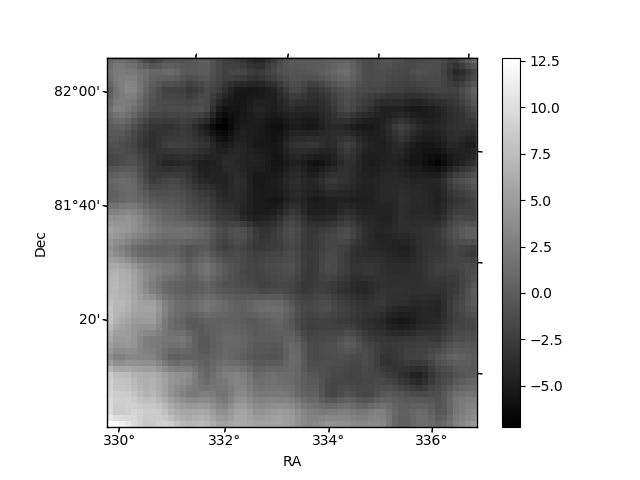
| Quadrant A | 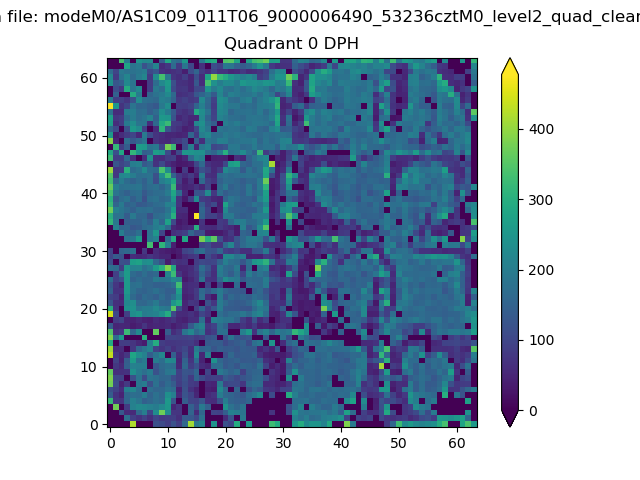 |
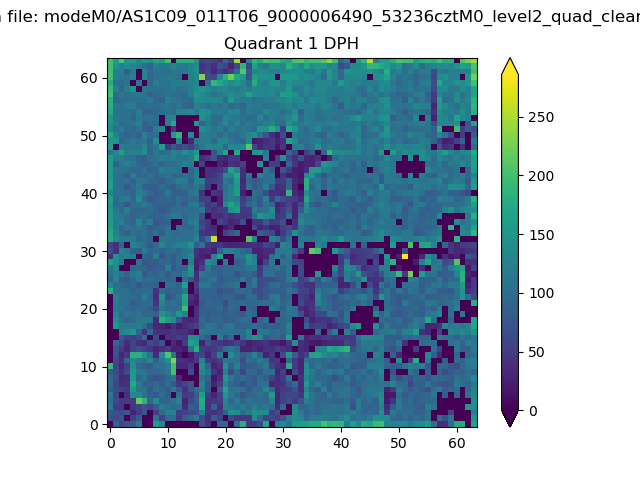 |
Quadrant B |
|---|---|---|---|
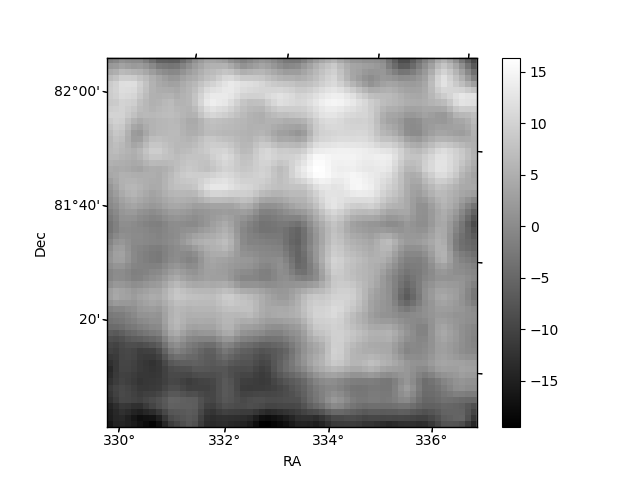
| Quadrant D | 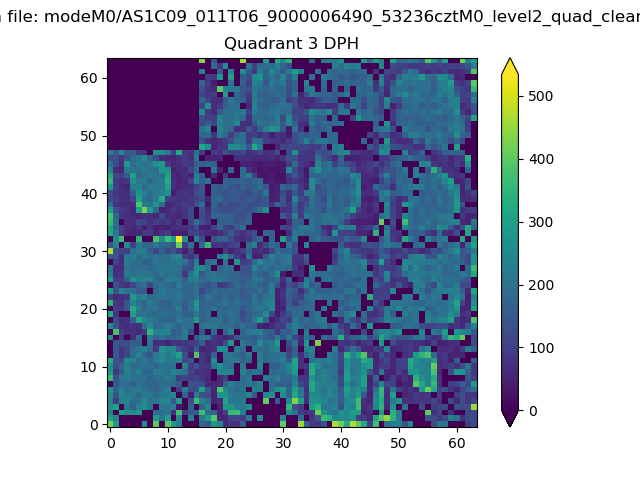 |
 |
Quadrant C |
| Plot type | Count rate plots | Images |
|---|---|---|
| Comparison with Poisson distribution Blue bars denote a histogram of data divided into 1 sec bins. Red curve is a Poisson curve with rate = median count rate of data. |
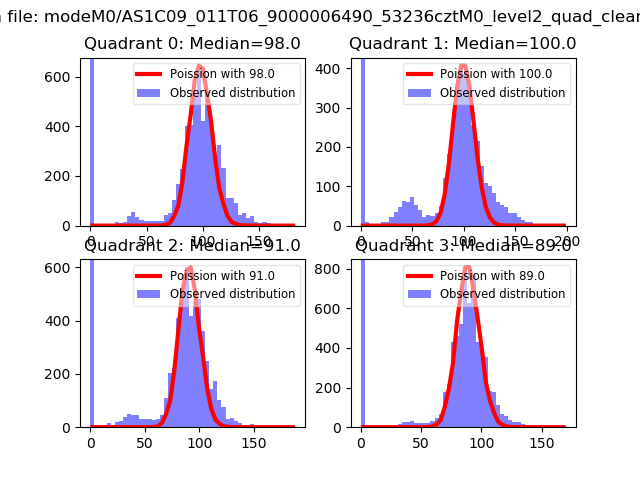 |
 |
| Quadrant-wise count rates Data is divided into 100 sec bins |
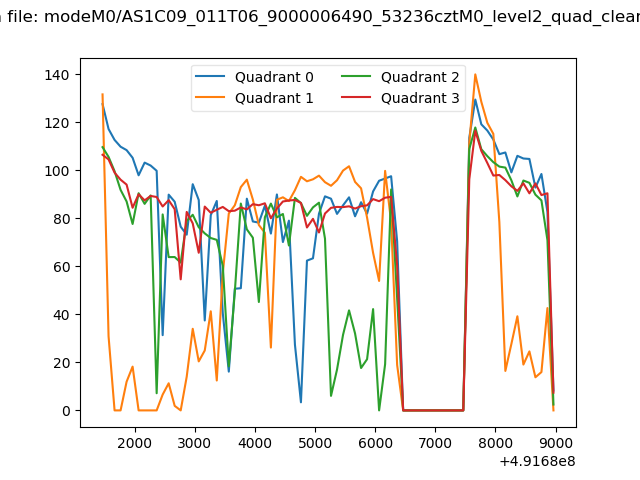 |
|
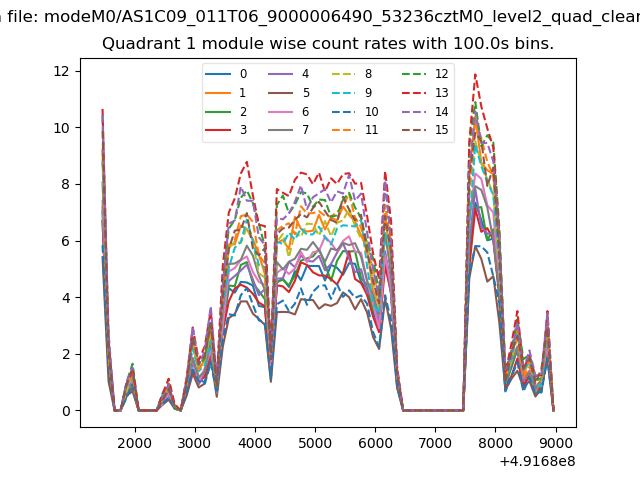
| Module-wise count rates for Quadrant A Data is divided into 100 sec bins |
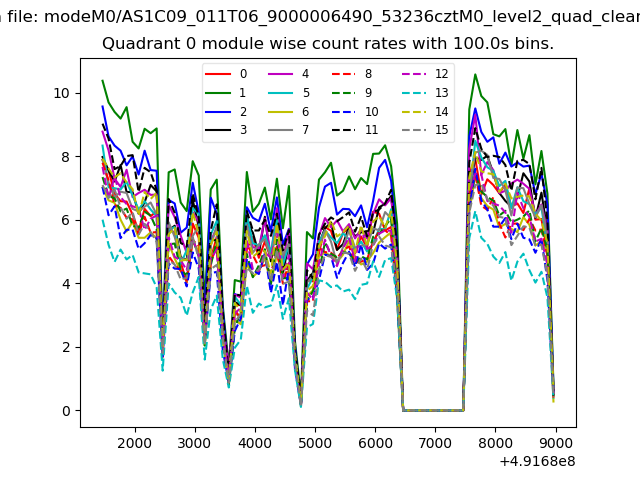 |
 |
| Module-wise count rates for Quadrant B Data is divided into 100 sec bins |
 |
 |
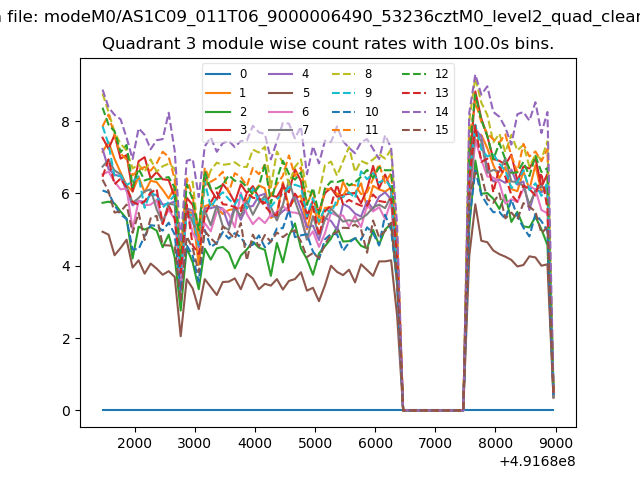
| Module-wise count rates for Quadrant C Data is divided into 100 sec bins |
 |
 |
| Module-wise count rates for Quadrant D Data is divided into 100 sec bins |
 |
 |
| Parameter | Plot |
|---|---|
| CZT HV Monitor | 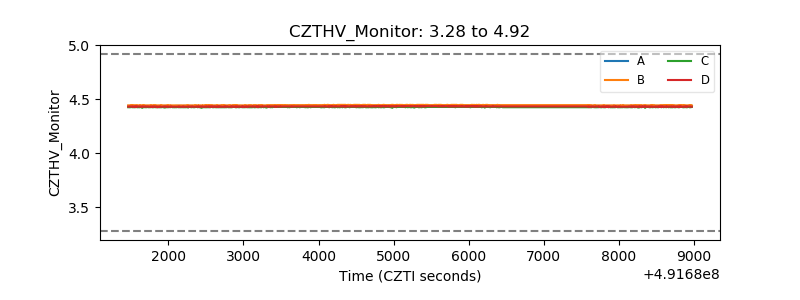 |
| D_VDD | 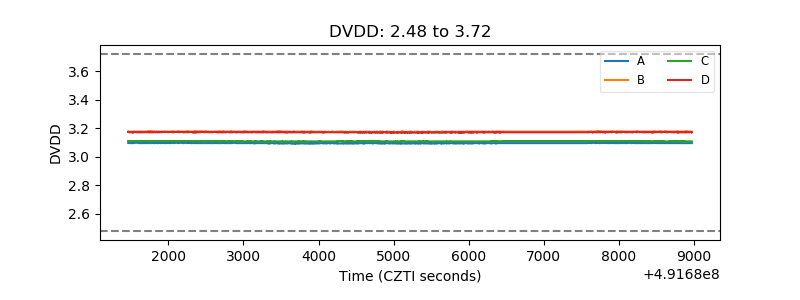 |
| Temperature 1 | 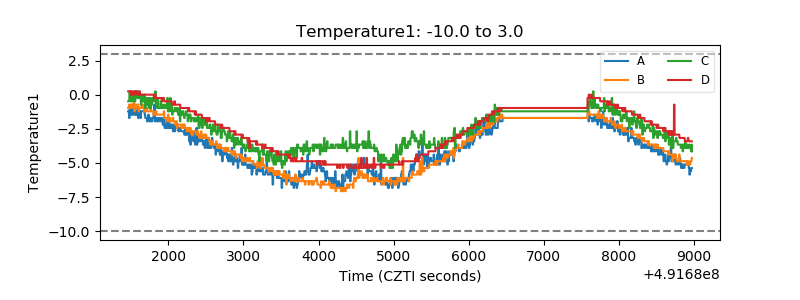 |
| Veto HV Monitor | 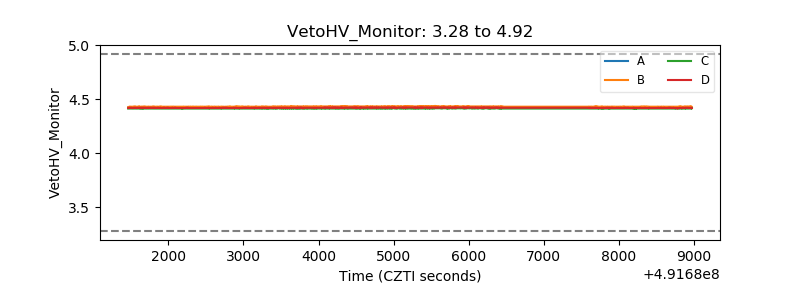 |
| Veto LLD | 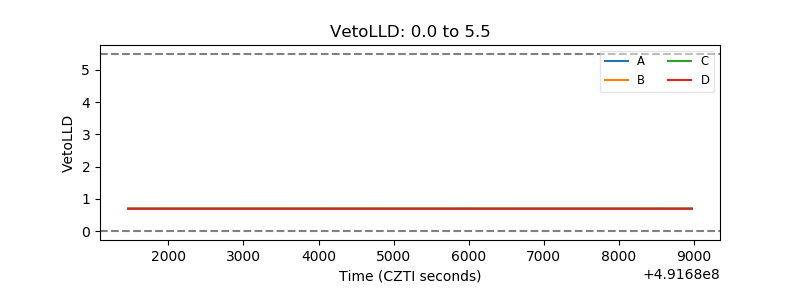 |
| Alpha Counter | 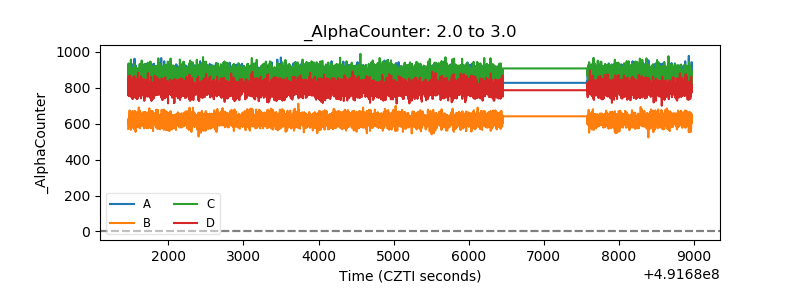 |
| _CPM_Rate | 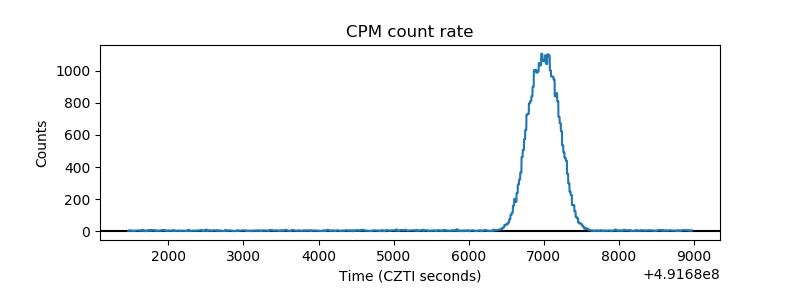 |
| CZT Counter | 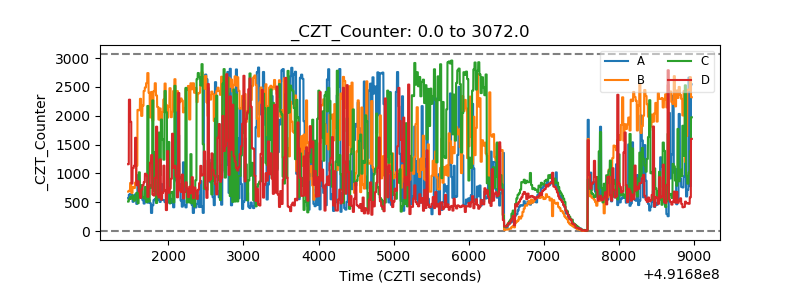 |
| +2.5 Volts monitor |  |
| +5 Volts monitor | 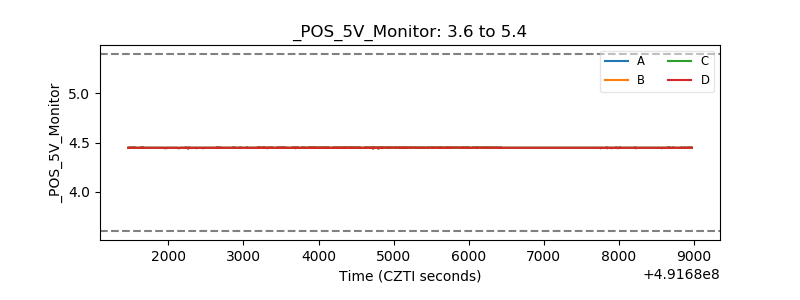 |
| _ROLL_ROT | 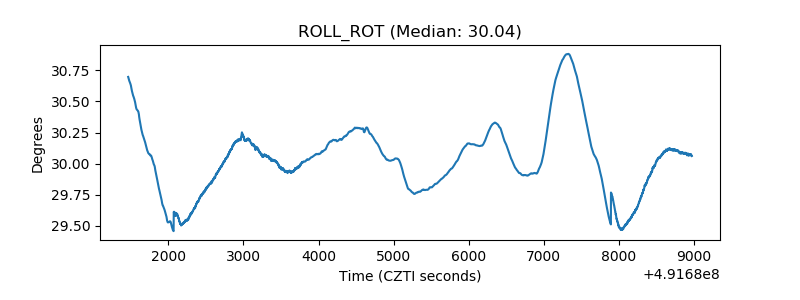 |
| _Roll_DEC | 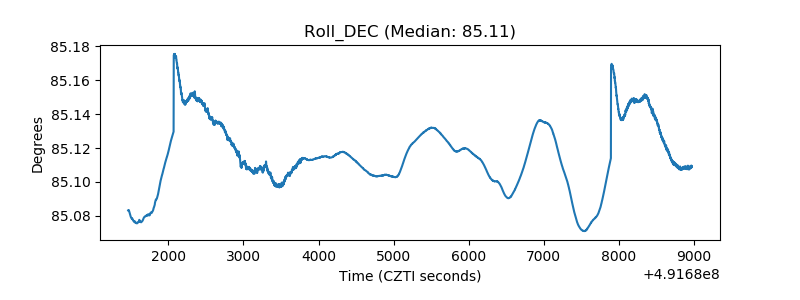 |
| _Roll_RA | 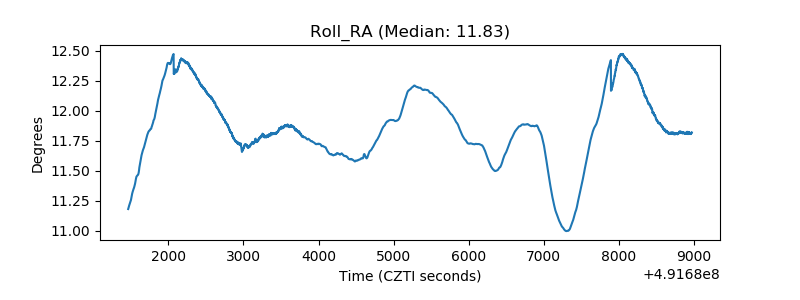 |
| Veto Counter | 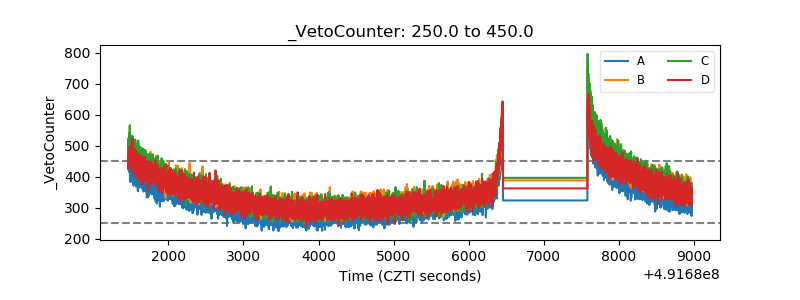 |