| Param | Original file | Final file |
|---|---|---|
| Filename | modeM0/AS1C09_011T06_9000006490_53237cztM0_level2.fits | modeM0/AS1C09_011T06_9000006490_53237cztM0_level2_quad_clean.evt |
| Size (bytes) | 801,008,640 | 83,966,400 |
| Size | 763.9 MB | 80.1 MB |
| Events in quadrant A | 6,716,232 | 549,985 |
| Events in quadrant B | 8,682,118 | 529,909 |
| Events in quadrant C | 9,254,757 | 447,726 |
| Events in quadrant D | 4,508,323 | 572,719 |
| Mode M9 | |||
|---|---|---|---|
| Quadrant | BADHDUFLAG | Total packets | Discarded packets |
| A | 0 | 15 | 0 |
| B | 0 | 16 | 0 |
| C | 0 | 16 | 0 |
| D | 0 | 16 | 0 |
| Mode SS | |||
|---|---|---|---|
| Quadrant | BADHDUFLAG | Total packets | Discarded packets |
| A | 0 | 128 | 0 |
| B | 0 | 128 | 0 |
| C | 0 | 128 | 0 |
| D | 0 | 128 | 0 |
| Mode M0 | |||
|---|---|---|---|
| Quadrant | BADHDUFLAG | Total packets | Discarded packets |
| A | 0 | 24281 | 8 |
| B | 0 | 30206 | 2 |
| C | 0 | 31911 | 2 |
| D | 0 | 17886 | 2 |
| Quadrant | Total seconds | Saturated seconds | Saturation percentage |
|---|---|---|---|
| A | 6334 | 1092 | 17.240290% |
| B | 6334 | 1716 | 27.091885% |
| C | 6334 | 1979 | 31.244080% |
| D | 6334 | 212 | 3.347016% |
Noise dominated data is calculated using 1-second bins in cleaned event files. If a bin has >2000 counts, and if more than 50% of those come from <1% of pixels, then it is considered to be noise-dominated and hence unusable.
| Quadrant | # 1 sec bins | Bins with >0 counts | Bins with >2000 counts | High rate bins dominated by noise | Noise dominated (total time) | Noise dominated (detector-on time) | Marked lightcurve |
|---|---|---|---|---|---|---|---|
| A | 7588 | 6334 | 1007 | 1007 | 13.27% | 15.90% | 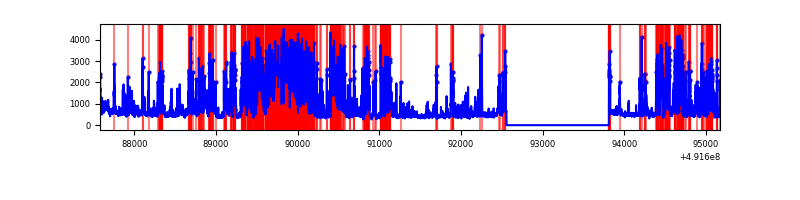 |
| B | 7589 | 6335 | 1357 | 1357 | 17.88% | 21.42% | 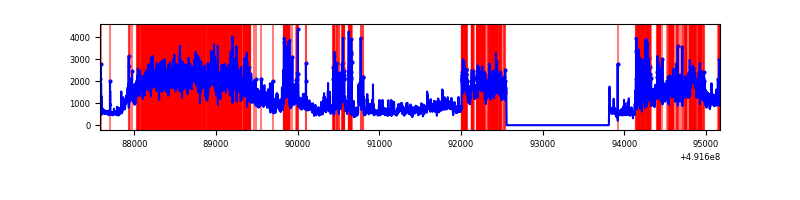 |
| C | 7589 | 6335 | 1759 | 1759 | 23.18% | 27.77% | 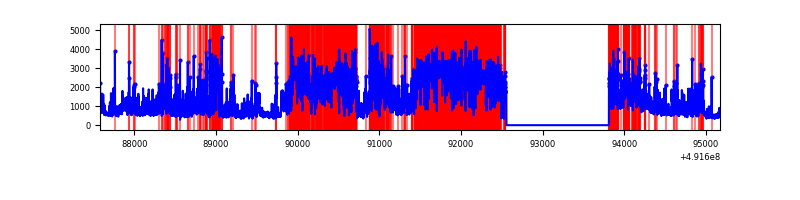 |
| D | 7588 | 6334 | 170 | 170 | 2.24% | 2.68% | 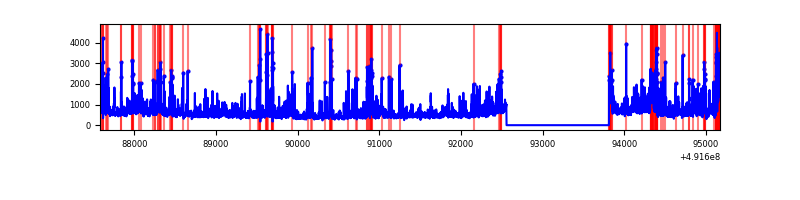 |
Top three noisy pixels from each quadrant. If the there are fewer than three noisy pixels in the level2.evt file, extra rows are filled as -1
| Pixel properties | Quadrant properties | ||||||
|---|---|---|---|---|---|---|---|
| Quadrant | DetID | PixID | Counts | Sigma | Mean | Median | Sigma |
| A | 3 | 62 | 2993734 | 18952.85 | 626 | 609 | 157.9 |
| A | 7 | 206 | 567141 | 3587.35 | 626 | 609 | 157.9 |
| A | 14 | 254 | 231333 | 1460.97 | 626 | 609 | 157.9 |
| B | 12 | 33 | 4695946 | 35446.4 | 626 | 604 | 132.5 |
| B | 4 | 170 | 556653 | 4197.76 | 626 | 604 | 132.5 |
| B | 2 | 249 | 266366 | 2006.31 | 626 | 604 | 132.5 |
| C | 1 | 241 | 4066302 | 25930.68 | 570 | 566 | 156.8 |
| C | 15 | 224 | 1208257 | 7702.48 | 570 | 566 | 156.8 |
| C | 9 | 38 | 943601 | 6014.54 | 570 | 566 | 156.8 |
| D | 11 | 245 | 530684 | 2853.08 | 650 | 621 | 185.8 |
| D | 15 | 125 | 323473 | 1737.76 | 650 | 621 | 185.8 |
| D | 6 | 239 | 231635 | 1243.44 | 650 | 621 | 185.8 |
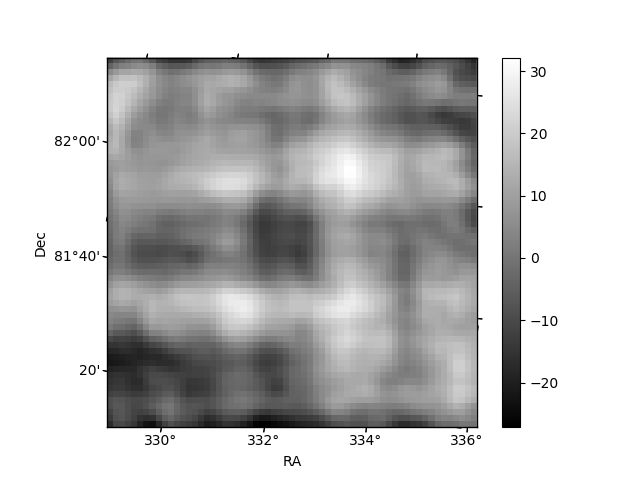
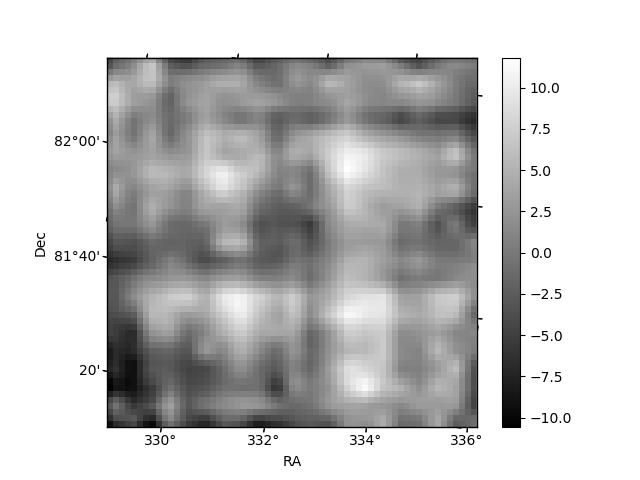
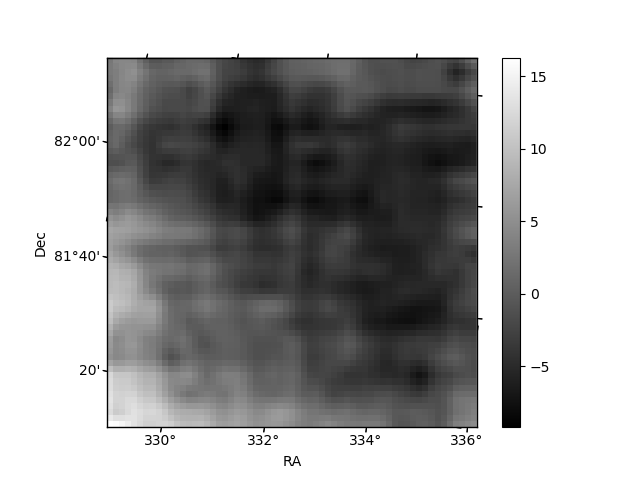
Histogram calculated using DETX and DETY for each event in the final _common_clean file
| Quadrant A | 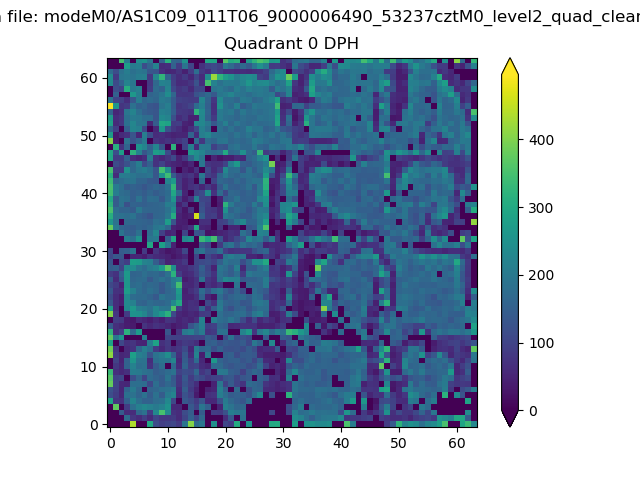 |
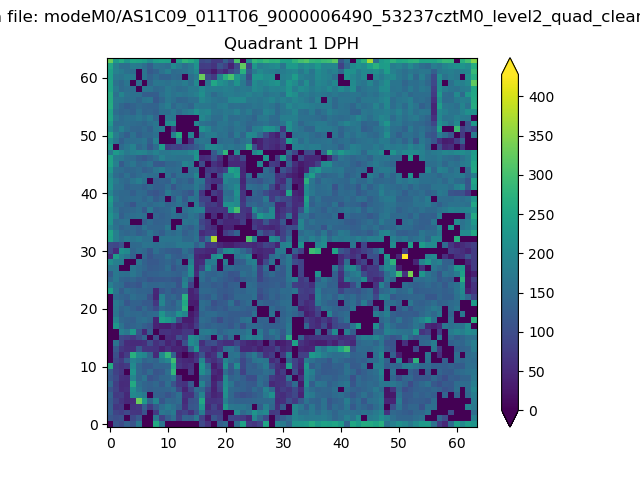 |
Quadrant B |
|---|---|---|---|
| Quadrant D | 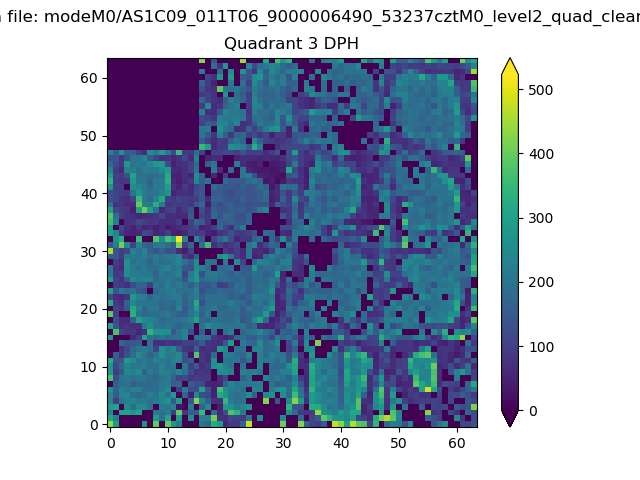 |
 |
Quadrant C |
| Plot type | Count rate plots | Images |
|---|---|---|
| Comparison with Poisson distribution Blue bars denote a histogram of data divided into 1 sec bins. Red curve is a Poisson curve with rate = median count rate of data. |
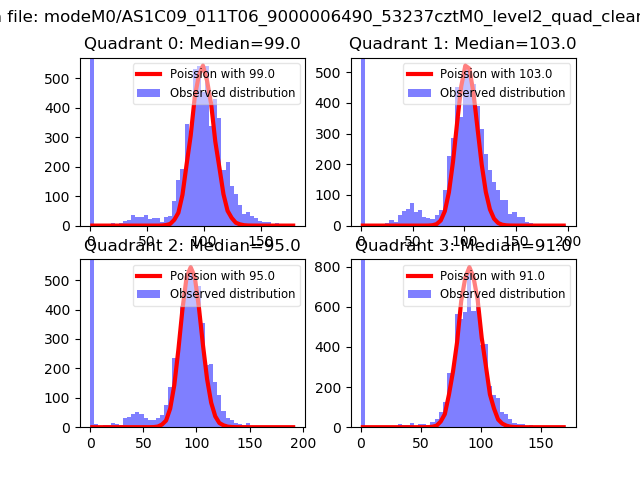 |
 |
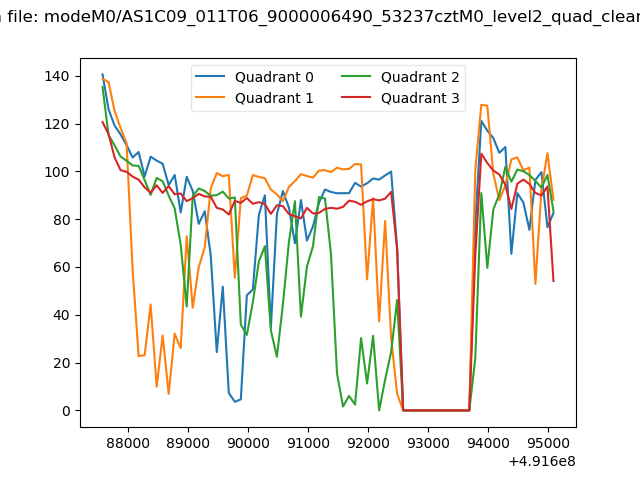
| Quadrant-wise count rates Data is divided into 100 sec bins |
 |
|
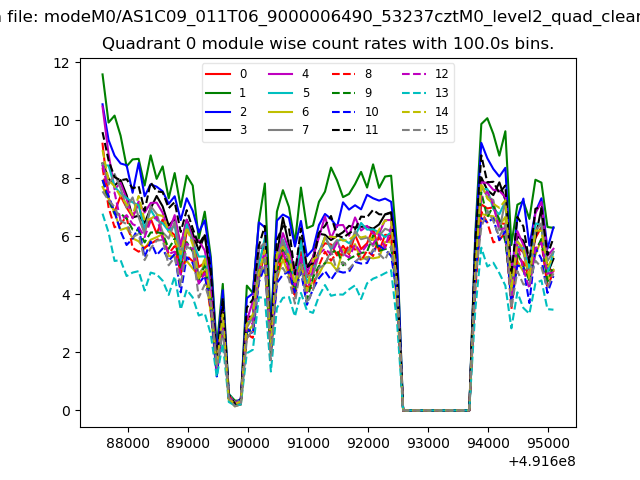
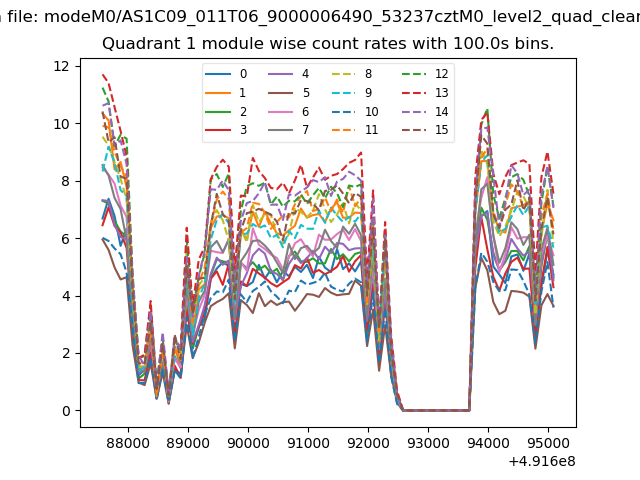
| Module-wise count rates for Quadrant A Data is divided into 100 sec bins |
 |
 |
| Module-wise count rates for Quadrant B Data is divided into 100 sec bins |
 |
 |
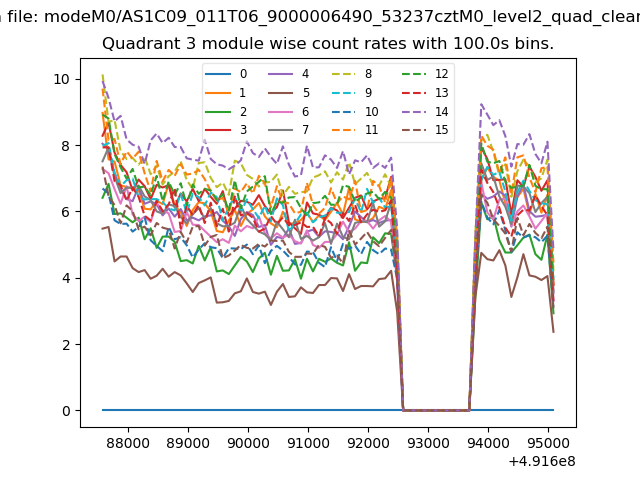
| Module-wise count rates for Quadrant C Data is divided into 100 sec bins |
 |
 |
| Module-wise count rates for Quadrant D Data is divided into 100 sec bins |
 |
 |
| Parameter | Plot |
|---|---|
| CZT HV Monitor | 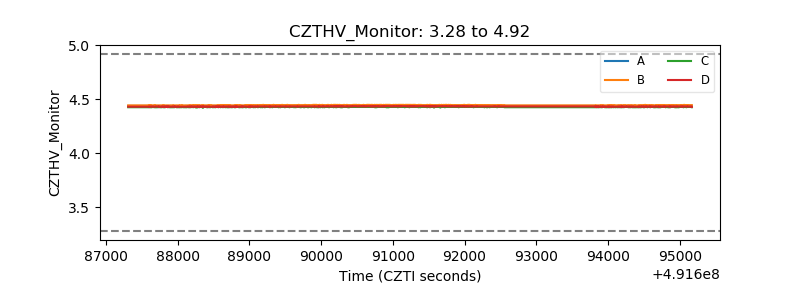 |
| D_VDD | 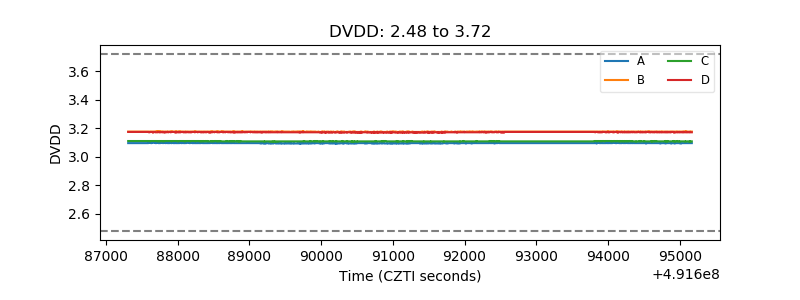 |
| Temperature 1 | 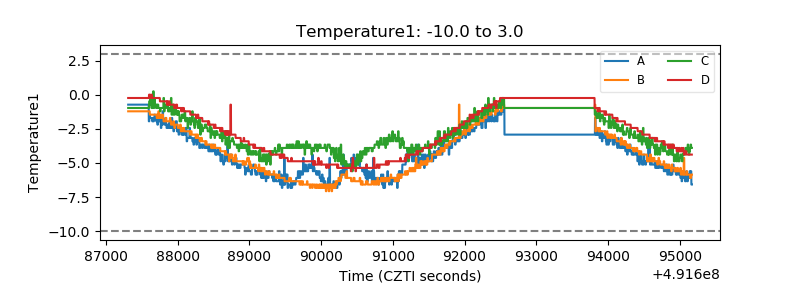 |
| Veto HV Monitor | 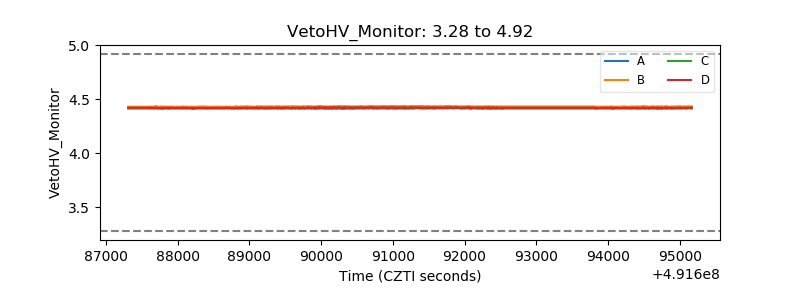 |
| Veto LLD | 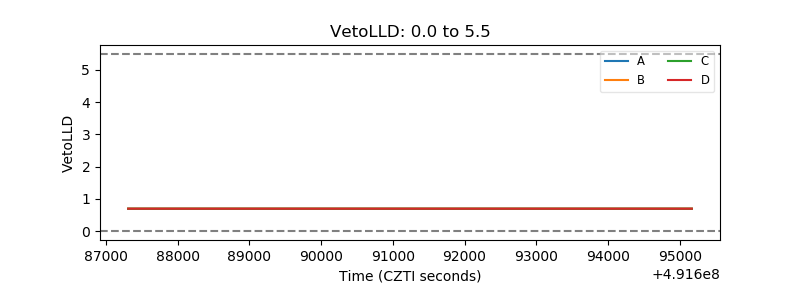 |
| Alpha Counter | 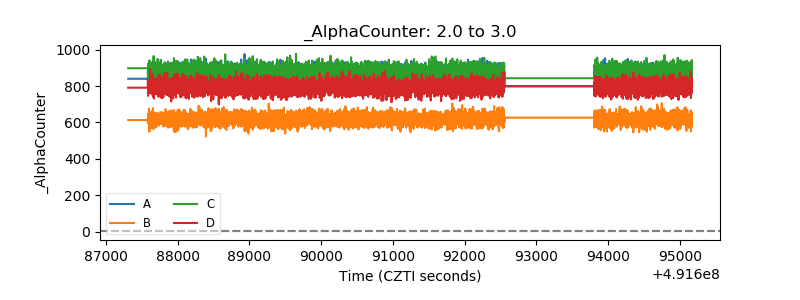 |
| _CPM_Rate | 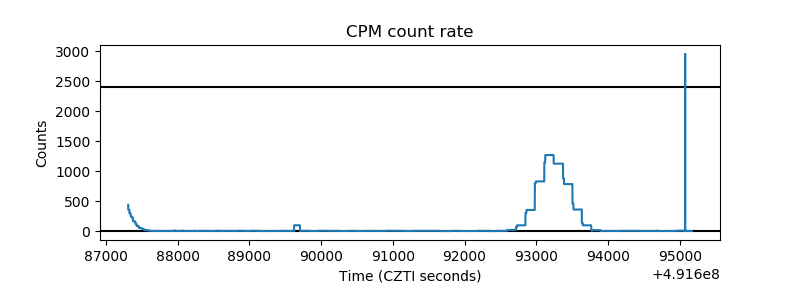 |
| CZT Counter | 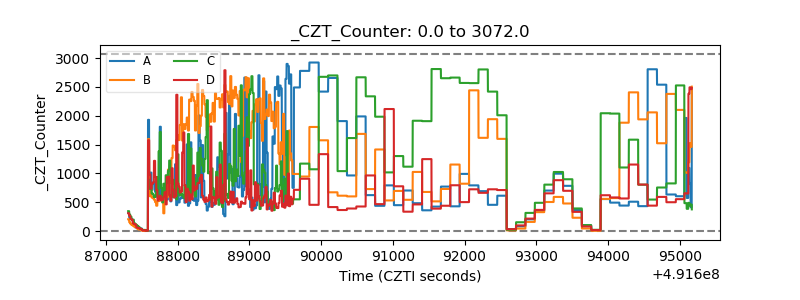 |
| +2.5 Volts monitor |  |
| +5 Volts monitor |  |
| _ROLL_ROT | 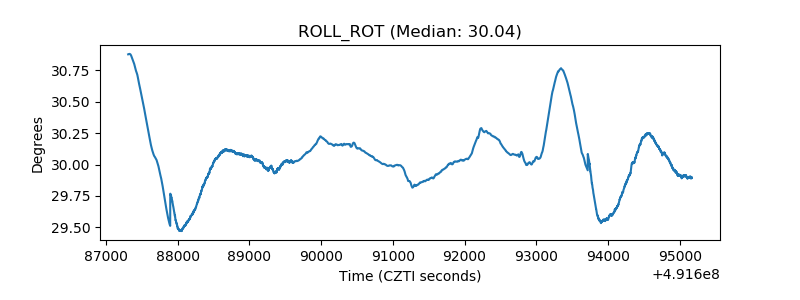 |
| _Roll_DEC | 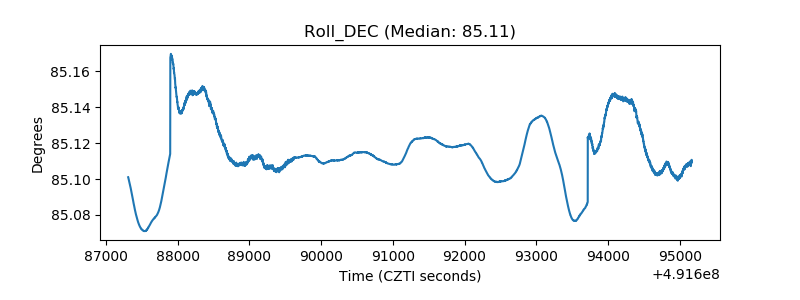 |
| _Roll_RA | 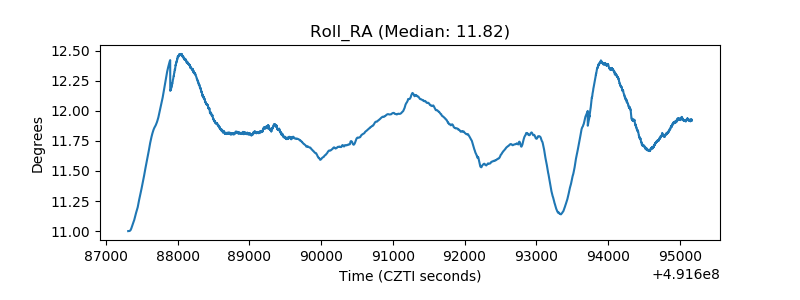 |
| Veto Counter | 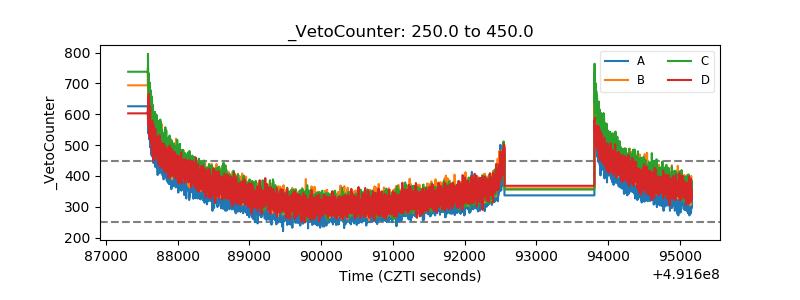 |