| Param | Original file | Final file |
|---|---|---|
| Filename | modeM0/AS1C09_011T06_9000006490_53238cztM0_level2.fits | modeM0/AS1C09_011T06_9000006490_53238cztM0_level2_quad_clean.evt |
| Size (bytes) | 703,324,800 | 86,970,240 |
| Size | 670.7 MB | 82.9 MB |
| Events in quadrant A | 5,209,430 | 579,858 |
| Events in quadrant B | 8,160,401 | 546,079 |
| Events in quadrant C | 6,588,936 | 548,929 |
| Events in quadrant D | 5,591,035 | 520,875 |
| Mode M9 | |||
|---|---|---|---|
| Quadrant | BADHDUFLAG | Total packets | Discarded packets |
| A | 0 | 16 | 0 |
| B | 0 | 17 | 0 |
| C | 0 | 17 | 0 |
| D | 0 | 17 | 0 |
| Mode SS | |||
|---|---|---|---|
| Quadrant | BADHDUFLAG | Total packets | Discarded packets |
| A | 0 | 126 | 0 |
| B | 0 | 126 | 0 |
| C | 0 | 126 | 0 |
| D | 0 | 126 | 0 |
| Mode M0 | |||
|---|---|---|---|
| Quadrant | BADHDUFLAG | Total packets | Discarded packets |
| A | 0 | 19833 | 4 |
| B | 0 | 28537 | 2 |
| C | 0 | 23950 | 2 |
| D | 0 | 21123 | 2 |
| Quadrant | Total seconds | Saturated seconds | Saturation percentage |
|---|---|---|---|
| A | 6272 | 610 | 9.725765% |
| B | 6272 | 1484 | 23.660714% |
| C | 6272 | 784 | 12.500000% |
| D | 6272 | 702 | 11.192602% |
Noise dominated data is calculated using 1-second bins in cleaned event files. If a bin has >2000 counts, and if more than 50% of those come from <1% of pixels, then it is considered to be noise-dominated and hence unusable.
| Quadrant | # 1 sec bins | Bins with >0 counts | Bins with >2000 counts | High rate bins dominated by noise | Noise dominated (total time) | Noise dominated (detector-on time) | Marked lightcurve |
|---|---|---|---|---|---|---|---|
| A | 7527 | 6273 | 560 | 560 | 7.44% | 8.93% | 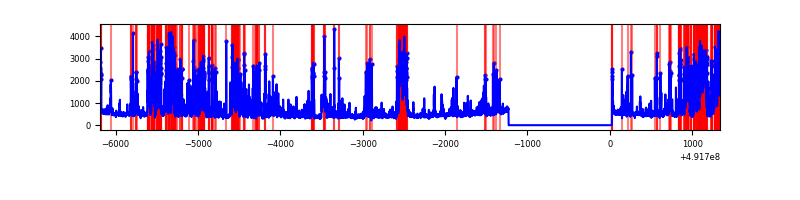 |
| B | 7527 | 6272 | 1111 | 1111 | 14.76% | 17.71% | 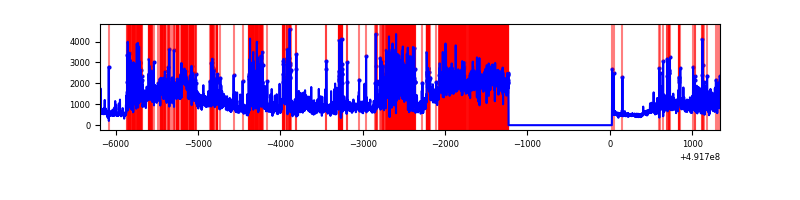 |
| C | 7527 | 6273 | 635 | 635 | 8.44% | 10.12% | 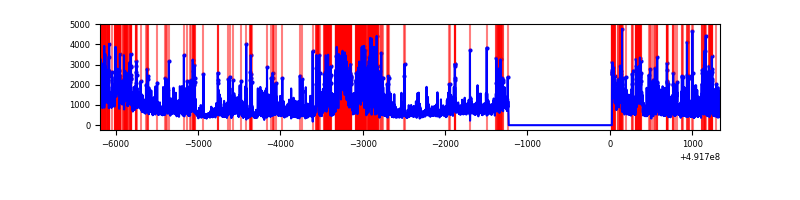 |
| D | 7527 | 6273 | 605 | 605 | 8.04% | 9.64% | 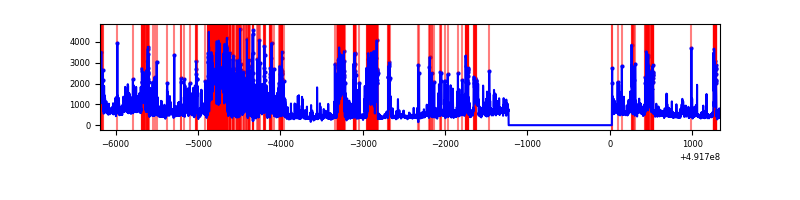 |
Top three noisy pixels from each quadrant. If the there are fewer than three noisy pixels in the level2.evt file, extra rows are filled as -1
| Pixel properties | Quadrant properties | ||||||
|---|---|---|---|---|---|---|---|
| Quadrant | DetID | PixID | Counts | Sigma | Mean | Median | Sigma |
| A | 3 | 62 | 1772793 | 11175.69 | 634 | 618 | 158.6 |
| A | 14 | 254 | 474728 | 2989.83 | 634 | 618 | 158.6 |
| A | 7 | 206 | 252780 | 1590.18 | 634 | 618 | 158.6 |
| B | 12 | 33 | 3812636 | 30159.63 | 605 | 587 | 126.4 |
| B | 2 | 249 | 932901 | 7376.15 | 605 | 587 | 126.4 |
| B | 4 | 81 | 266649 | 2104.99 | 605 | 587 | 126.4 |
| C | 15 | 224 | 1295102 | 7522.28 | 620 | 612 | 172.1 |
| C | 9 | 38 | 971277 | 5640.54 | 620 | 612 | 172.1 |
| C | 1 | 241 | 778589 | 4520.83 | 620 | 612 | 172.1 |
| D | 6 | 239 | 987663 | 5661.89 | 610 | 584 | 174.3 |
| D | 12 | 3 | 772040 | 4425.07 | 610 | 584 | 174.3 |
| D | 15 | 125 | 350557 | 2007.44 | 610 | 584 | 174.3 |
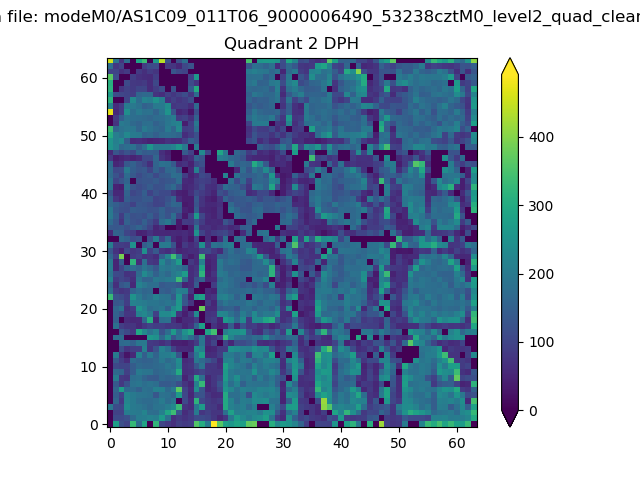
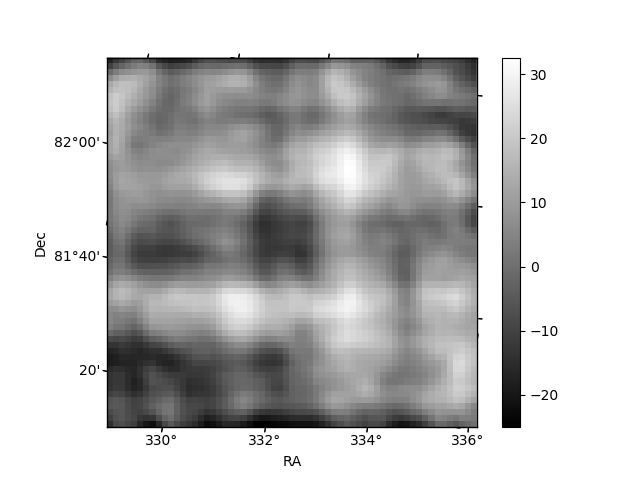
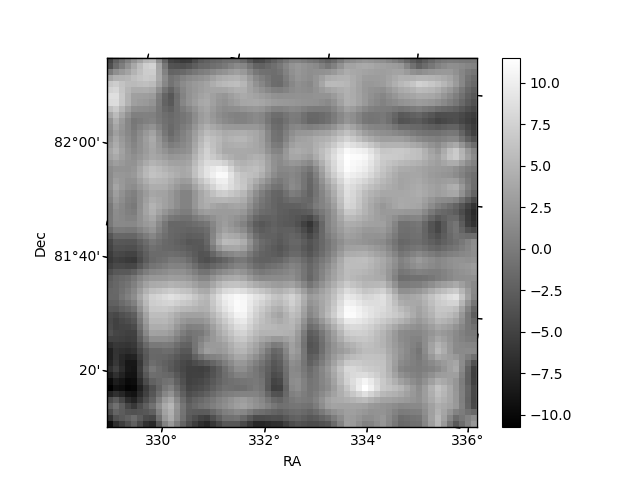
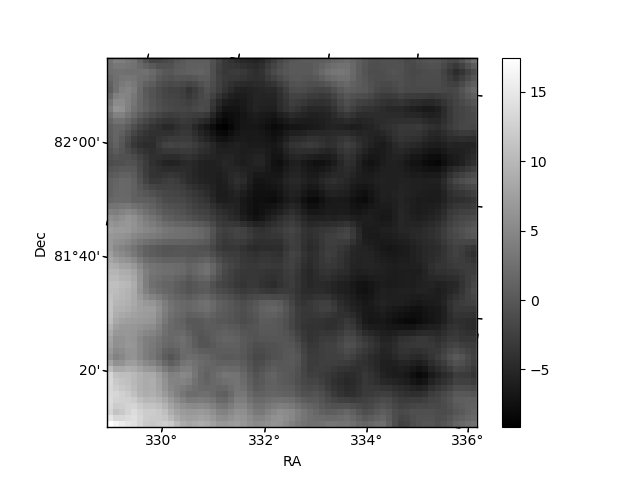
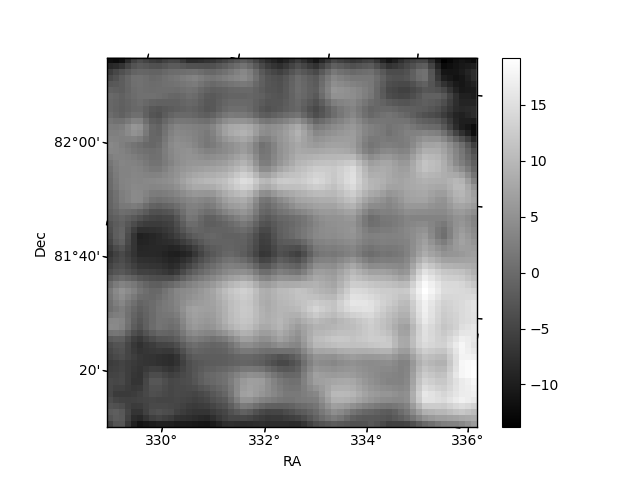
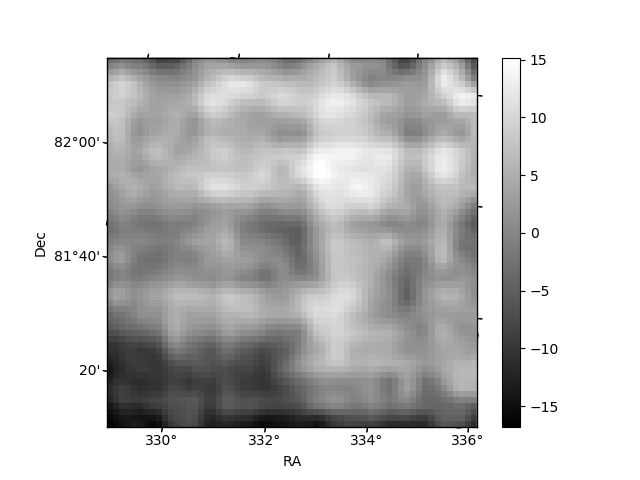
Histogram calculated using DETX and DETY for each event in the final _common_clean file
| Quadrant A | 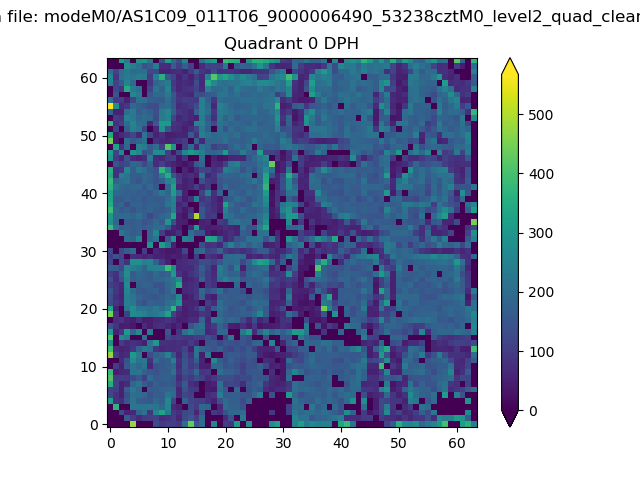 |
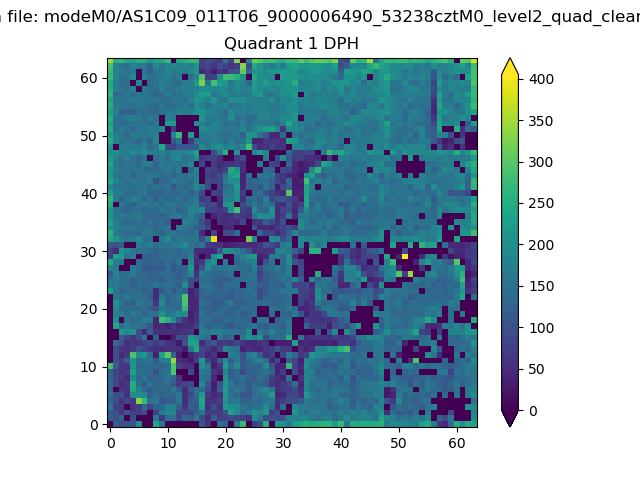 |
Quadrant B |
|---|---|---|---|
| Quadrant D | 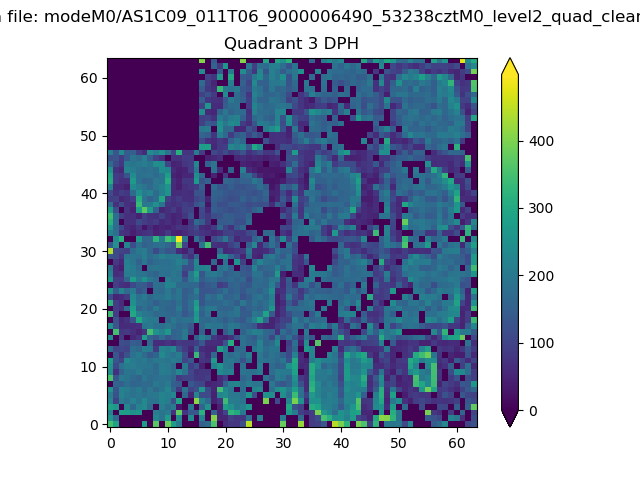 |
 |
Quadrant C |
| Plot type | Count rate plots | Images |
|---|---|---|
| Comparison with Poisson distribution Blue bars denote a histogram of data divided into 1 sec bins. Red curve is a Poisson curve with rate = median count rate of data. |
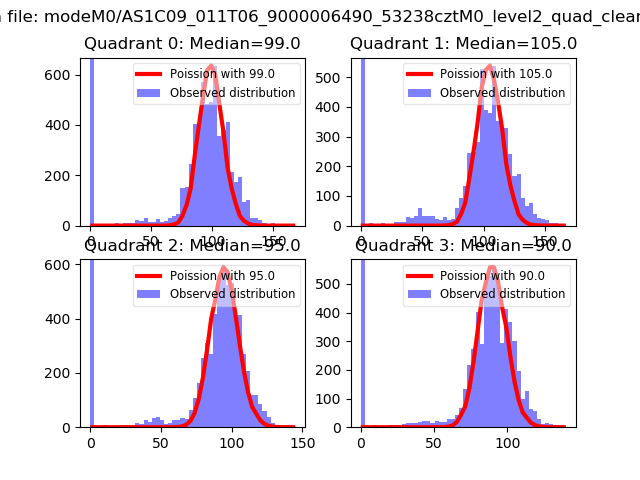 |
 |
| Quadrant-wise count rates Data is divided into 100 sec bins |
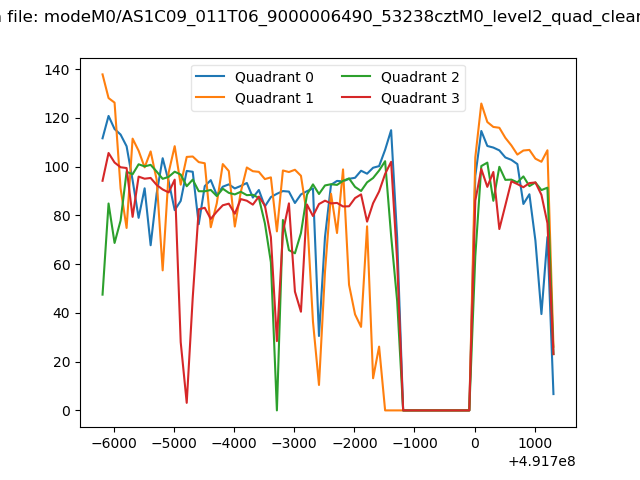 |
|
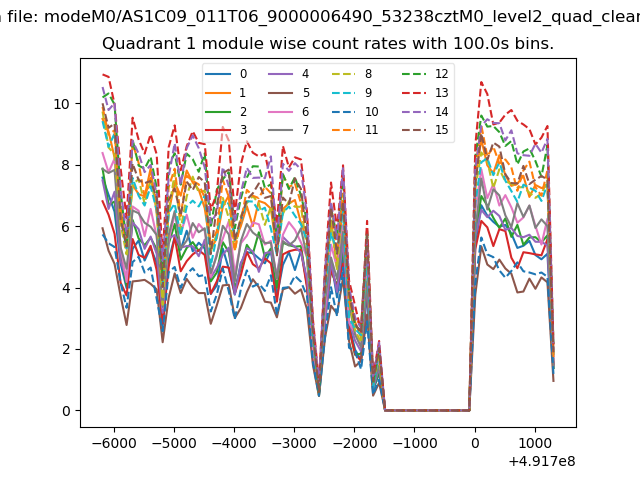
| Module-wise count rates for Quadrant A Data is divided into 100 sec bins |
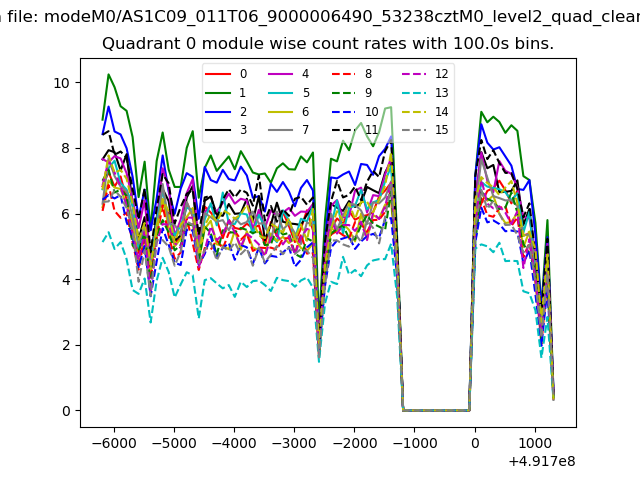 |
 |
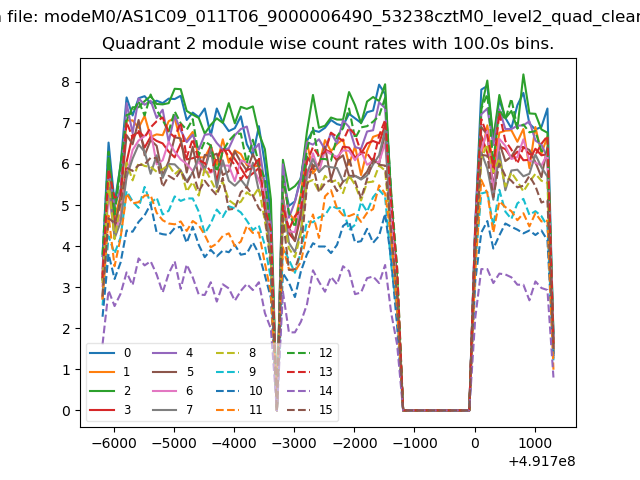
| Module-wise count rates for Quadrant B Data is divided into 100 sec bins |
 |
 |
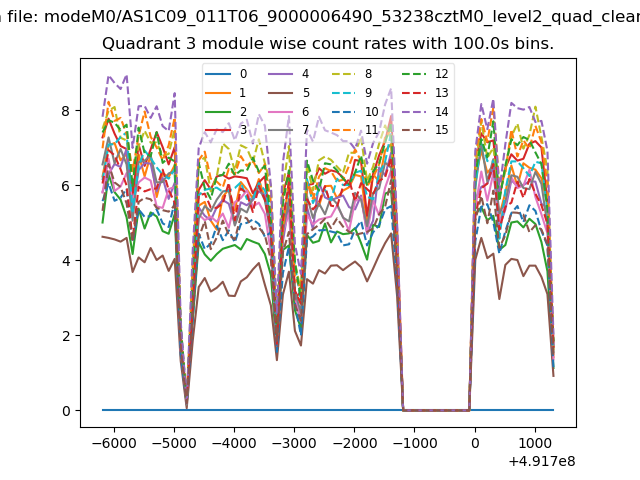
| Module-wise count rates for Quadrant C Data is divided into 100 sec bins |
 |
 |
| Module-wise count rates for Quadrant D Data is divided into 100 sec bins |
 |
 |
| Parameter | Plot |
|---|---|
| CZT HV Monitor | 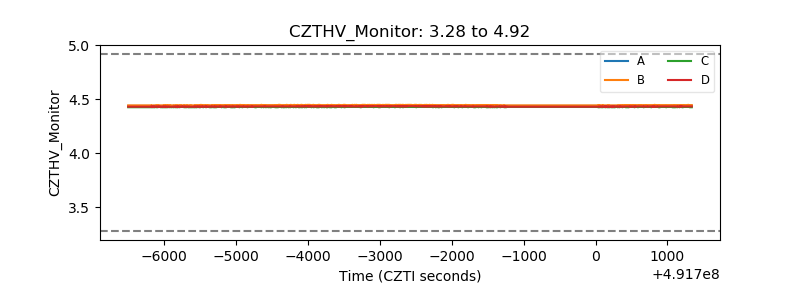 |
| D_VDD | 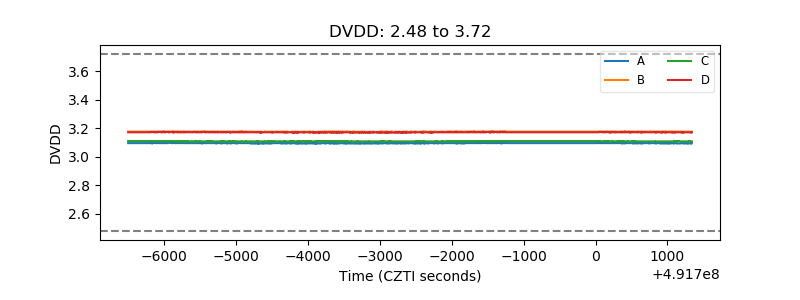 |
| Temperature 1 | 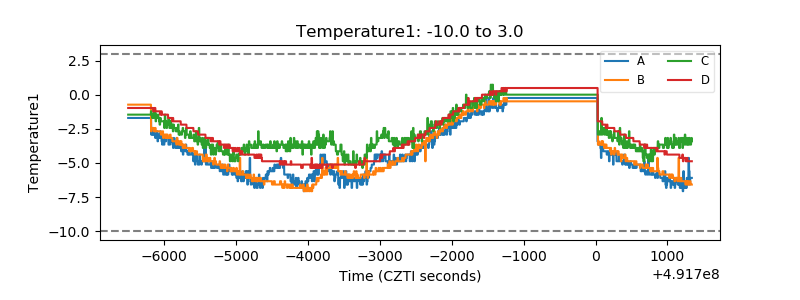 |
| Veto HV Monitor | 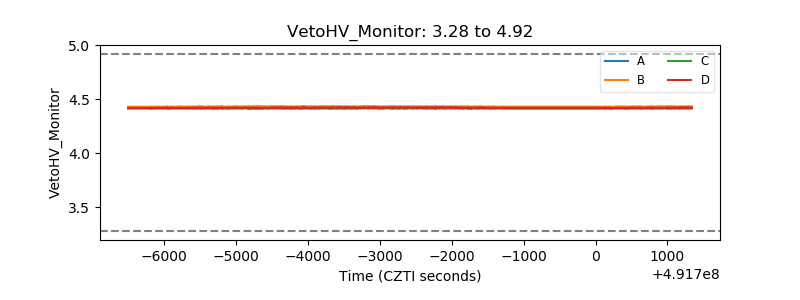 |
| Veto LLD | 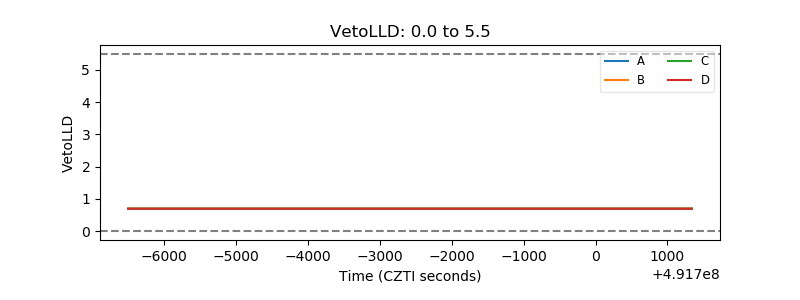 |
| Alpha Counter | 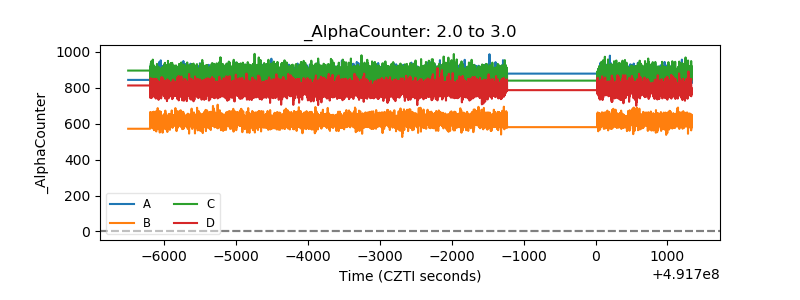 |
| _CPM_Rate | 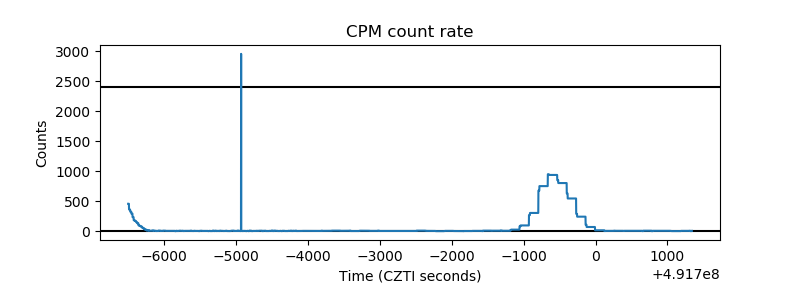 |
| CZT Counter | 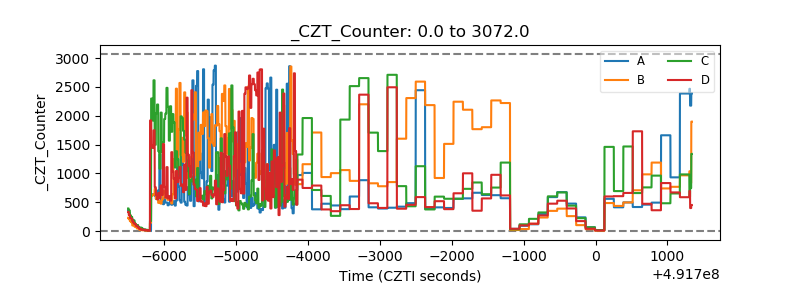 |
| +2.5 Volts monitor | 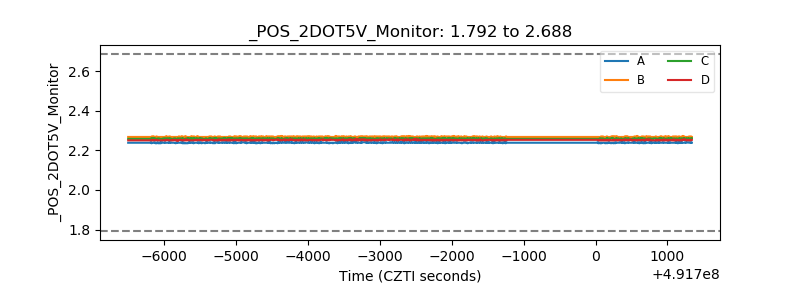 |
| +5 Volts monitor | 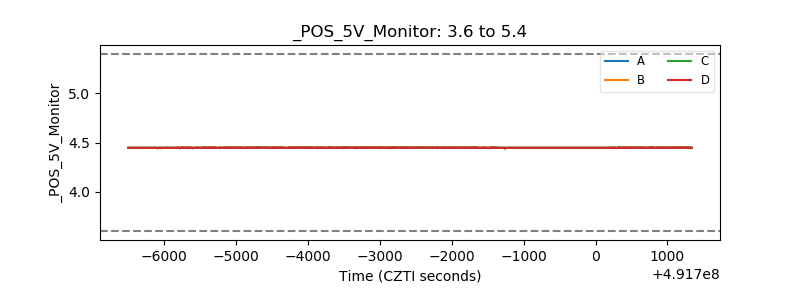 |
| _ROLL_ROT | 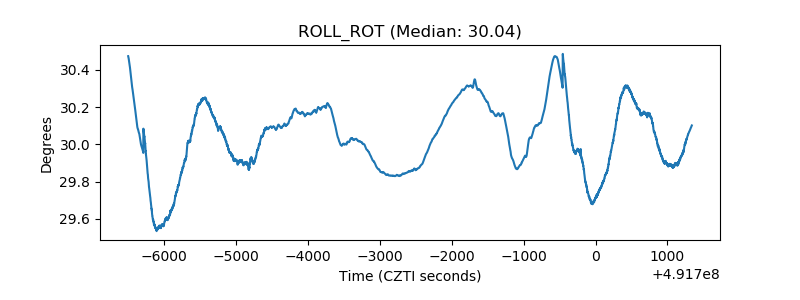 |
| _Roll_DEC | 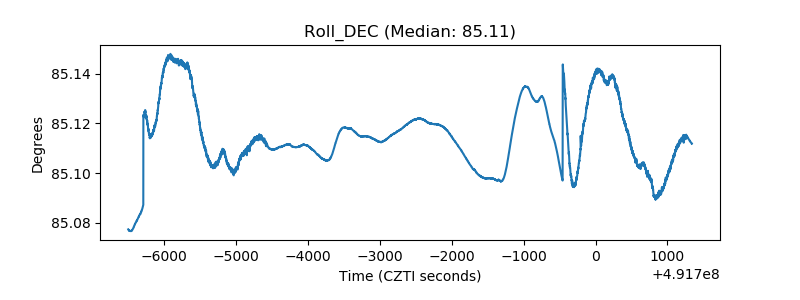 |
| _Roll_RA | 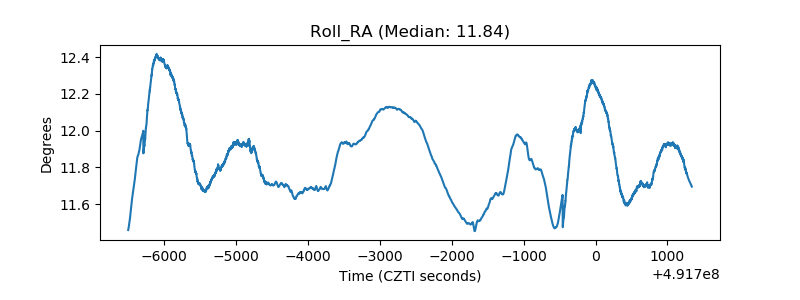 |
| Veto Counter | 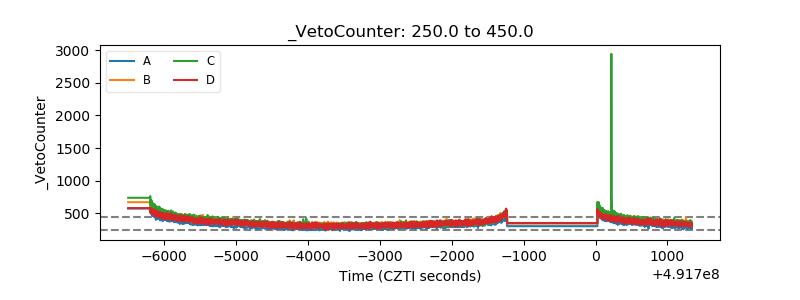 |