| Param | Original file | Final file |
|---|---|---|
| Filename | modeM0/AS1C09_011T06_9000006490_53239cztM0_level2.fits | modeM0/AS1C09_011T06_9000006490_53239cztM0_level2_quad_clean.evt |
| Size (bytes) | 621,443,520 | 63,947,520 |
| Size | 592.7 MB | 61.0 MB |
| Events in quadrant A | 6,203,002 | 379,604 |
| Events in quadrant B | 5,190,773 | 460,480 |
| Events in quadrant C | 7,435,725 | 314,845 |
| Events in quadrant D | 3,787,869 | 431,512 |
| Mode M9 | |||
|---|---|---|---|
| Quadrant | BADHDUFLAG | Total packets | Discarded packets |
| A | 0 | 18 | 0 |
| B | 0 | 19 | 0 |
| C | 0 | 19 | 0 |
| D | 0 | 19 | 0 |
| Mode SS | |||
|---|---|---|---|
| Quadrant | BADHDUFLAG | Total packets | Discarded packets |
| A | 0 | 102 | 0 |
| B | 0 | 102 | 0 |
| C | 0 | 102 | 0 |
| D | 0 | 102 | 0 |
| Mode M0 | |||
|---|---|---|---|
| Quadrant | BADHDUFLAG | Total packets | Discarded packets |
| A | 0 | 21893 | 1 |
| B | 0 | 18802 | 1 |
| C | 0 | 25590 | 1 |
| D | 0 | 14815 | 1 |
| Quadrant | Total seconds | Saturated seconds | Saturation percentage |
|---|---|---|---|
| A | 4990 | 1328 | 26.613226% |
| B | 4990 | 748 | 14.989980% |
| C | 4990 | 1810 | 36.272545% |
| D | 4990 | 216 | 4.328657% |
Noise dominated data is calculated using 1-second bins in cleaned event files. If a bin has >2000 counts, and if more than 50% of those come from <1% of pixels, then it is considered to be noise-dominated and hence unusable.
| Quadrant | # 1 sec bins | Bins with >0 counts | Bins with >2000 counts | High rate bins dominated by noise | Noise dominated (total time) | Noise dominated (detector-on time) | Marked lightcurve |
|---|---|---|---|---|---|---|---|
| A | 5005 | 4991 | 1124 | 1124 | 22.46% | 22.52% | 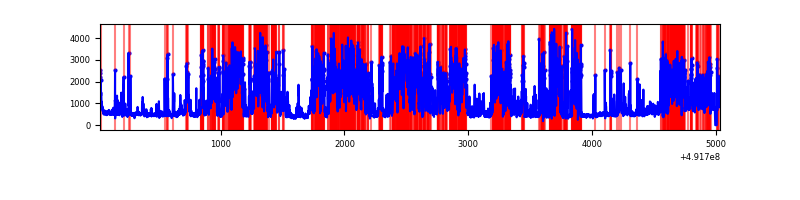 |
| B | 5005 | 4991 | 500 | 500 | 9.99% | 10.02% | 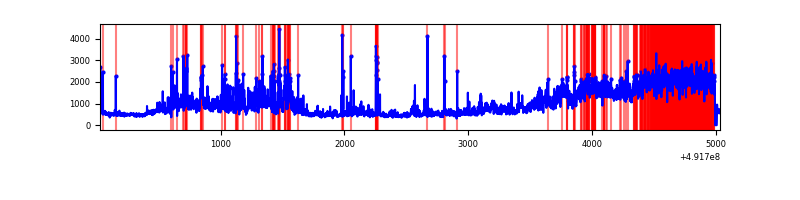 |
| C | 5004 | 4989 | 1658 | 1658 | 33.13% | 33.23% | 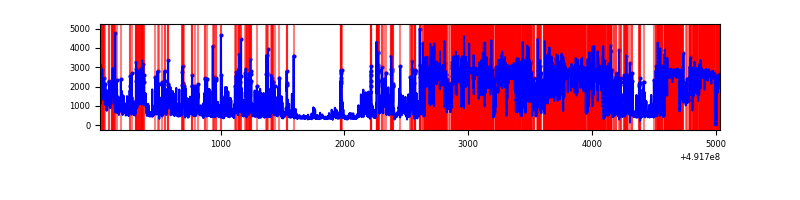 |
| D | 5005 | 4991 | 202 | 202 | 4.04% | 4.05% | 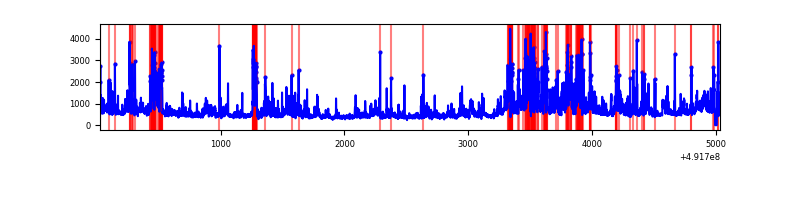 |
Top three noisy pixels from each quadrant. If the there are fewer than three noisy pixels in the level2.evt file, extra rows are filled as -1
| Pixel properties | Quadrant properties | ||||||
|---|---|---|---|---|---|---|---|
| Quadrant | DetID | PixID | Counts | Sigma | Mean | Median | Sigma |
| A | 3 | 62 | 2587438 | 22583.1 | 456 | 446 | 114.6 |
| A | 0 | 8 | 783538 | 6835.99 | 456 | 446 | 114.6 |
| A | 14 | 254 | 394268 | 3437.86 | 456 | 446 | 114.6 |
| B | 12 | 33 | 2381214 | 23013.12 | 489 | 473 | 103.5 |
| B | 4 | 81 | 247173 | 2384.69 | 489 | 473 | 103.5 |
| B | 10 | 254 | 186483 | 1798.04 | 489 | 473 | 103.5 |
| C | 1 | 241 | 2560280 | 22589.93 | 408 | 404 | 113.3 |
| C | 15 | 224 | 1110556 | 9796.67 | 408 | 404 | 113.3 |
| C | 9 | 38 | 906818 | 7998.76 | 408 | 404 | 113.3 |
| D | 11 | 245 | 665057 | 4709.37 | 490 | 467 | 141.1 |
| D | 3 | 12 | 324771 | 2298.06 | 490 | 467 | 141.1 |
| D | 2 | 120 | 227060 | 1605.67 | 490 | 467 | 141.1 |
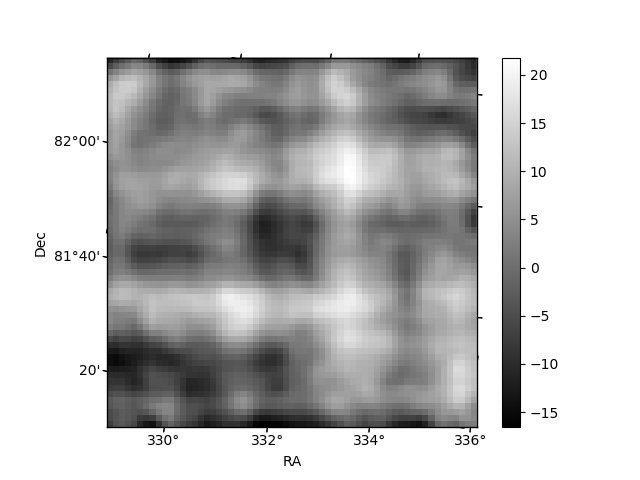
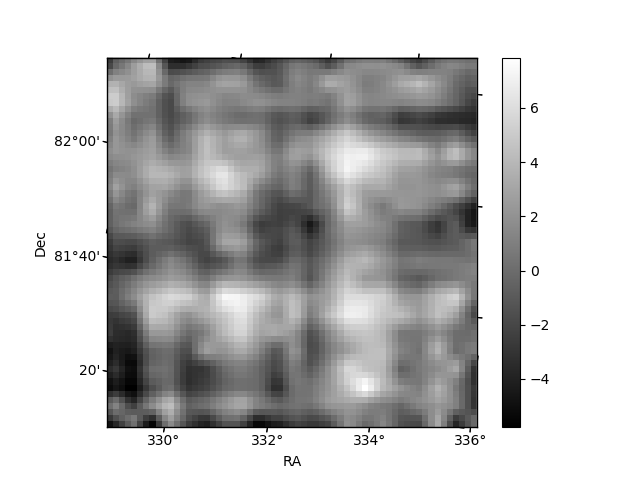
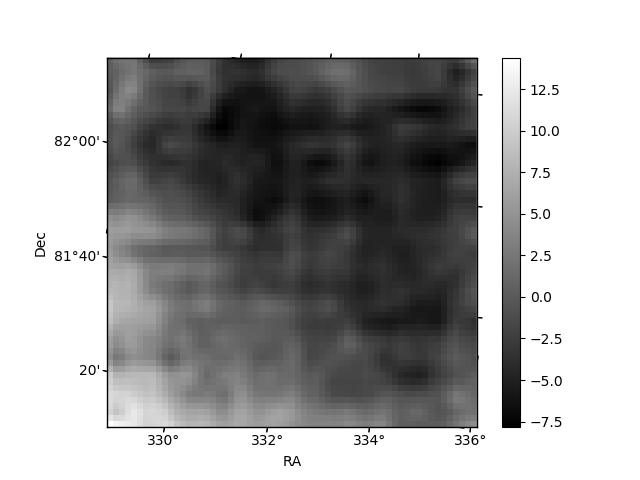
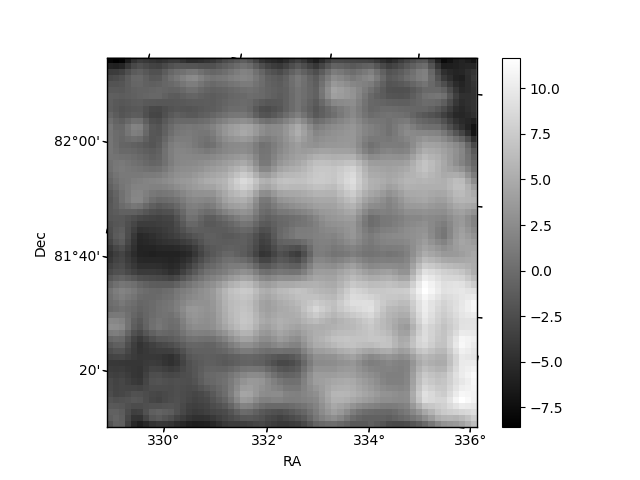
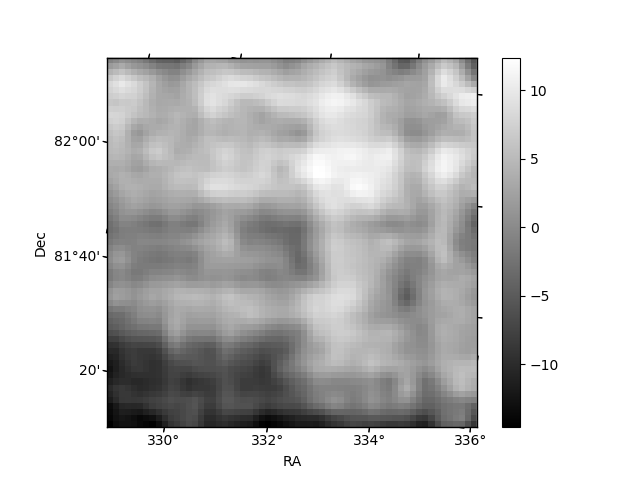
Histogram calculated using DETX and DETY for each event in the final _common_clean file
| Quadrant A | 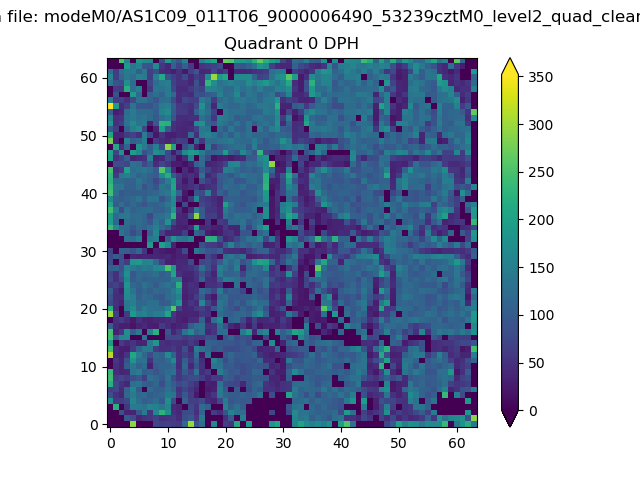 |
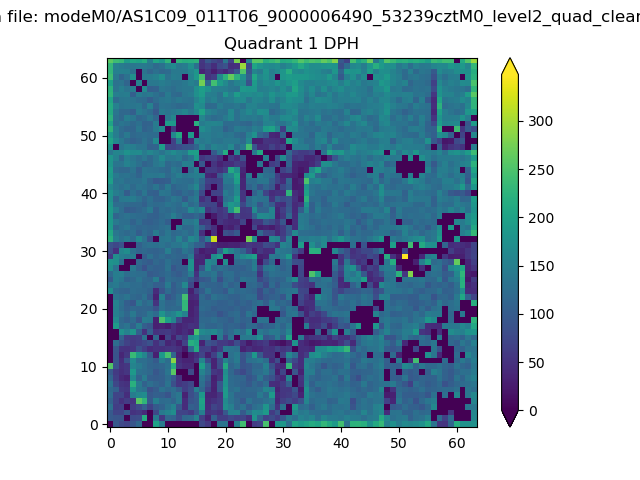 |
Quadrant B |
|---|---|---|---|
| Quadrant D | 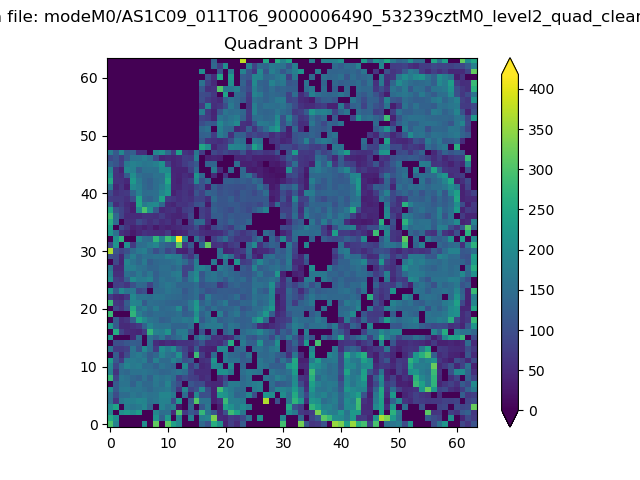 |
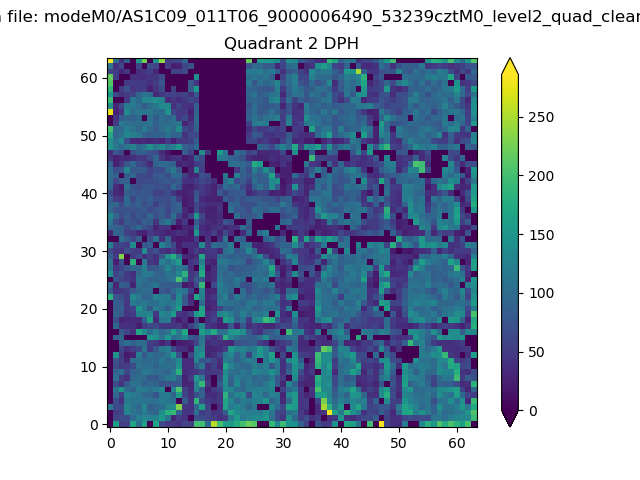 |
Quadrant C |
| Plot type | Count rate plots | Images |
|---|---|---|
| Comparison with Poisson distribution Blue bars denote a histogram of data divided into 1 sec bins. Red curve is a Poisson curve with rate = median count rate of data. |
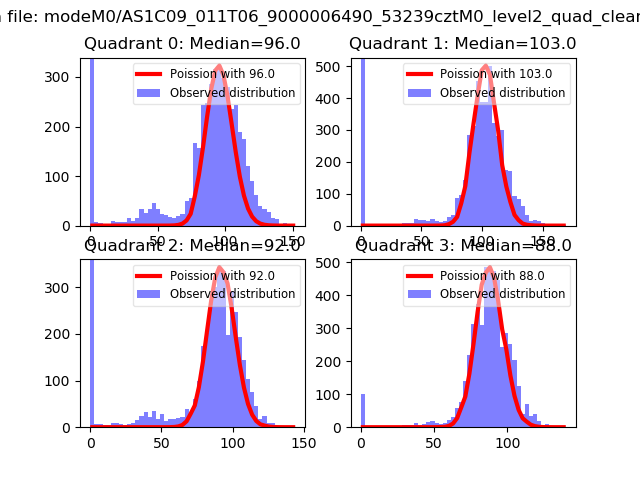 |
 |
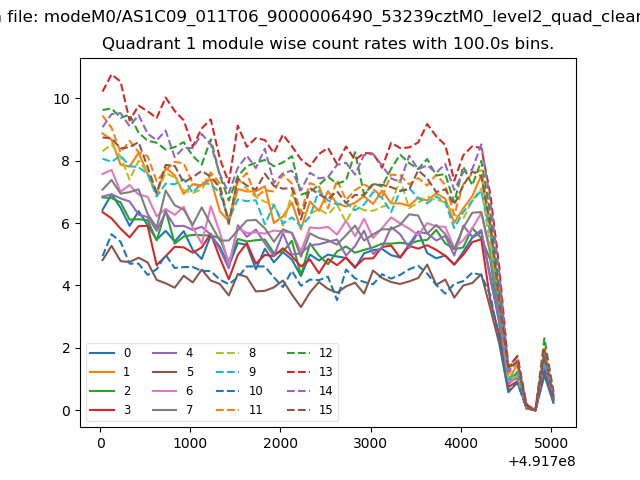
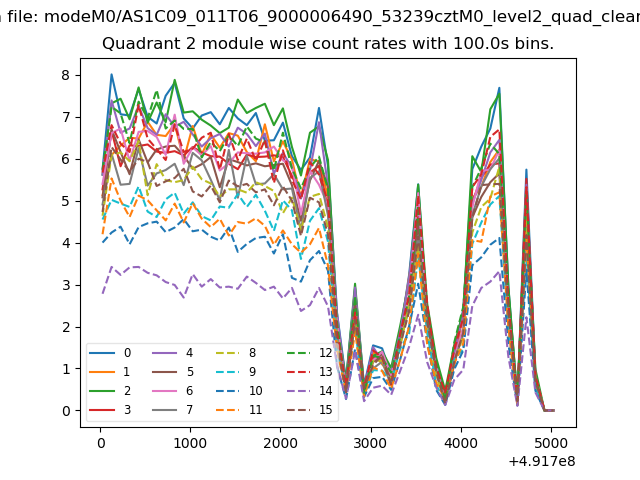
| Quadrant-wise count rates Data is divided into 100 sec bins |
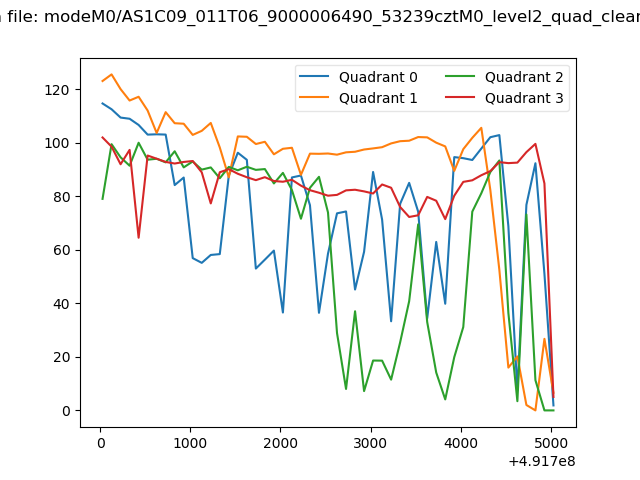 |
|
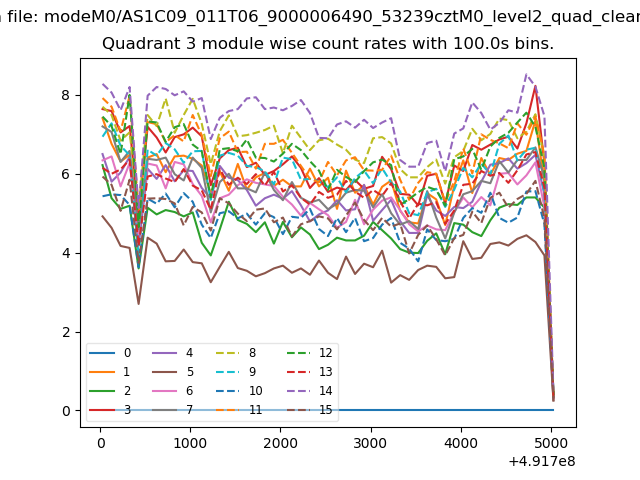
| Module-wise count rates for Quadrant A Data is divided into 100 sec bins |
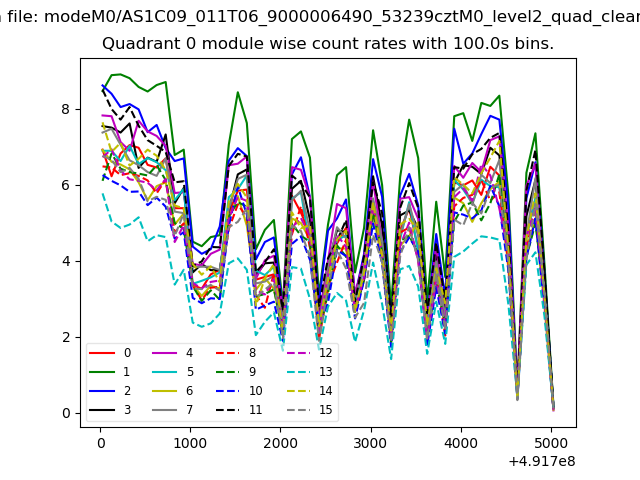 |
 |
| Module-wise count rates for Quadrant B Data is divided into 100 sec bins |
 |
 |
| Module-wise count rates for Quadrant C Data is divided into 100 sec bins |
 |
 |
| Module-wise count rates for Quadrant D Data is divided into 100 sec bins |
 |
 |
| Parameter | Plot |
|---|---|
| CZT HV Monitor | 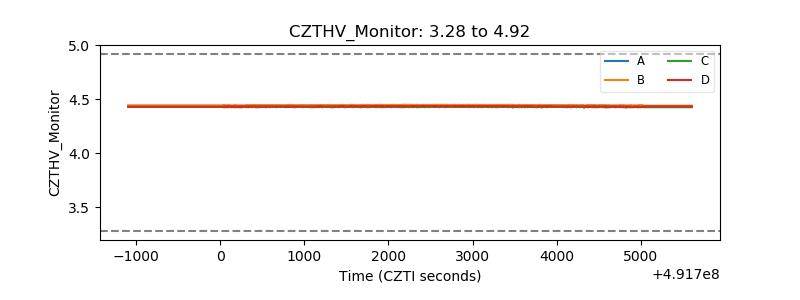 |
| D_VDD | 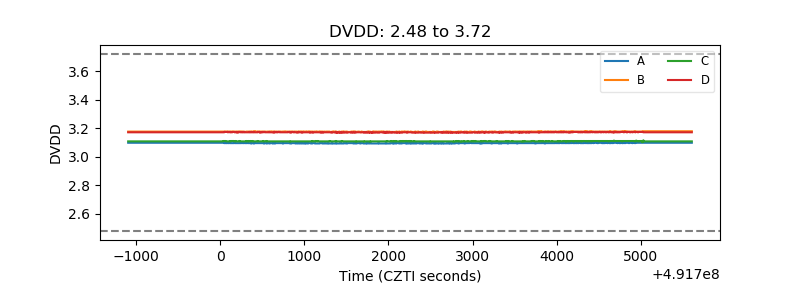 |
| Temperature 1 | 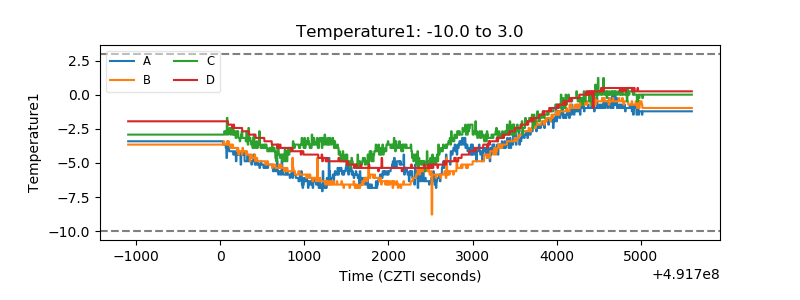 |
| Veto HV Monitor | 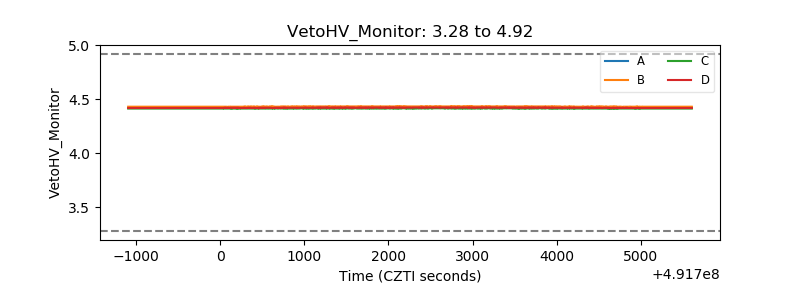 |
| Veto LLD | 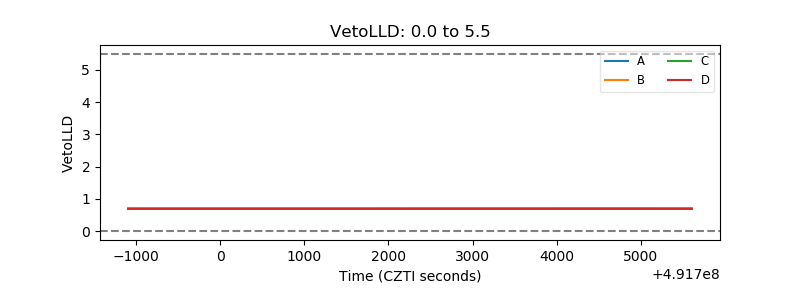 |
| Alpha Counter | 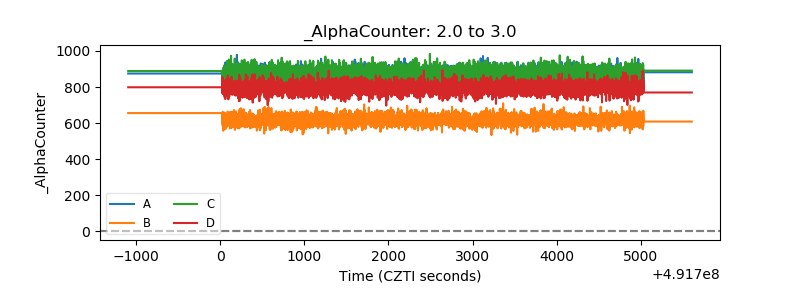 |
| _CPM_Rate | 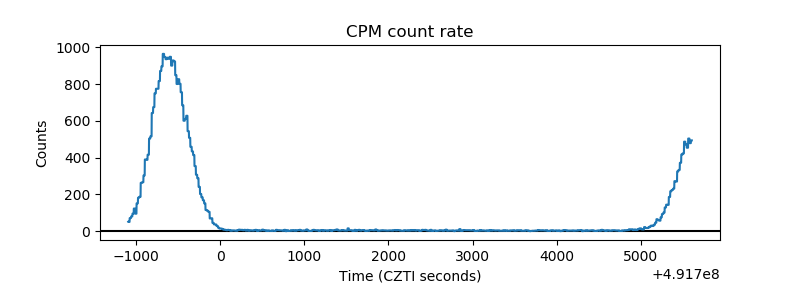 |
| CZT Counter | 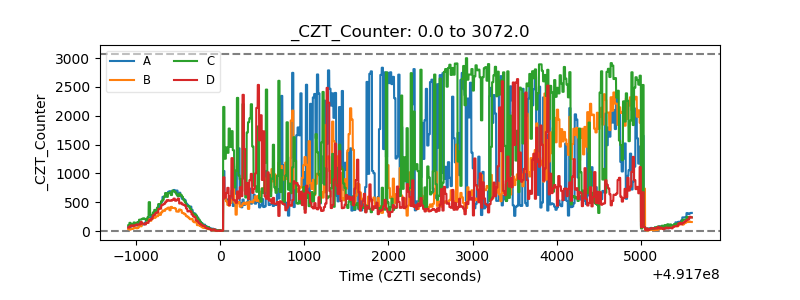 |
| +2.5 Volts monitor |  |
| +5 Volts monitor |  |
| _ROLL_ROT | 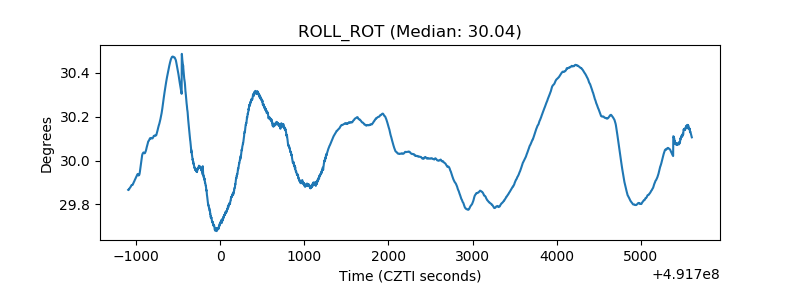 |
| _Roll_DEC | 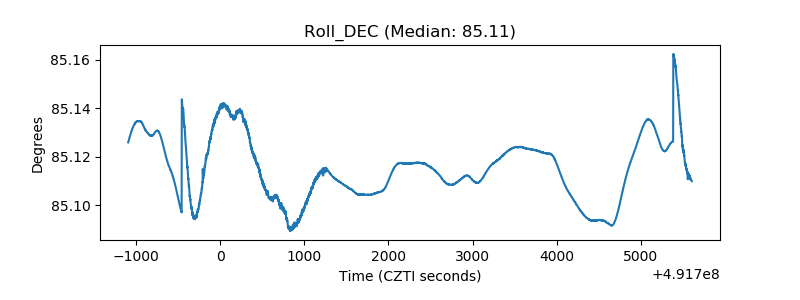 |
| _Roll_RA | 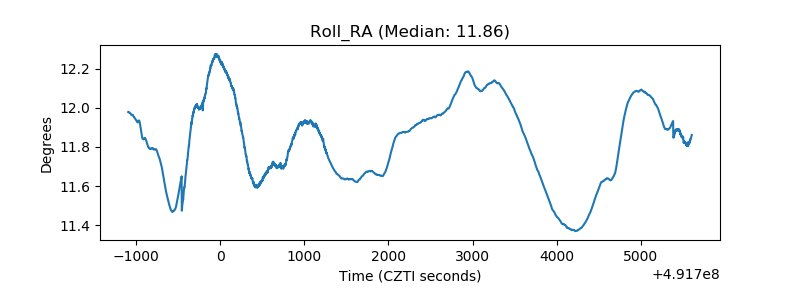 |
| Veto Counter | 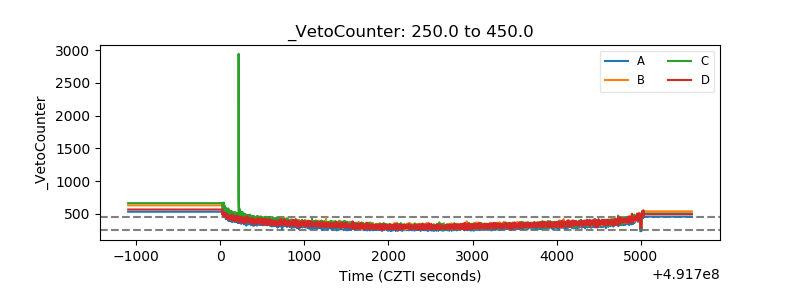 |