| Param | Original file | Final file |
|---|---|---|
| Filename | modeM0/AS1C09_011T08_9000006492cztM0_level2.fits | modeM0/AS1C09_011T08_9000006492cztM0_level2_quad_clean.evt |
| Size (bytes) | 3,508,081,920 | 1,537,012,800 |
| Size | 3.3 GB | 1.4 GB |
| Events in quadrant A | 21,358,548 | 4,510,914 |
| Events in quadrant B | 20,261,888 | 4,633,233 |
| Events in quadrant C | 15,636,888 | 2,350,433 |
| Events in quadrant D | 17,867,632 | 4,045,671 |
| Mode M0 | |||
|---|---|---|---|
| Quadrant | BADHDUFLAG | Total packets | Discarded packets |
| A | 0 | 1241508 | 0 |
| B | 0 | 1318606 | 0 |
| C | 0 | 2516259 | 0 |
| D | 0 | 1285806 | 0 |
| Mode M9 | |||
|---|---|---|---|
| Quadrant | BADHDUFLAG | Total packets | Discarded packets |
| A | 0 | 529 | 0 |
| B | 0 | 530 | 0 |
| C | 0 | 530 | 0 |
| D | 0 | 530 | 0 |
| Mode SS | |||
|---|---|---|---|
| Quadrant | BADHDUFLAG | Total packets | Discarded packets |
| A | 0 | 9188 | 0 |
| B | 0 | 9188 | 0 |
| C | 0 | 9188 | 0 |
| D | 0 | 9188 | 0 |
| Quadrant | Total seconds | Saturated seconds | Saturation percentage |
|---|---|---|---|
| A | 452294 | 29687 | 6.563651% |
| B | 452294 | 33276 | 7.357161% |
| C | 452294 | 195974 | 43.328897% |
| D | 452293 | 35055 | 7.750507% |
Noise dominated data is calculated using 1-second bins in cleaned event files. If a bin has >2000 counts, and if more than 50% of those come from <1% of pixels, then it is considered to be noise-dominated and hence unusable.
| Quadrant | # 1 sec bins | Bins with >0 counts | Bins with >2000 counts | High rate bins dominated by noise | Noise dominated (total time) | Noise dominated (detector-on time) | Marked lightcurve |
|---|---|---|---|---|---|---|---|
| A | 688122 | 451457 | 0 | 0 | 0.00% | 0.00% | 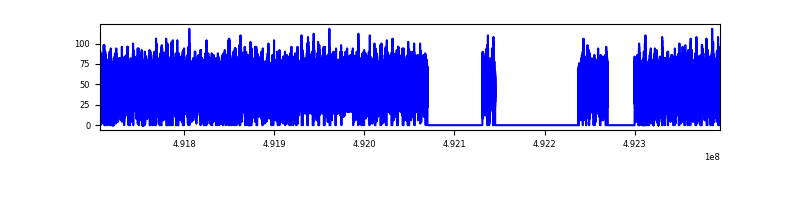 |
| B | 688122 | 451686 | 0 | 0 | 0.00% | 0.00% | 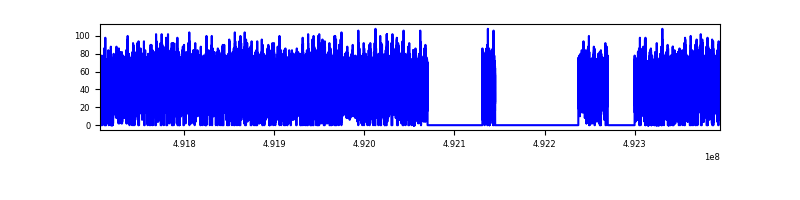 |
| C | 688122 | 445164 | 0 | 0 | 0.00% | 0.00% | 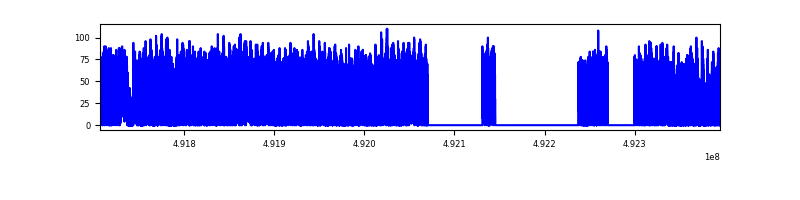 |
| D | 688122 | 447960 | 0 | 0 | 0.00% | 0.00% | 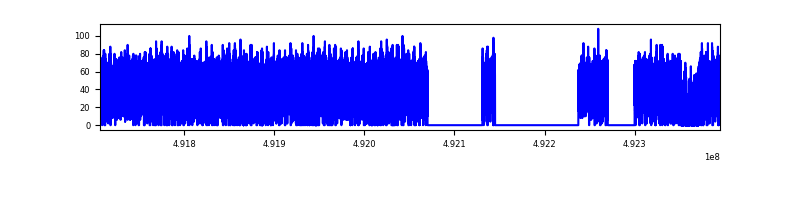 |
Top three noisy pixels from each quadrant. If the there are fewer than three noisy pixels in the level2.evt file, extra rows are filled as -1
| Pixel properties | Quadrant properties | ||||||
|---|---|---|---|---|---|---|---|
| Quadrant | DetID | PixID | Counts | Sigma | Mean | Median | Sigma |
| A | 14 | 188 | 24924 | 10.6 | 5649 | 5244 | 1856.7 |
| A | 9 | 255 | 22811 | 9.46 | 5649 | 5244 | 1856.7 |
| A | 14 | 204 | 19672 | 7.77 | 5649 | 5244 | 1856.7 |
| B | 2 | 9 | 23608 | 14.84 | 5388 | 5123 | 1246.0 |
| B | 2 | 8 | 21090 | 12.81 | 5388 | 5123 | 1246.0 |
| B | 9 | 173 | 16977 | 9.51 | 5388 | 5123 | 1246.0 |
| C | 2 | 31 | 12699 | 6.14 | 4204 | 3835 | 1442.7 |
| C | 7 | 221 | 12398 | 5.94 | 4204 | 3835 | 1442.7 |
| C | 3 | 203 | 12243 | 5.83 | 4204 | 3835 | 1442.7 |
| D | 6 | 218 | 24043 | 11.29 | 5118 | 4534 | 1727.7 |
| D | 3 | 30 | 16418 | 6.88 | 5118 | 4534 | 1727.7 |
| D | 8 | 12 | 16361 | 6.85 | 5118 | 4534 | 1727.7 |
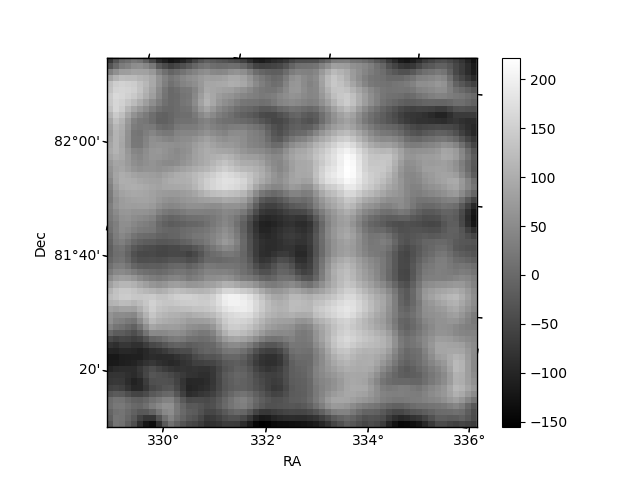
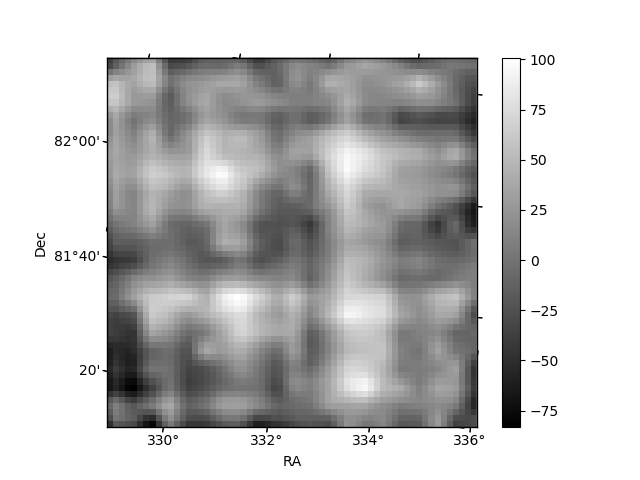
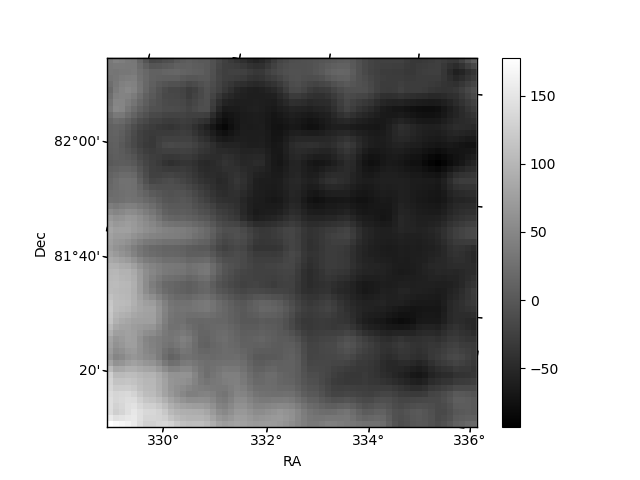
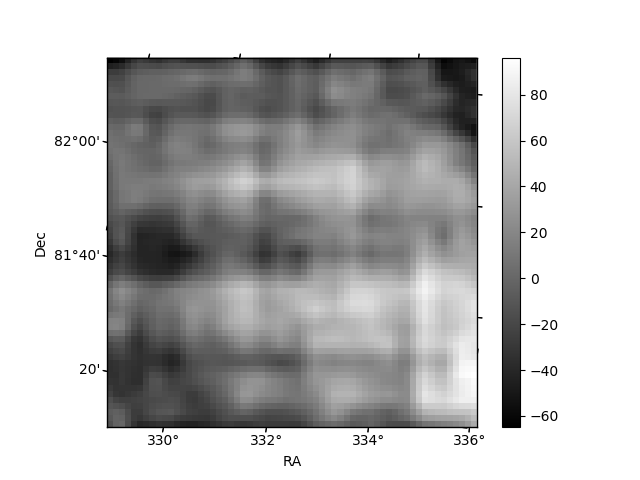
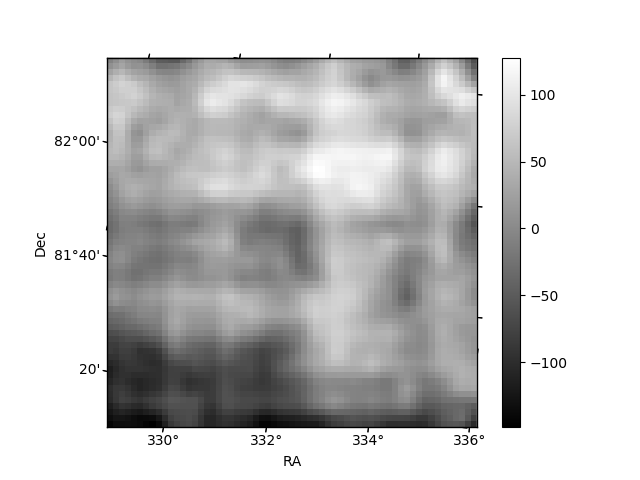
Histogram calculated using DETX and DETY for each event in the final _common_clean file
| Quadrant A | 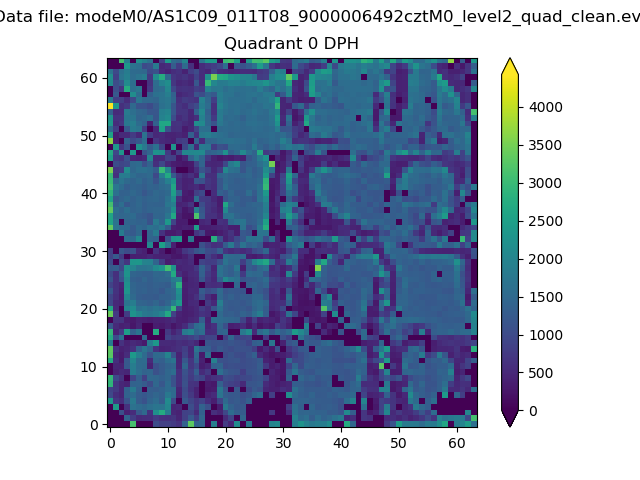 |
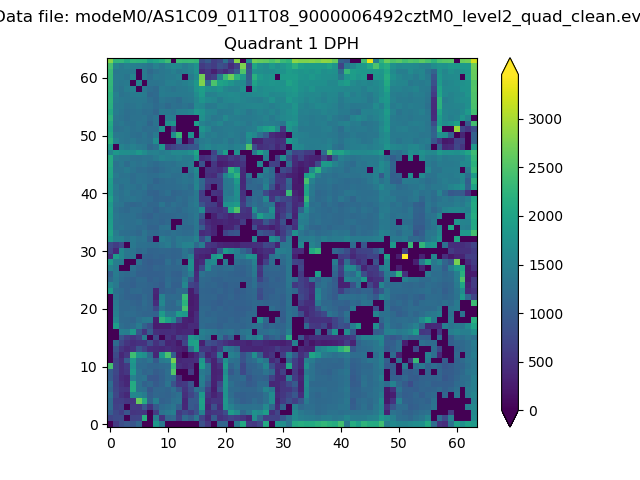 |
Quadrant B |
|---|---|---|---|
| Quadrant D | 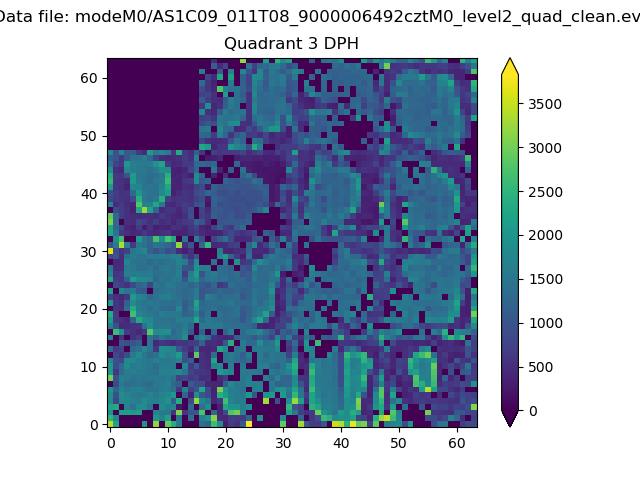 |
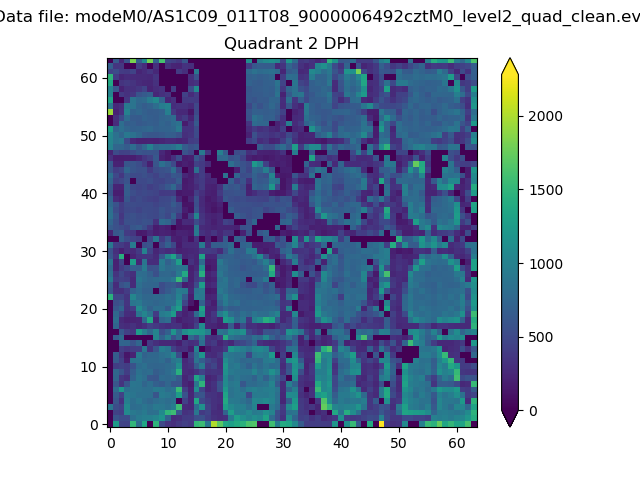 |
Quadrant C |
| Plot type | Count rate plots | Images |
|---|---|---|
| Comparison with Poisson distribution Blue bars denote a histogram of data divided into 1 sec bins. Red curve is a Poisson curve with rate = median count rate of data. |
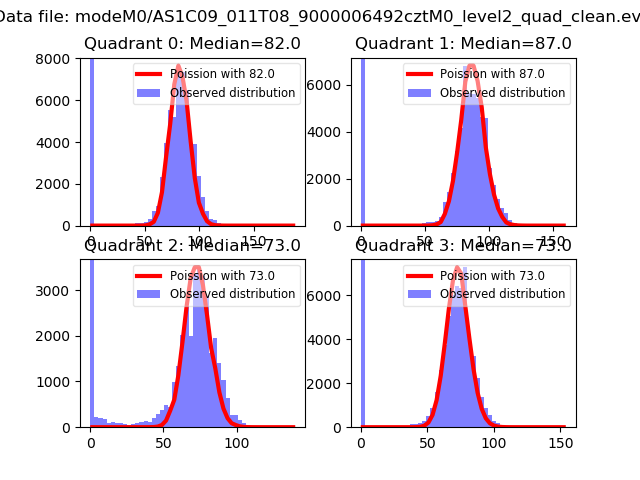 |
 |
| Quadrant-wise count rates Data is divided into 100 sec bins |
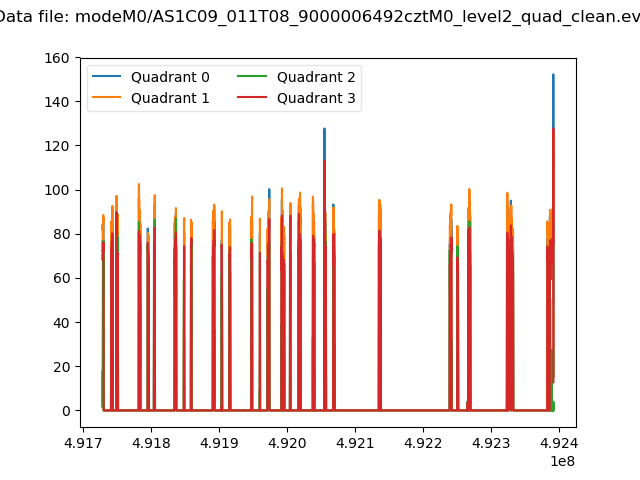 |
|
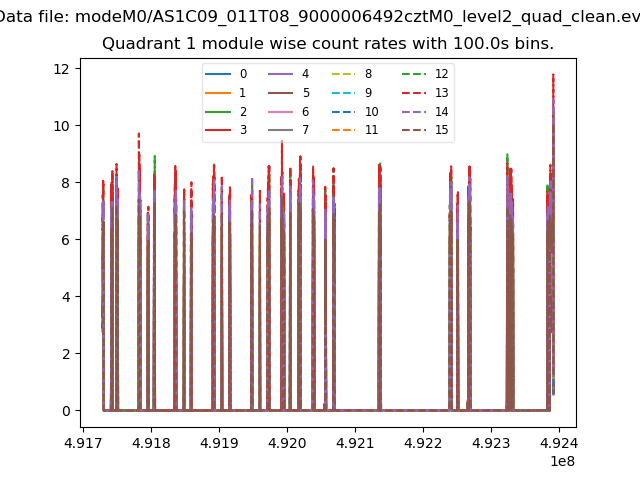
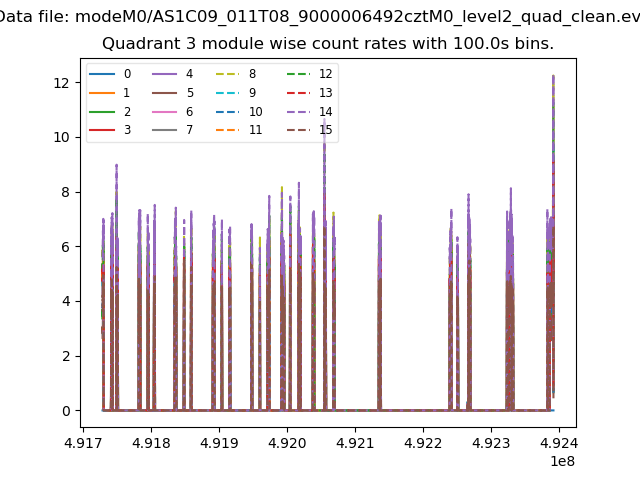
| Module-wise count rates for Quadrant A Data is divided into 100 sec bins |
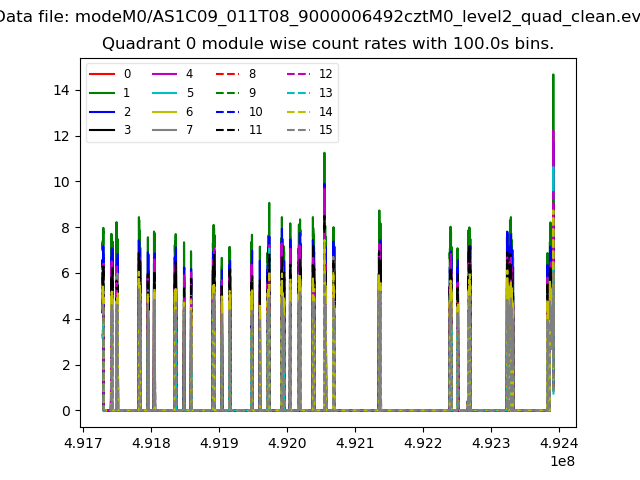 |
 |
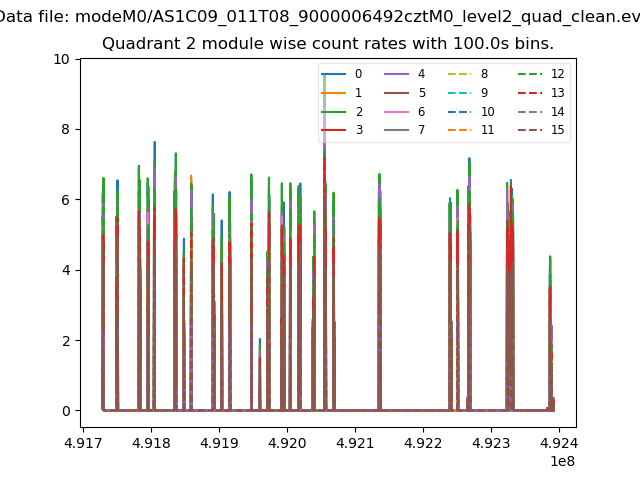
| Module-wise count rates for Quadrant B Data is divided into 100 sec bins |
 |
 |
| Module-wise count rates for Quadrant C Data is divided into 100 sec bins |
 |
 |
| Module-wise count rates for Quadrant D Data is divided into 100 sec bins |
 |
 |
| Parameter | Plot |
|---|---|
| CZT HV Monitor | 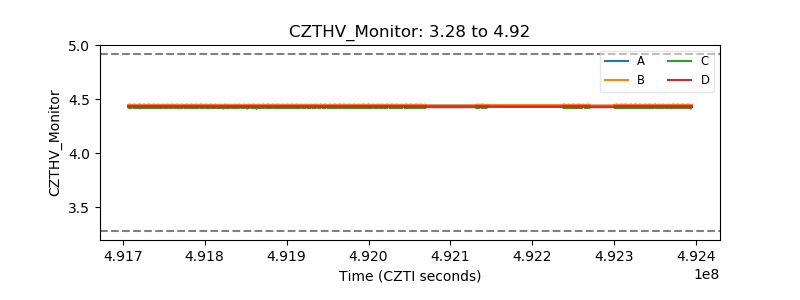 |
| D_VDD | 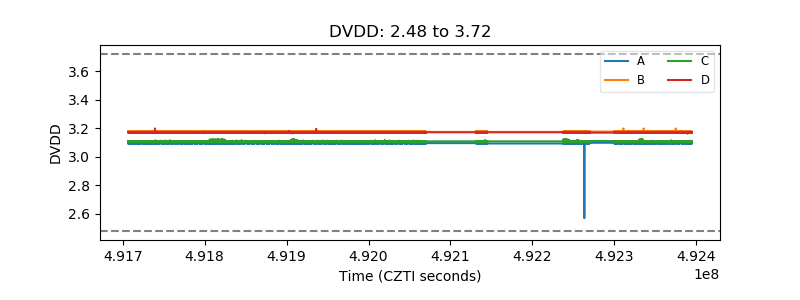 |
| Temperature 1 | 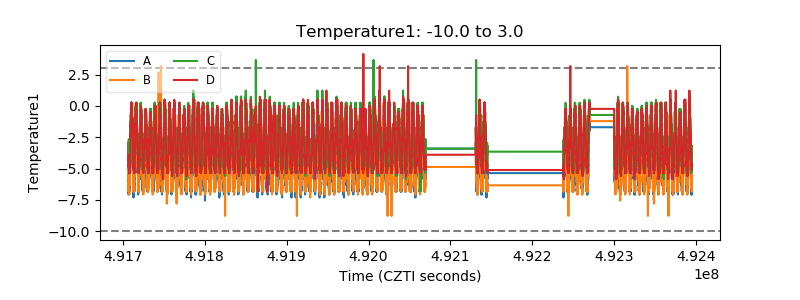 |
| Veto HV Monitor | 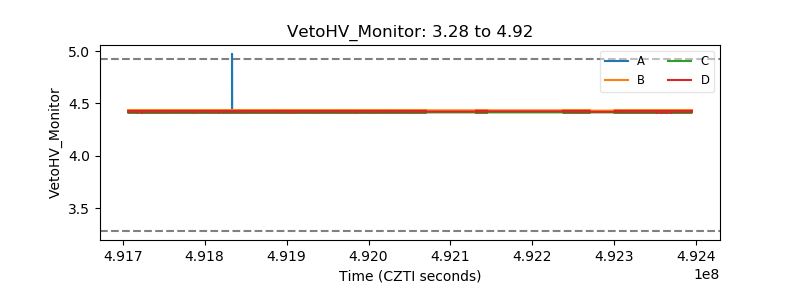 |
| Veto LLD | 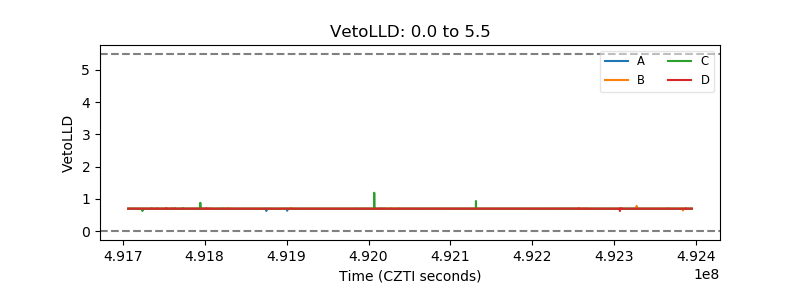 |
| Alpha Counter | 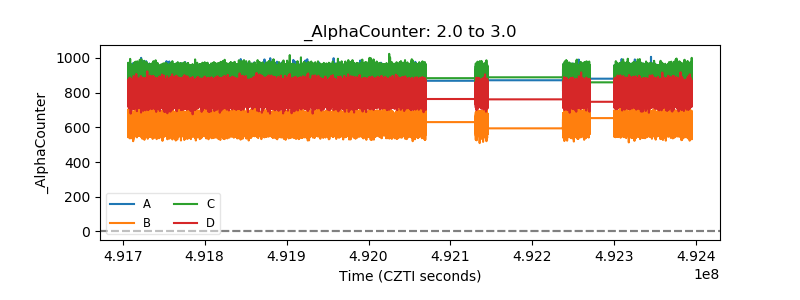 |
| _CPM_Rate | 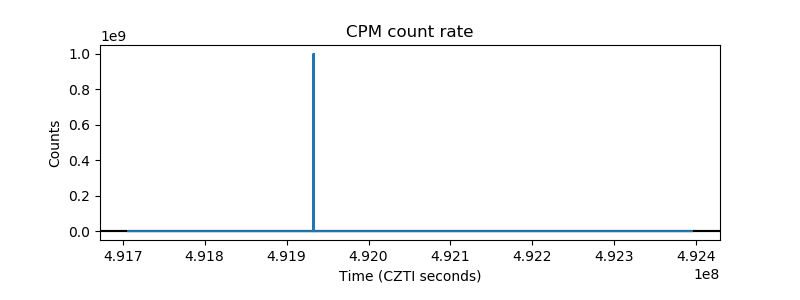 |
| CZT Counter |  |
| +2.5 Volts monitor | 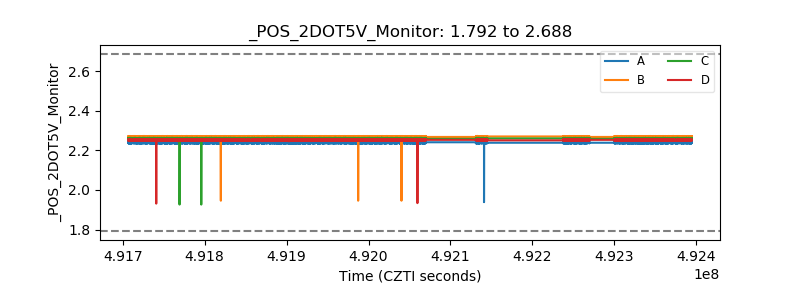 |
| +5 Volts monitor | 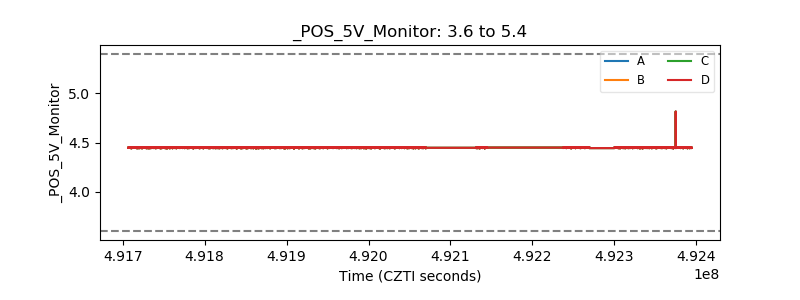 |
| _ROLL_ROT | 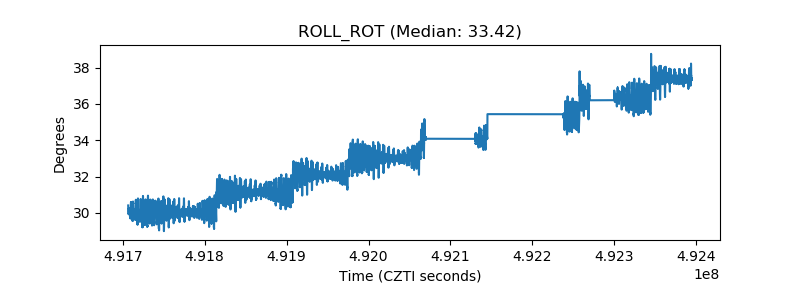 |
| _Roll_DEC | 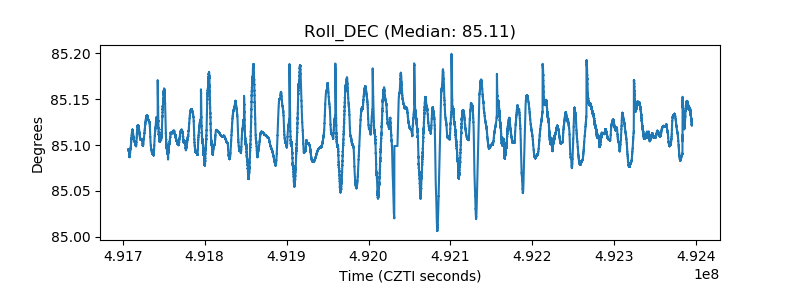 |
| _Roll_RA | 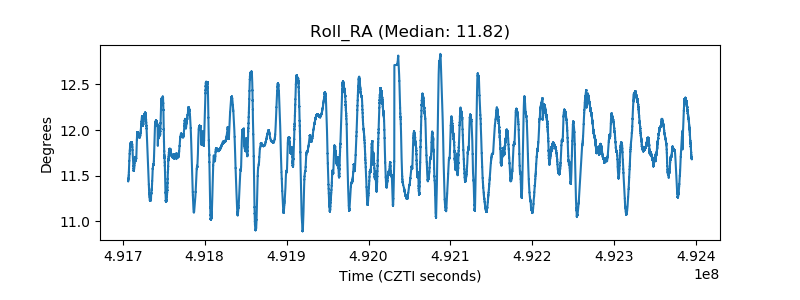 |
| Veto Counter | 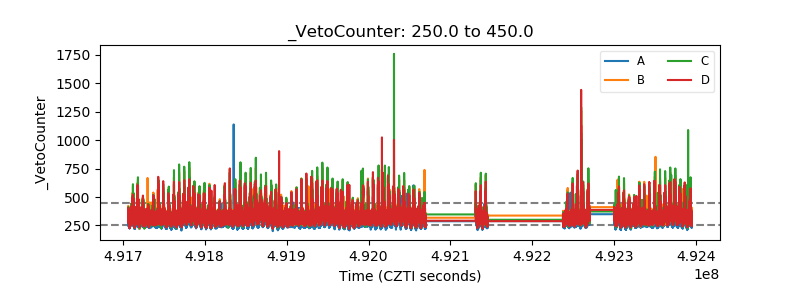 |