| Param | Original file | Final file |
|---|---|---|
| Filename | modeM0/AS1C09_011T08_9000006492_53240cztM0_level2.fits | modeM0/AS1C09_011T08_9000006492_53240cztM0_level2_quad_clean.evt |
| Size (bytes) | 719,360,640 | 85,734,720 |
| Size | 686.0 MB | 81.8 MB |
| Events in quadrant A | 5,306,423 | 576,684 |
| Events in quadrant B | 7,819,324 | 538,079 |
| Events in quadrant C | 8,548,089 | 474,158 |
| Events in quadrant D | 4,448,096 | 549,952 |
| Mode M0 | |||
|---|---|---|---|
| Quadrant | BADHDUFLAG | Total packets | Discarded packets |
| A | 0 | 20464 | 1 |
| B | 0 | 27685 | 1 |
| C | 0 | 29977 | 1 |
| D | 0 | 17981 | 1 |
| Mode M9 | |||
|---|---|---|---|
| Quadrant | BADHDUFLAG | Total packets | Discarded packets |
| A | 0 | 10 | 0 |
| B | 0 | 10 | 0 |
| C | 0 | 10 | 0 |
| D | 0 | 10 | 0 |
| Mode SS | |||
|---|---|---|---|
| Quadrant | BADHDUFLAG | Total packets | Discarded packets |
| A | 0 | 134 | 0 |
| B | 0 | 134 | 0 |
| C | 0 | 134 | 0 |
| D | 0 | 134 | 0 |
| Quadrant | Total seconds | Saturated seconds | Saturation percentage |
|---|---|---|---|
| A | 6545 | 584 | 8.922842% |
| B | 6545 | 1445 | 22.077922% |
| C | 6546 | 1604 | 24.503514% |
| D | 6546 | 197 | 3.009471% |
Noise dominated data is calculated using 1-second bins in cleaned event files. If a bin has >2000 counts, and if more than 50% of those come from <1% of pixels, then it is considered to be noise-dominated and hence unusable.
| Quadrant | # 1 sec bins | Bins with >0 counts | Bins with >2000 counts | High rate bins dominated by noise | Noise dominated (total time) | Noise dominated (detector-on time) | Marked lightcurve |
|---|---|---|---|---|---|---|---|
| A | 7550 | 6546 | 527 | 527 | 6.98% | 8.05% | 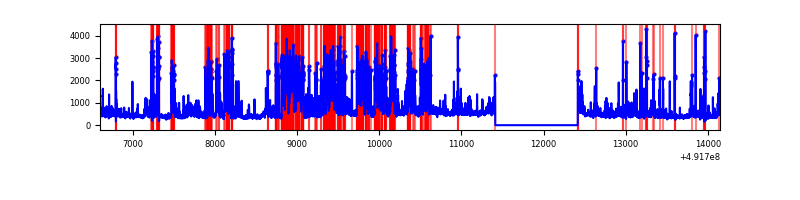 |
| B | 7550 | 6546 | 1037 | 1037 | 13.74% | 15.84% | 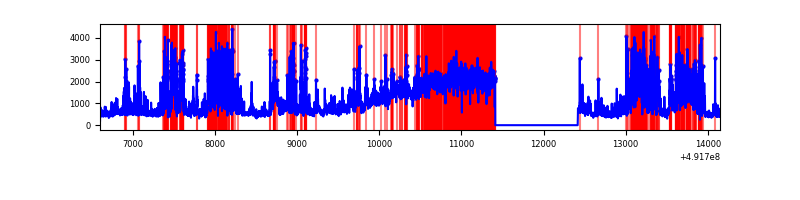 |
| C | 7551 | 6547 | 1486 | 1486 | 19.68% | 22.70% | 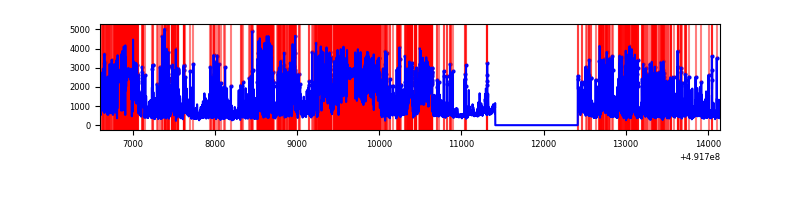 |
| D | 7551 | 6547 | 191 | 191 | 2.53% | 2.92% | 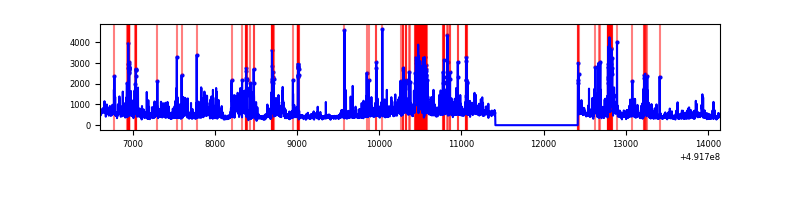 |
Top three noisy pixels from each quadrant. If the there are fewer than three noisy pixels in the level2.evt file, extra rows are filled as -1
| Pixel properties | Quadrant properties | ||||||
|---|---|---|---|---|---|---|---|
| Quadrant | DetID | PixID | Counts | Sigma | Mean | Median | Sigma |
| A | 3 | 62 | 1582790 | 10014.27 | 637 | 620 | 158.0 |
| A | 7 | 206 | 369827 | 2336.88 | 637 | 620 | 158.0 |
| A | 0 | 8 | 333219 | 2105.17 | 637 | 620 | 158.0 |
| B | 12 | 33 | 2442858 | 19026.48 | 609 | 588 | 128.4 |
| B | 2 | 249 | 1817372 | 14153.64 | 609 | 588 | 128.4 |
| B | 10 | 254 | 431546 | 3357.37 | 609 | 588 | 128.4 |
| C | 1 | 241 | 3521997 | 22178.98 | 573 | 568 | 158.8 |
| C | 15 | 224 | 1618139 | 10187.93 | 573 | 568 | 158.8 |
| C | 4 | 5 | 568919 | 3579.64 | 573 | 568 | 158.8 |
| D | 15 | 125 | 463167 | 2587.89 | 627 | 598 | 178.7 |
| D | 10 | 172 | 344944 | 1926.48 | 627 | 598 | 178.7 |
| D | 12 | 3 | 227655 | 1270.29 | 627 | 598 | 178.7 |
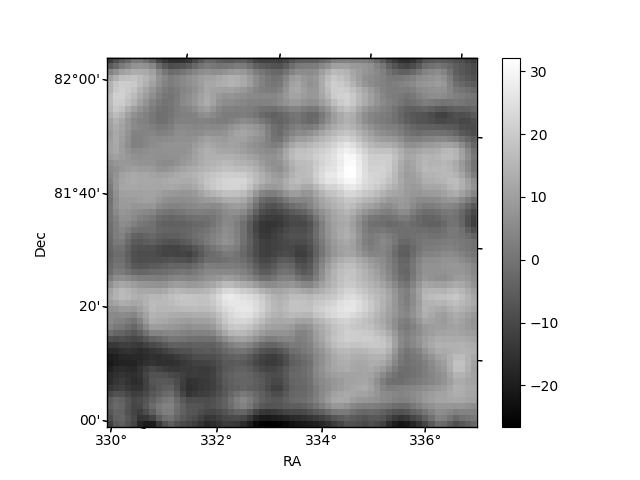
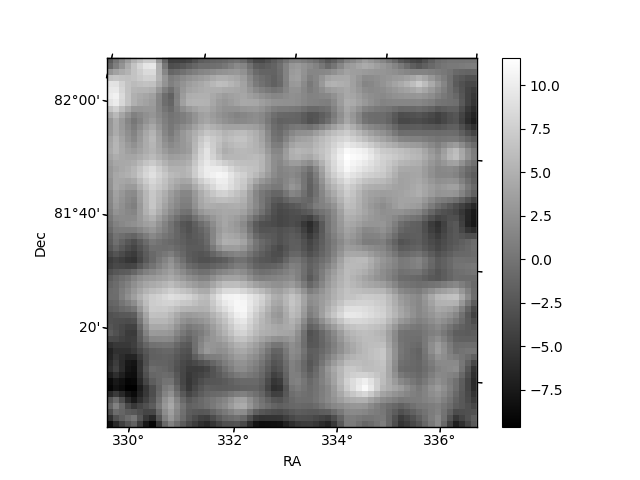
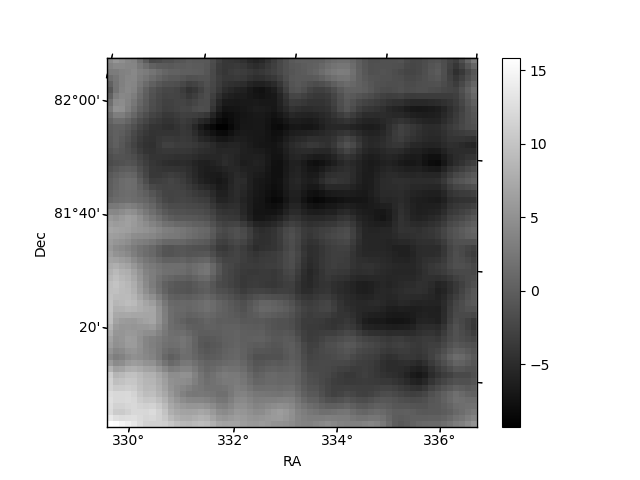
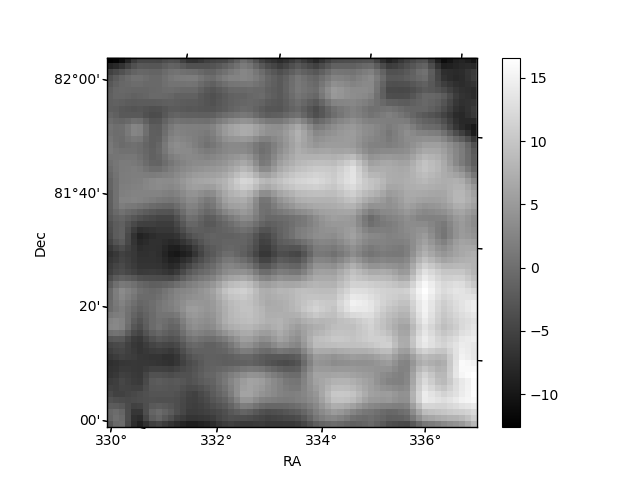
Histogram calculated using DETX and DETY for each event in the final _common_clean file
| Quadrant A | 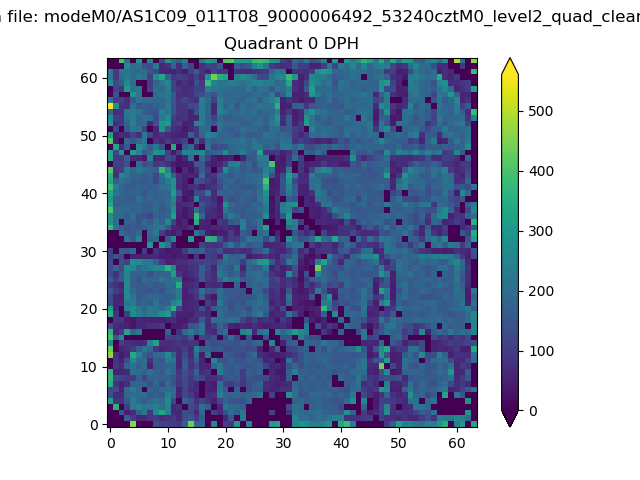 |
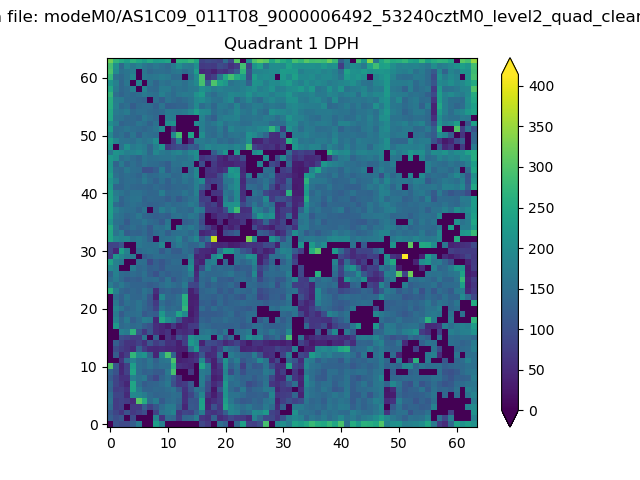 |
Quadrant B |
|---|---|---|---|
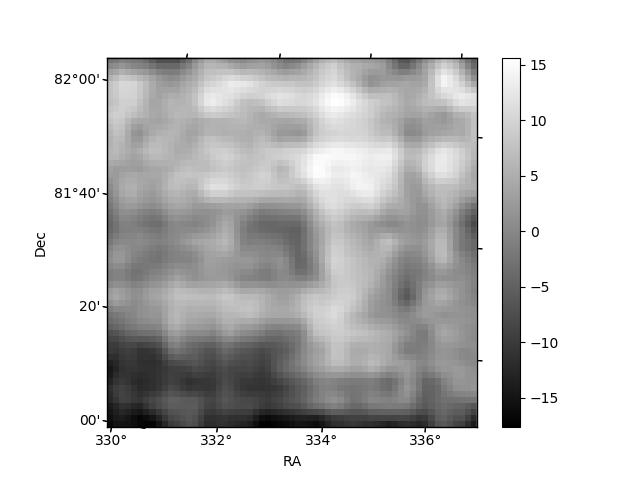
| Quadrant D | 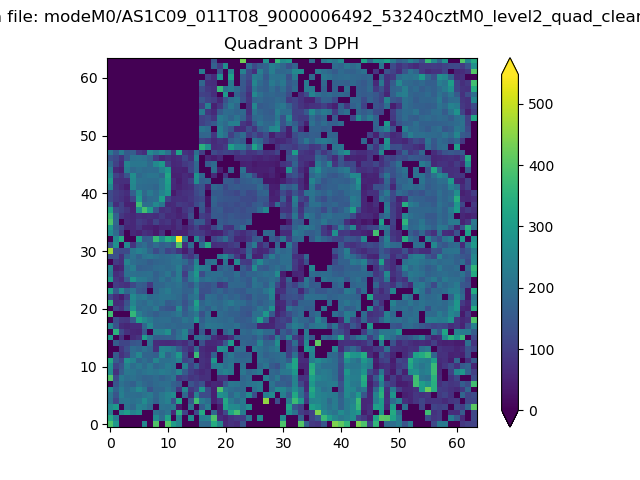 |
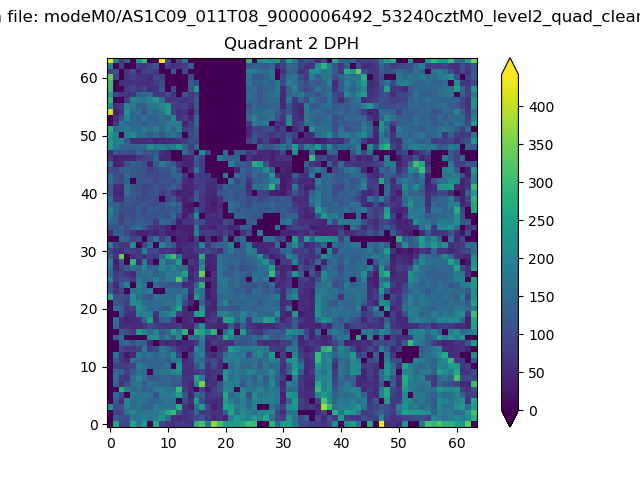 |
Quadrant C |
| Plot type | Count rate plots | Images |
|---|---|---|
| Comparison with Poisson distribution Blue bars denote a histogram of data divided into 1 sec bins. Red curve is a Poisson curve with rate = median count rate of data. |
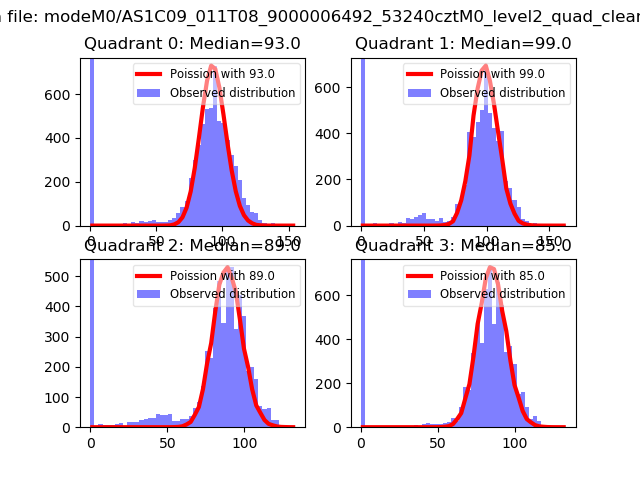 |
 |
| Quadrant-wise count rates Data is divided into 100 sec bins |
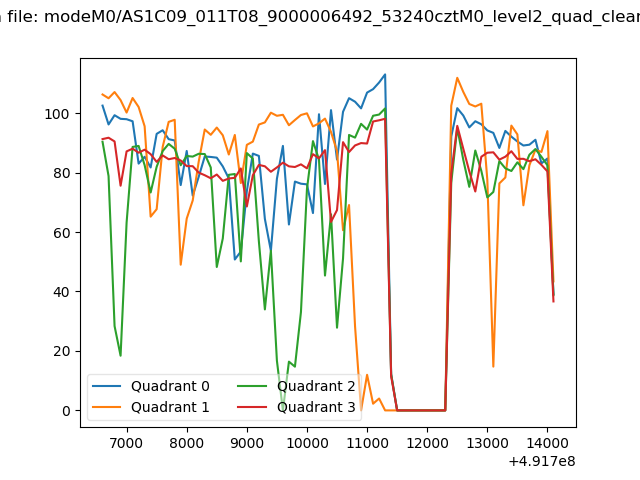 |
|
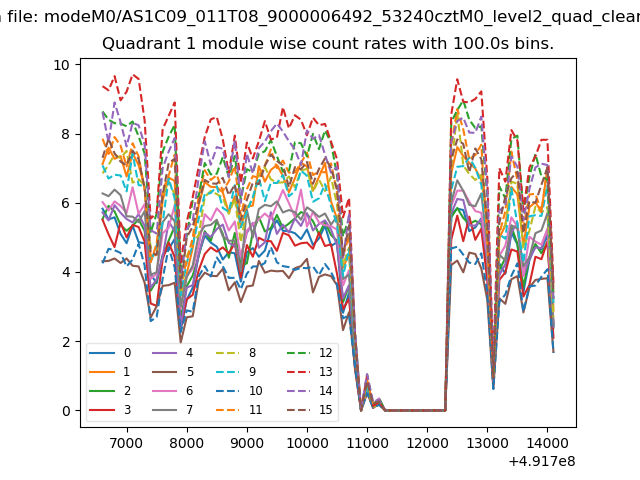
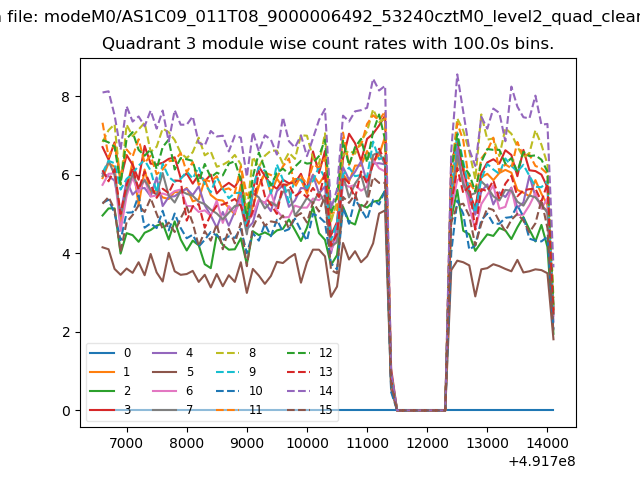
| Module-wise count rates for Quadrant A Data is divided into 100 sec bins |
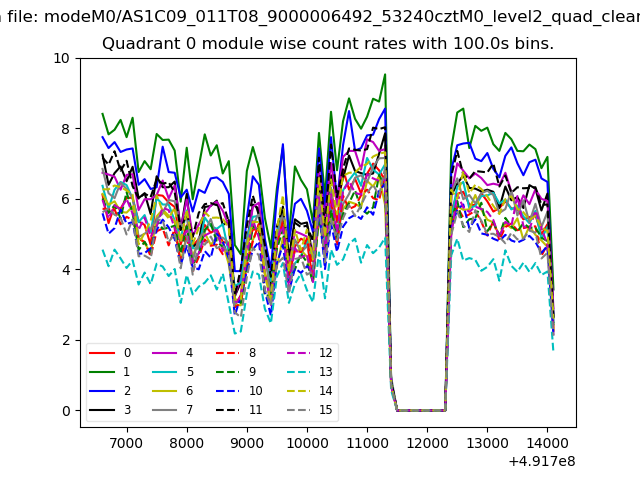 |
 |
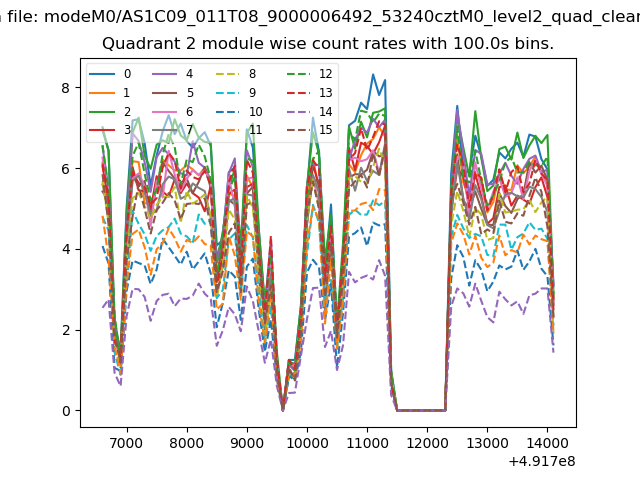
| Module-wise count rates for Quadrant B Data is divided into 100 sec bins |
 |
 |
| Module-wise count rates for Quadrant C Data is divided into 100 sec bins |
 |
 |
| Module-wise count rates for Quadrant D Data is divided into 100 sec bins |
 |
 |
| Parameter | Plot |
|---|---|
| CZT HV Monitor | 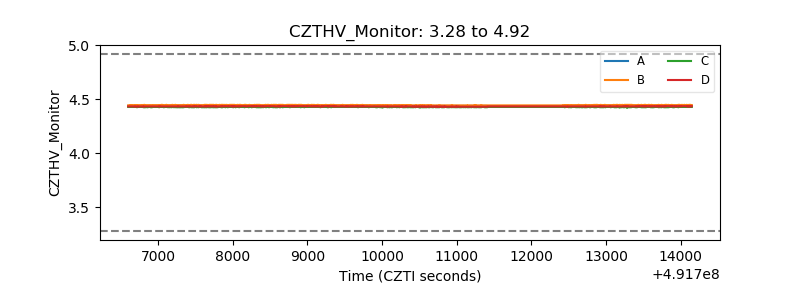 |
| D_VDD | 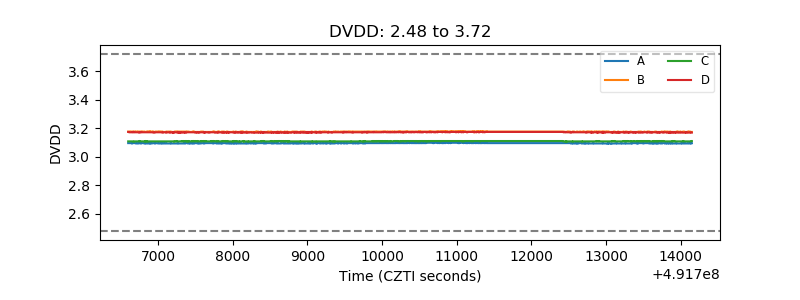 |
| Temperature 1 | 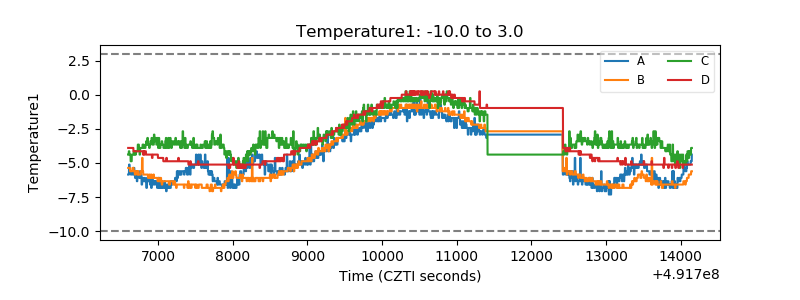 |
| Veto HV Monitor | 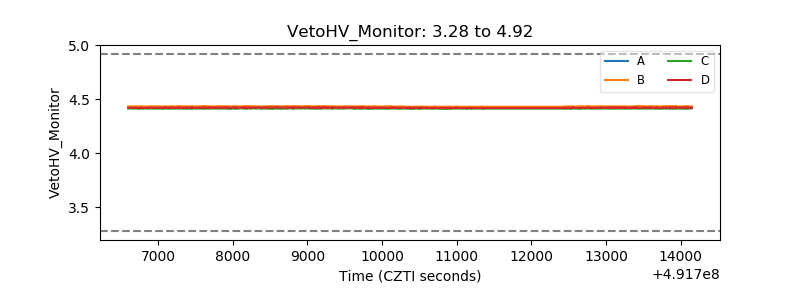 |
| Veto LLD | 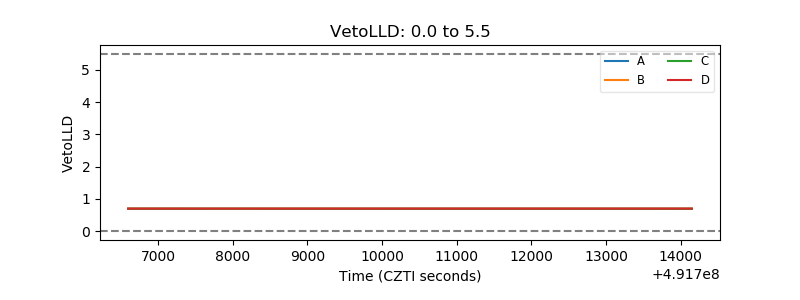 |
| Alpha Counter | 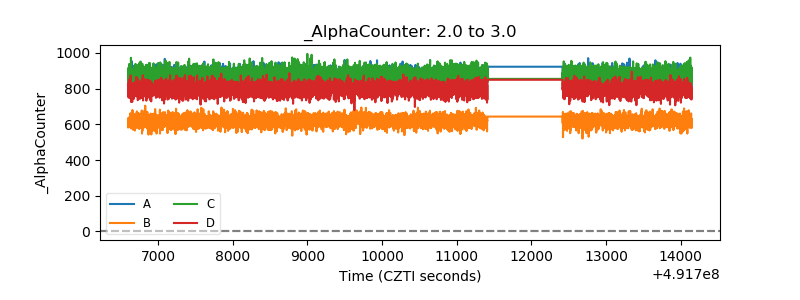 |
| _CPM_Rate | 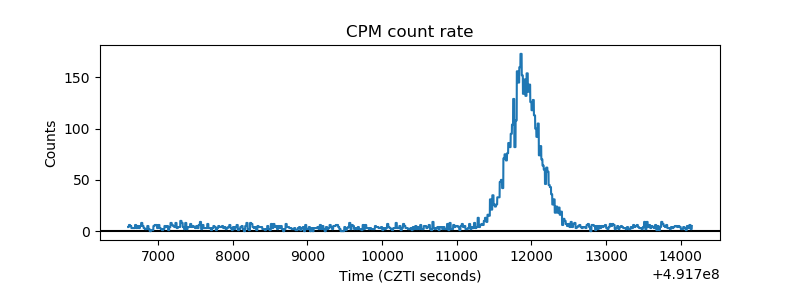 |
| CZT Counter | 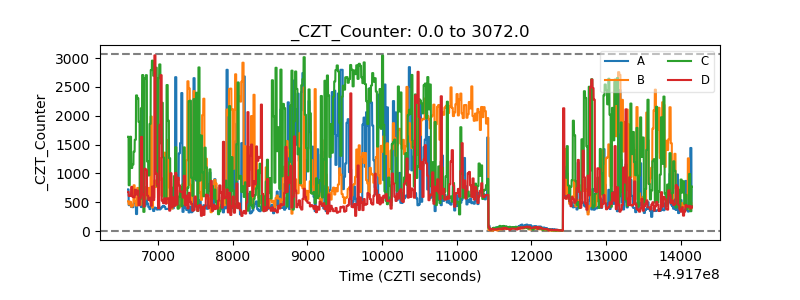 |
| +2.5 Volts monitor |  |
| +5 Volts monitor |  |
| _ROLL_ROT | 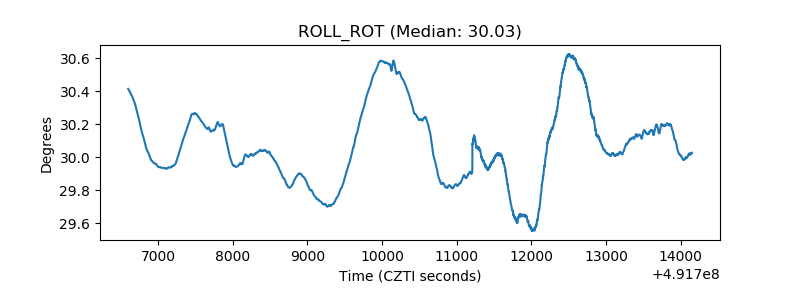 |
| _Roll_DEC | 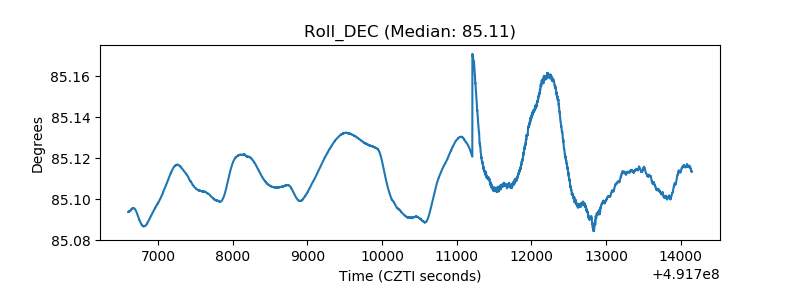 |
| _Roll_RA | 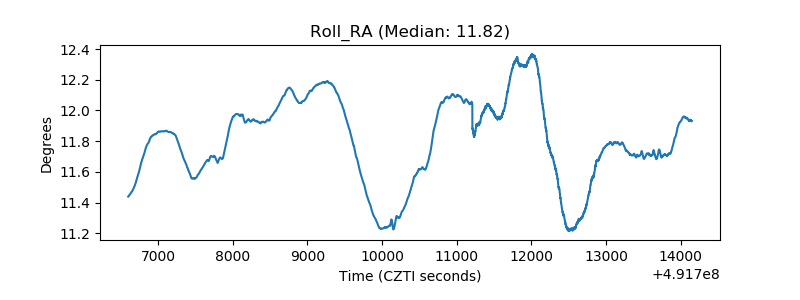 |
| Veto Counter | 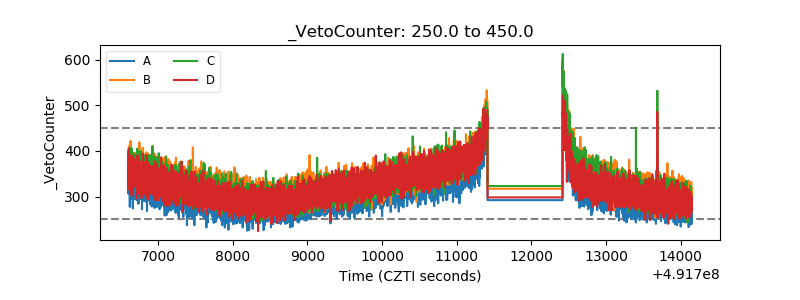 |