| Param | Original file | Final file |
|---|---|---|
| Filename | modeM0/AS1C09_011T08_9000006492_53242cztM0_level2.fits | modeM0/AS1C09_011T08_9000006492_53242cztM0_level2_quad_clean.evt |
| Size (bytes) | 806,814,720 | 90,394,560 |
| Size | 769.4 MB | 86.2 MB |
| Events in quadrant A | 7,984,545 | 513,618 |
| Events in quadrant B | 8,822,245 | 602,101 |
| Events in quadrant C | 8,051,452 | 537,642 |
| Events in quadrant D | 4,461,162 | 590,904 |
| Mode M0 | |||
|---|---|---|---|
| Quadrant | BADHDUFLAG | Total packets | Discarded packets |
| A | 0 | 28588 | 0 |
| B | 0 | 31167 | 0 |
| C | 0 | 28850 | 0 |
| D | 0 | 18429 | 0 |
| Mode SS | |||
|---|---|---|---|
| Quadrant | BADHDUFLAG | Total packets | Discarded packets |
| A | 0 | 142 | 0 |
| B | 0 | 142 | 0 |
| C | 0 | 142 | 0 |
| D | 0 | 142 | 0 |
| Quadrant | Total seconds | Saturated seconds | Saturation percentage |
|---|---|---|---|
| A | 7066 | 1768 | 25.021228% |
| B | 7066 | 1421 | 20.110388% |
| C | 7066 | 1219 | 17.251628% |
| D | 7066 | 142 | 2.009624% |
Noise dominated data is calculated using 1-second bins in cleaned event files. If a bin has >2000 counts, and if more than 50% of those come from <1% of pixels, then it is considered to be noise-dominated and hence unusable.
| Quadrant | # 1 sec bins | Bins with >0 counts | Bins with >2000 counts | High rate bins dominated by noise | Noise dominated (total time) | Noise dominated (detector-on time) | Marked lightcurve |
|---|---|---|---|---|---|---|---|
| A | 7066 | 7066 | 1668 | 1668 | 23.61% | 23.61% | 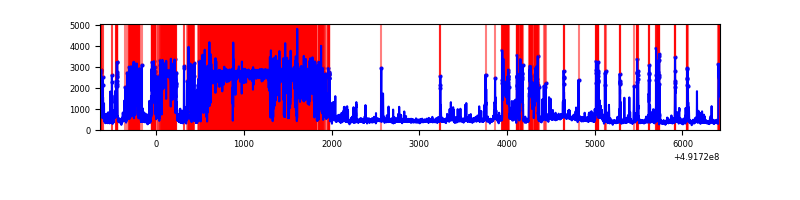 |
| B | 7066 | 7066 | 841 | 841 | 11.90% | 11.90% | 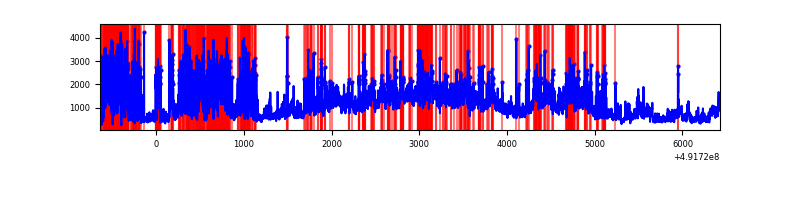 |
| C | 7066 | 7066 | 1078 | 1078 | 15.26% | 15.26% | 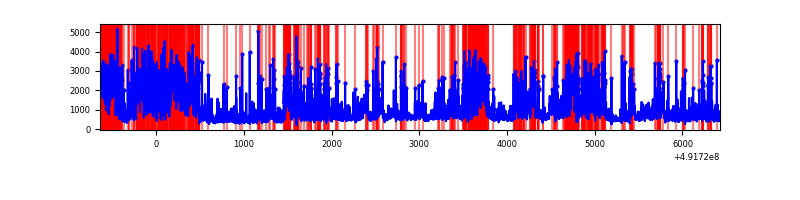 |
| D | 7066 | 7066 | 123 | 123 | 1.74% | 1.74% | 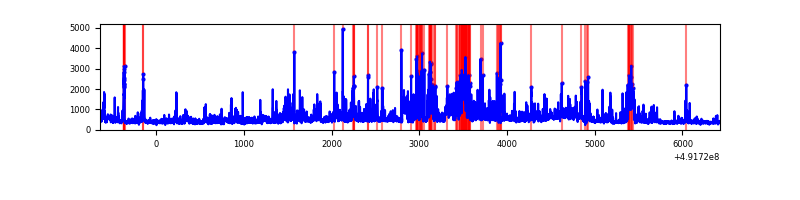 |
Top three noisy pixels from each quadrant. If the there are fewer than three noisy pixels in the level2.evt file, extra rows are filled as -1
| Pixel properties | Quadrant properties | ||||||
|---|---|---|---|---|---|---|---|
| Quadrant | DetID | PixID | Counts | Sigma | Mean | Median | Sigma |
| A | 3 | 62 | 4334221 | 27499.63 | 631 | 614 | 157.6 |
| A | 7 | 206 | 590895 | 3745.73 | 631 | 614 | 157.6 |
| A | 0 | 8 | 347860 | 2203.51 | 631 | 614 | 157.6 |
| B | 12 | 33 | 2422717 | 16740.2 | 672 | 650 | 144.7 |
| B | 2 | 249 | 1194409 | 8250.71 | 672 | 650 | 144.7 |
| B | 10 | 28 | 830703 | 5736.94 | 672 | 650 | 144.7 |
| C | 1 | 241 | 2273708 | 12662.25 | 655 | 650 | 179.5 |
| C | 15 | 224 | 1611886 | 8975.52 | 655 | 650 | 179.5 |
| C | 4 | 5 | 576126 | 3205.73 | 655 | 650 | 179.5 |
| D | 2 | 120 | 340708 | 1732.56 | 693 | 663 | 196.3 |
| D | 10 | 172 | 229549 | 1166.19 | 693 | 663 | 196.3 |
| D | 8 | 48 | 174627 | 886.36 | 693 | 663 | 196.3 |
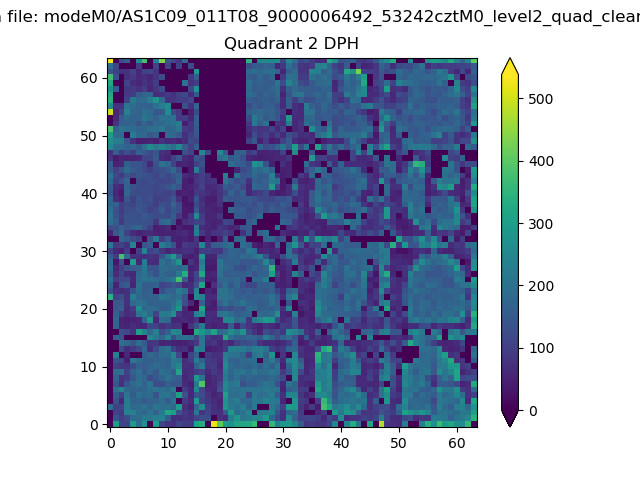
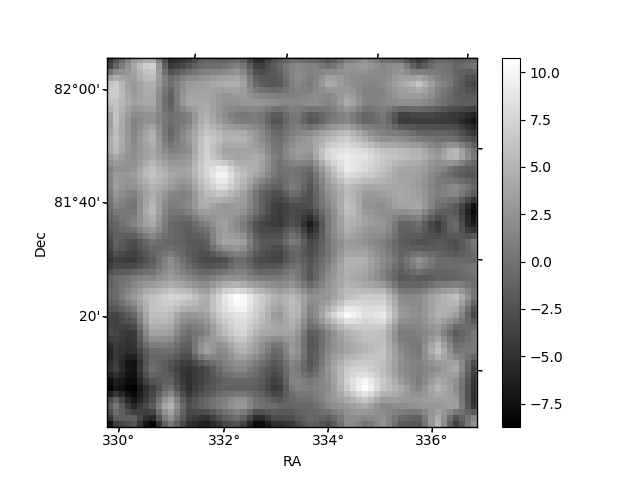
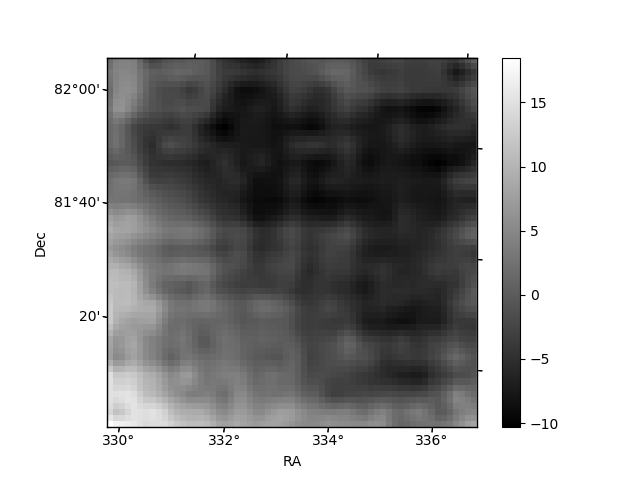
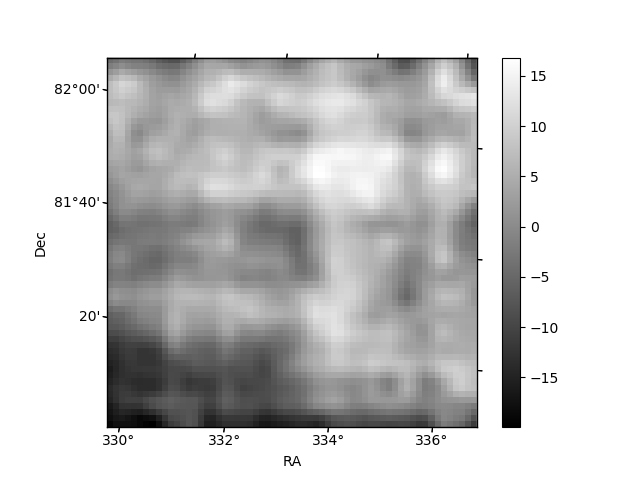
Histogram calculated using DETX and DETY for each event in the final _common_clean file
| Quadrant A | 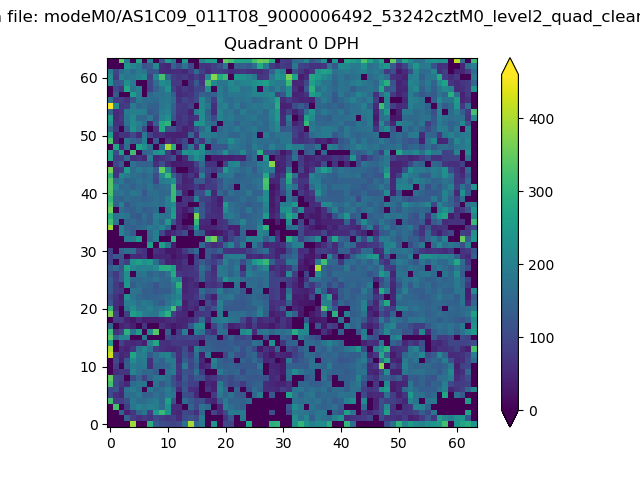 |
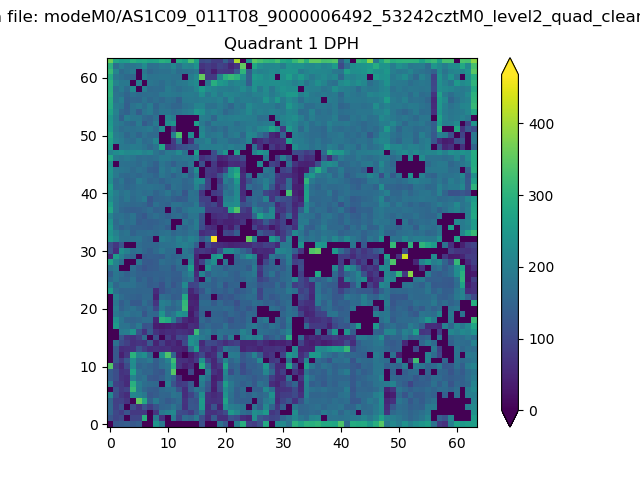 |
Quadrant B |
|---|---|---|---|
| Quadrant D | 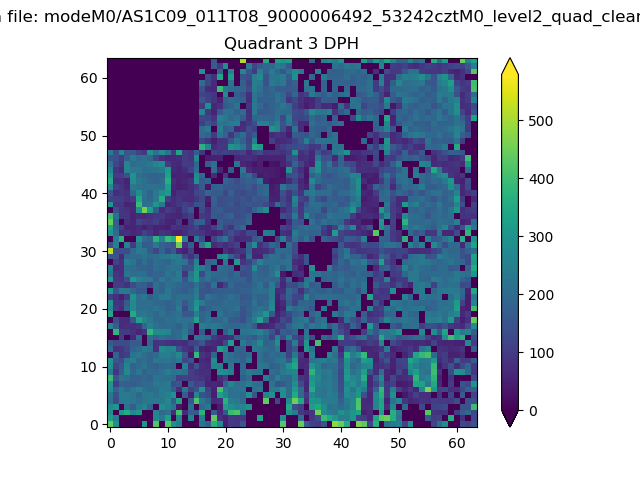 |
 |
Quadrant C |
| Plot type | Count rate plots | Images |
|---|---|---|
| Comparison with Poisson distribution Blue bars denote a histogram of data divided into 1 sec bins. Red curve is a Poisson curve with rate = median count rate of data. |
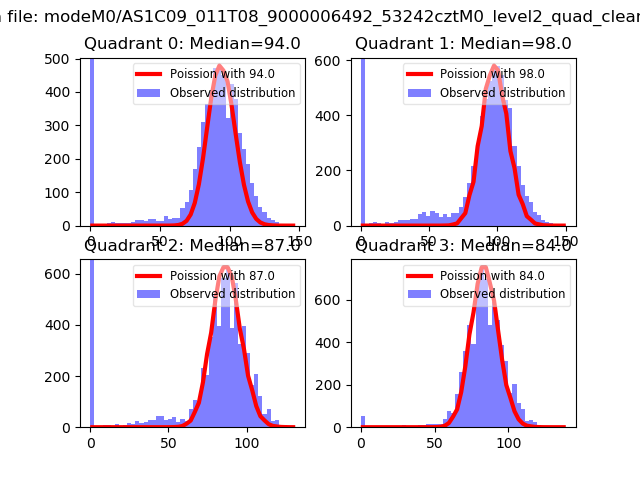 |
 |
| Quadrant-wise count rates Data is divided into 100 sec bins |
 |
|
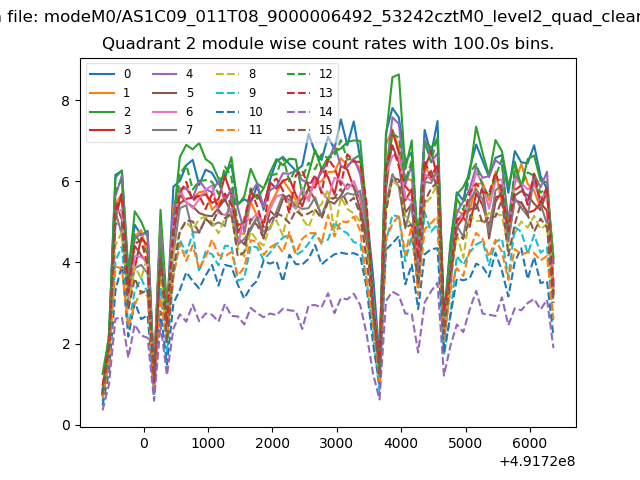
| Module-wise count rates for Quadrant A Data is divided into 100 sec bins |
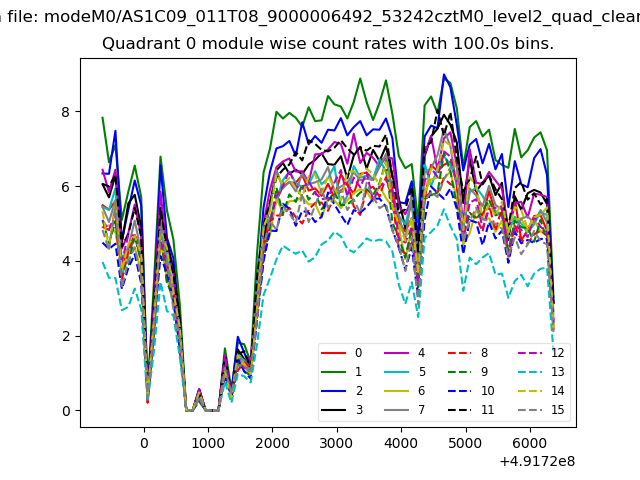 |
 |
| Module-wise count rates for Quadrant B Data is divided into 100 sec bins |
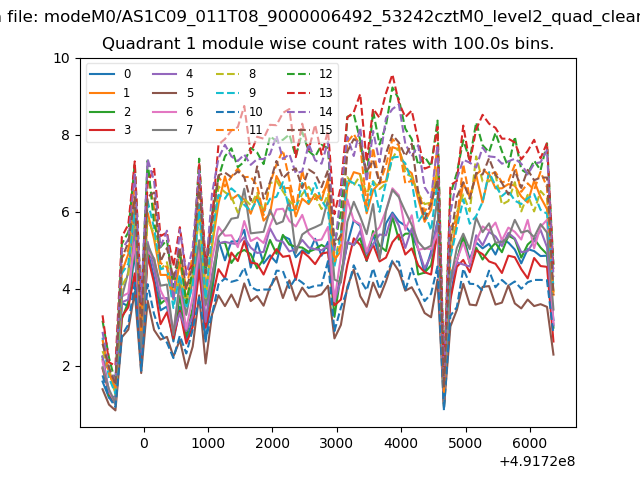 |
 |
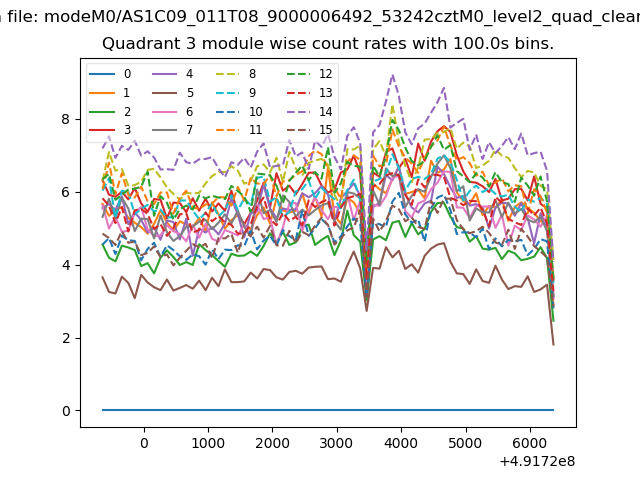
| Module-wise count rates for Quadrant C Data is divided into 100 sec bins |
 |
 |
| Module-wise count rates for Quadrant D Data is divided into 100 sec bins |
 |
 |
| Parameter | Plot |
|---|---|
| CZT HV Monitor | 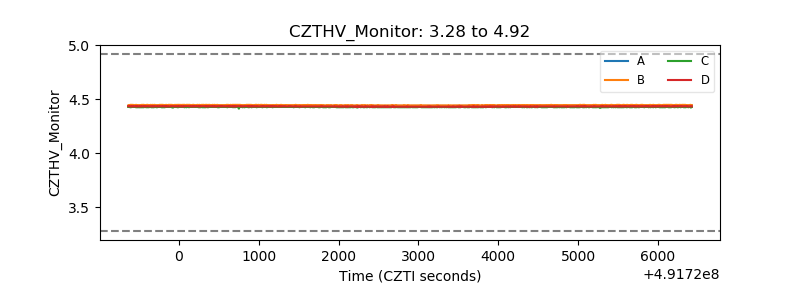 |
| D_VDD | 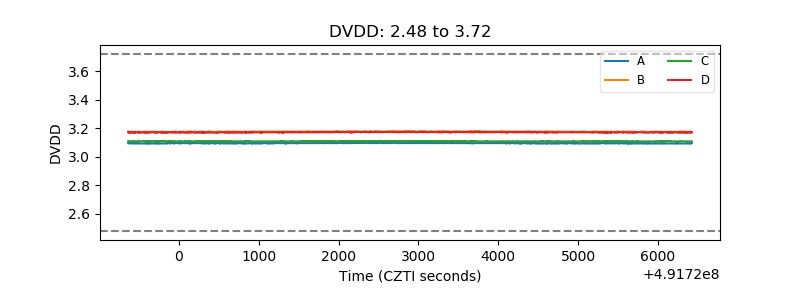 |
| Temperature 1 | 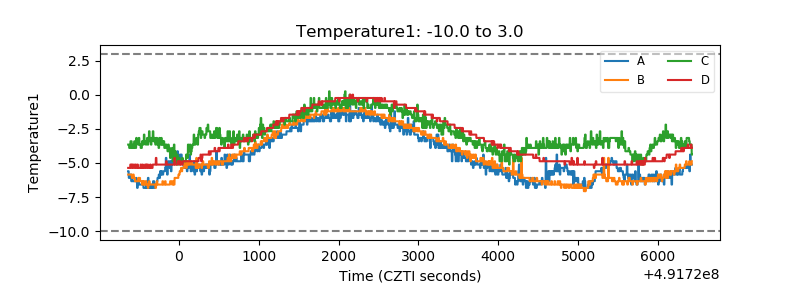 |
| Veto HV Monitor | 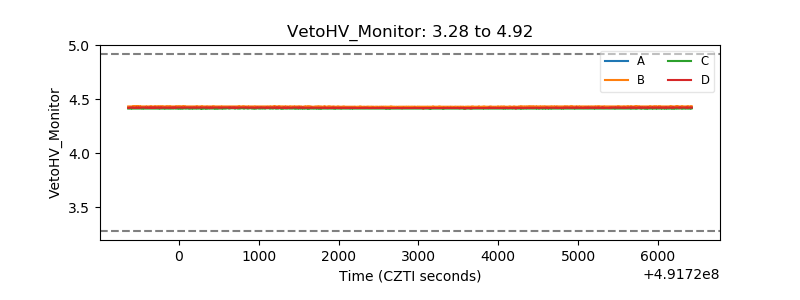 |
| Veto LLD | 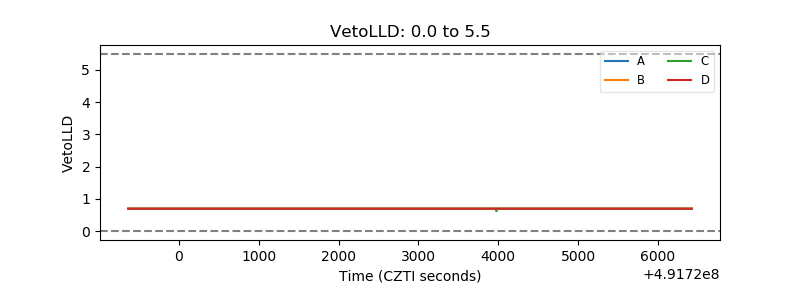 |
| Alpha Counter |  |
| _CPM_Rate | 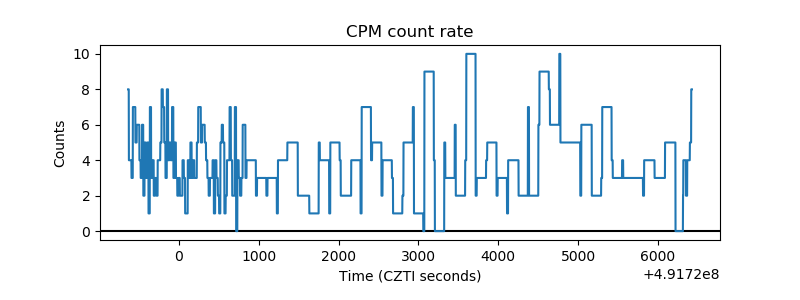 |
| CZT Counter | 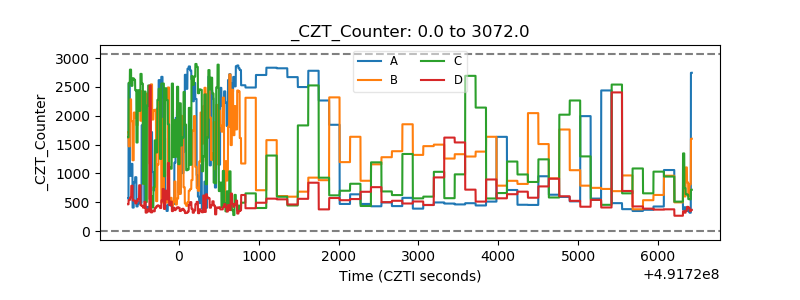 |
| +2.5 Volts monitor | 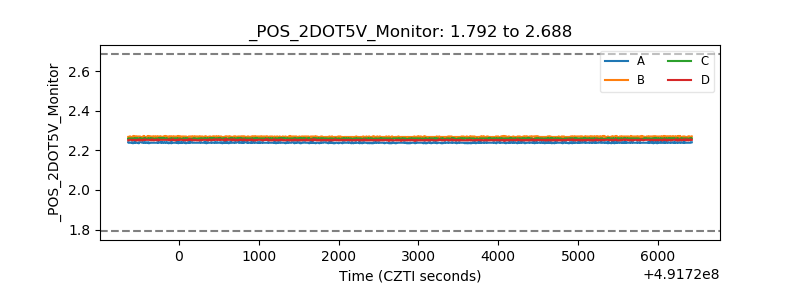 |
| +5 Volts monitor | 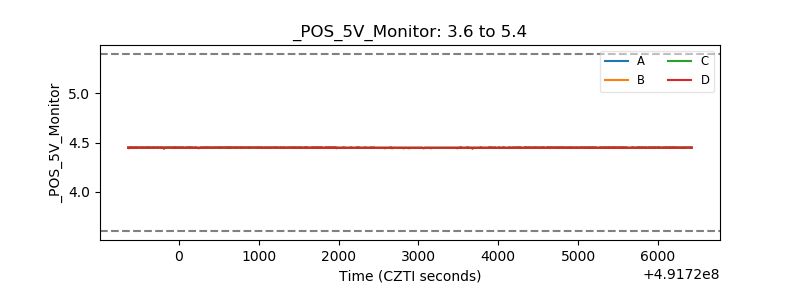 |
| _ROLL_ROT | 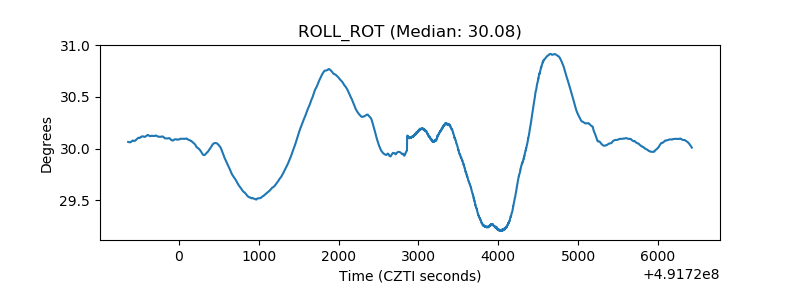 |
| _Roll_DEC | 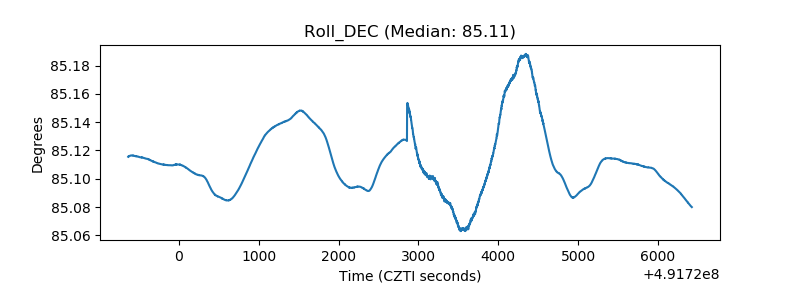 |
| _Roll_RA | 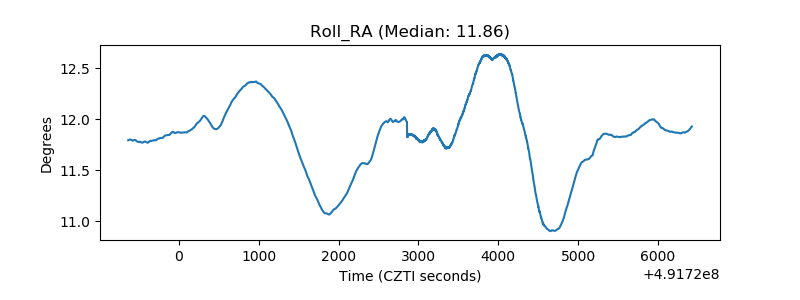 |
| Veto Counter | 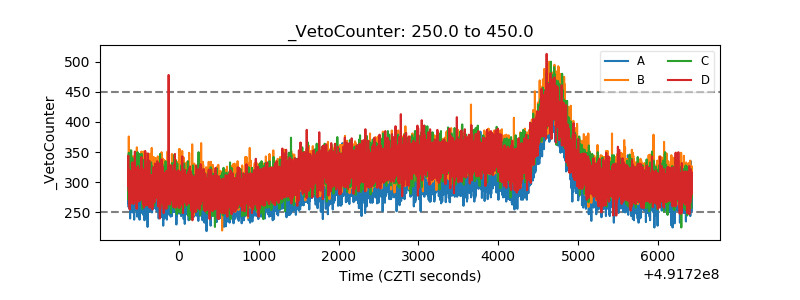 |