| Param | Original file | Final file |
|---|---|---|
| Filename | modeM0/AS1C09_011T08_9000006492_53243cztM0_level2.fits | modeM0/AS1C09_011T08_9000006492_53243cztM0_level2_quad_clean.evt |
| Size (bytes) | 683,665,920 | 103,835,520 |
| Size | 652.0 MB | 99.0 MB |
| Events in quadrant A | 4,719,871 | 676,265 |
| Events in quadrant B | 6,678,156 | 716,162 |
| Events in quadrant C | 9,188,861 | 584,766 |
| Events in quadrant D | 4,131,565 | 637,191 |
| Mode M0 | |||
|---|---|---|---|
| Quadrant | BADHDUFLAG | Total packets | Discarded packets |
| A | 0 | 19537 | 0 |
| B | 0 | 25151 | 0 |
| C | 0 | 32564 | 0 |
| D | 0 | 17811 | 0 |
| Mode SS | |||
|---|---|---|---|
| Quadrant | BADHDUFLAG | Total packets | Discarded packets |
| A | 0 | 152 | 0 |
| B | 0 | 152 | 0 |
| C | 0 | 152 | 0 |
| D | 0 | 152 | 0 |
| Quadrant | Total seconds | Saturated seconds | Saturation percentage |
|---|---|---|---|
| A | 7609 | 337 | 4.428966% |
| B | 7610 | 460 | 6.044678% |
| C | 7610 | 1189 | 15.624179% |
| D | 7610 | 50 | 0.657030% |
Noise dominated data is calculated using 1-second bins in cleaned event files. If a bin has >2000 counts, and if more than 50% of those come from <1% of pixels, then it is considered to be noise-dominated and hence unusable.
| Quadrant | # 1 sec bins | Bins with >0 counts | Bins with >2000 counts | High rate bins dominated by noise | Noise dominated (total time) | Noise dominated (detector-on time) | Marked lightcurve |
|---|---|---|---|---|---|---|---|
| A | 7609 | 7609 | 271 | 271 | 3.56% | 3.56% | 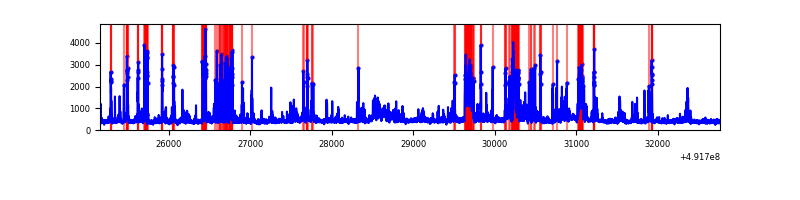 |
| B | 7610 | 7610 | 305 | 305 | 4.01% | 4.01% | 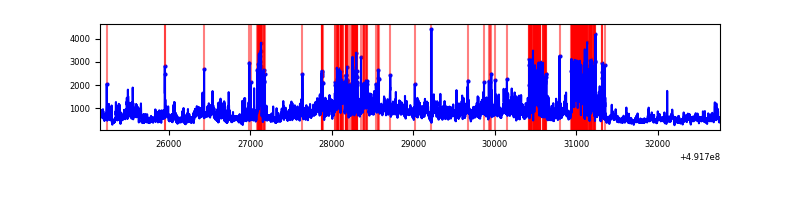 |
| C | 7610 | 7610 | 1132 | 1132 | 14.88% | 14.88% | 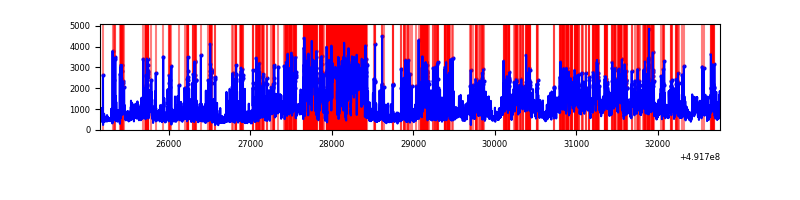 |
| D | 7610 | 7610 | 48 | 48 | 0.63% | 0.63% | 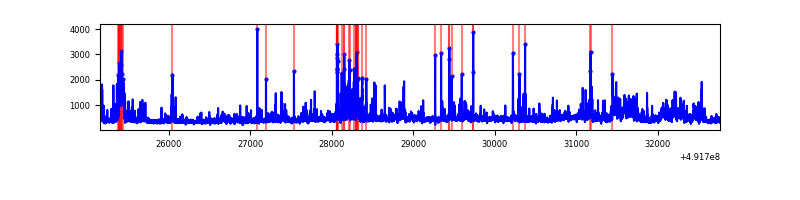 |
Top three noisy pixels from each quadrant. If the there are fewer than three noisy pixels in the level2.evt file, extra rows are filled as -1
| Pixel properties | Quadrant properties | ||||||
|---|---|---|---|---|---|---|---|
| Quadrant | DetID | PixID | Counts | Sigma | Mean | Median | Sigma |
| A | 0 | 8 | 720461 | 3828.92 | 759 | 740 | 188.0 |
| A | 7 | 206 | 427372 | 2269.68 | 759 | 740 | 188.0 |
| A | 3 | 62 | 273181 | 1449.39 | 759 | 740 | 188.0 |
| B | 12 | 33 | 1496484 | 9350.83 | 747 | 721 | 160.0 |
| B | 2 | 249 | 787250 | 4917.02 | 747 | 721 | 160.0 |
| B | 10 | 28 | 678279 | 4235.79 | 747 | 721 | 160.0 |
| C | 15 | 224 | 1989774 | 10366.3 | 697 | 693 | 191.9 |
| C | 15 | 165 | 1803450 | 9395.25 | 697 | 693 | 191.9 |
| C | 1 | 241 | 1497913 | 7802.91 | 697 | 693 | 191.9 |
| D | 0 | 18 | 478113 | 2266.39 | 743 | 707 | 210.6 |
| D | 2 | 252 | 106228 | 500.94 | 743 | 707 | 210.6 |
| D | 12 | 3 | 90271 | 425.19 | 743 | 707 | 210.6 |
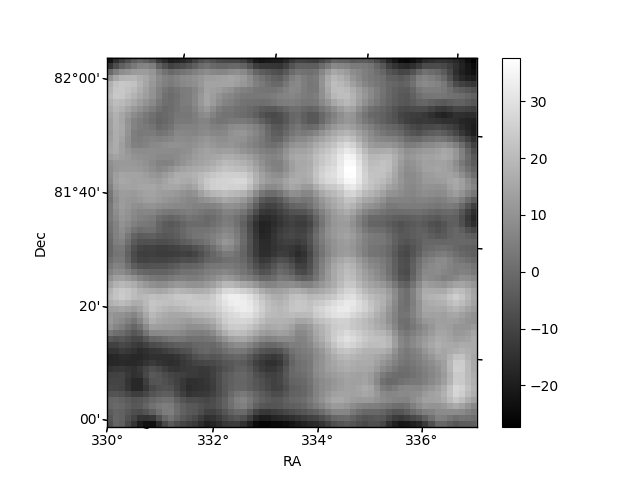
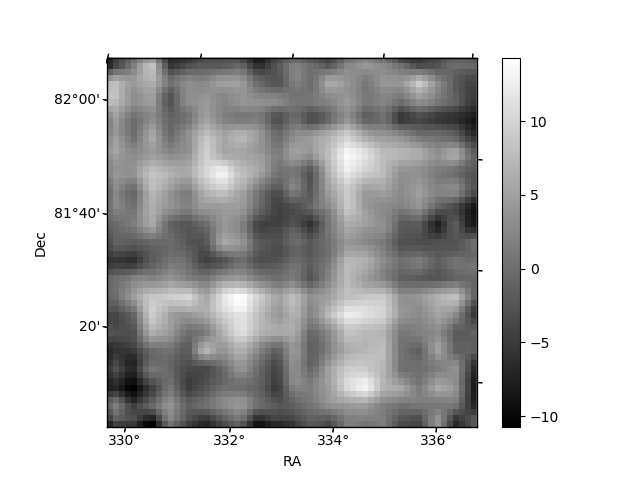
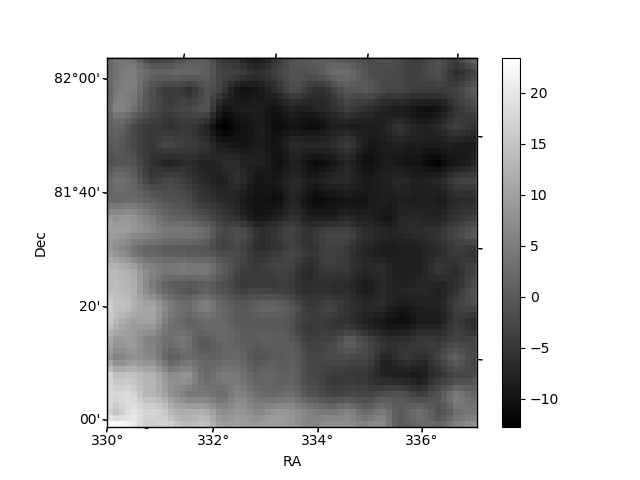
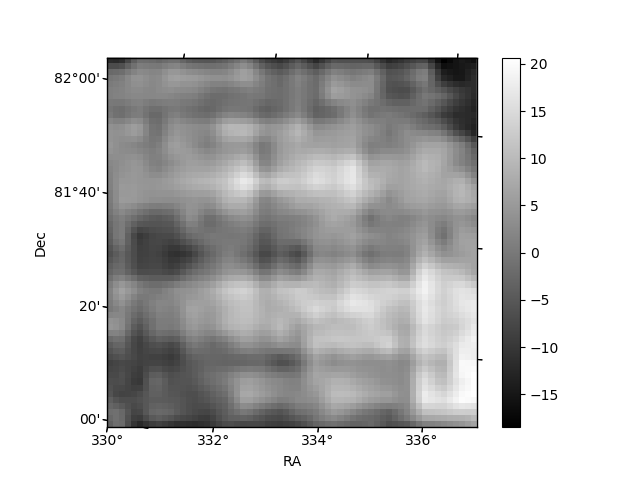
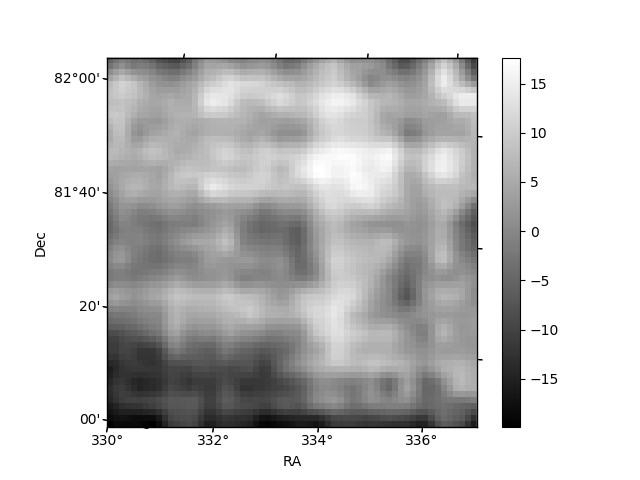
Histogram calculated using DETX and DETY for each event in the final _common_clean file
| Quadrant A | 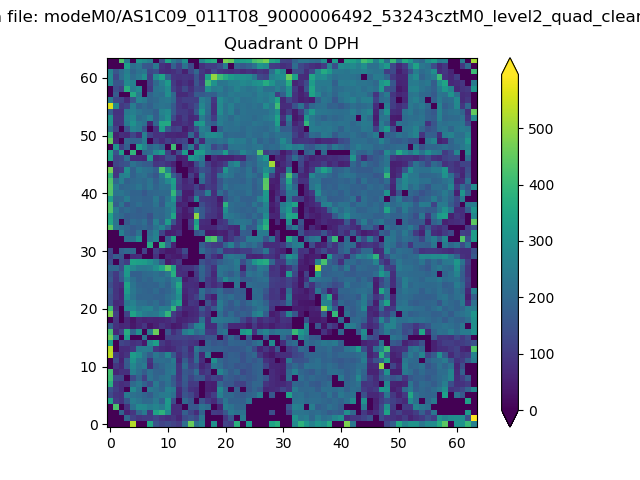 |
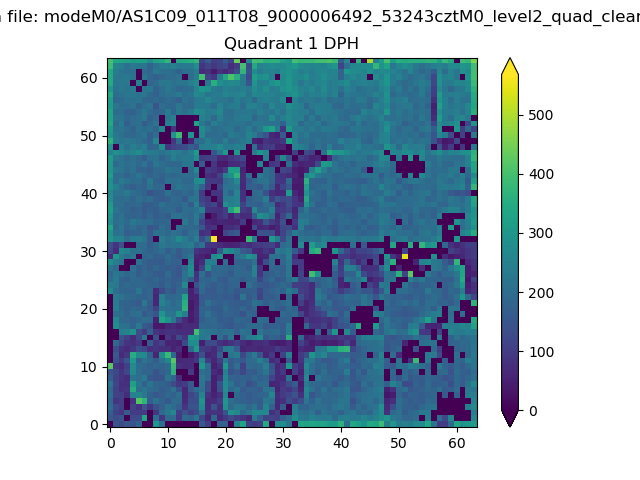 |
Quadrant B |
|---|---|---|---|
| Quadrant D |  |
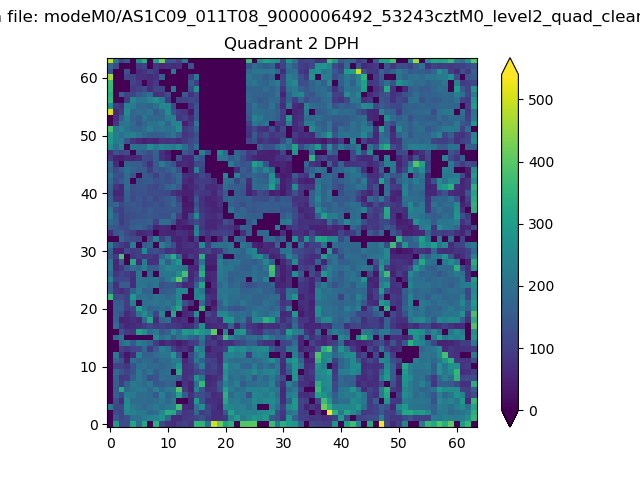 |
Quadrant C |
| Plot type | Count rate plots | Images |
|---|---|---|
| Comparison with Poisson distribution Blue bars denote a histogram of data divided into 1 sec bins. Red curve is a Poisson curve with rate = median count rate of data. |
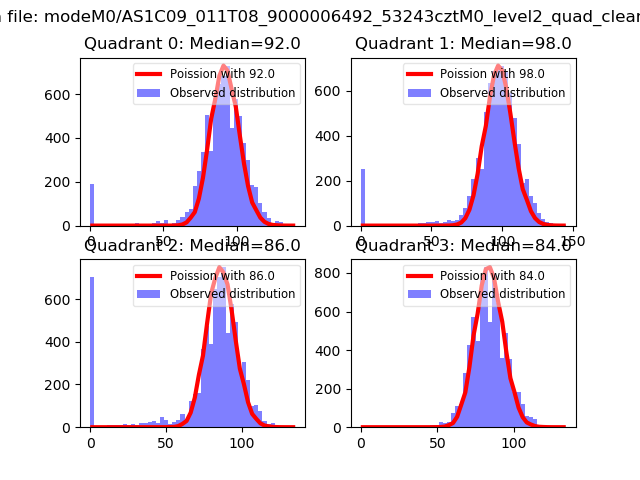 |
 |
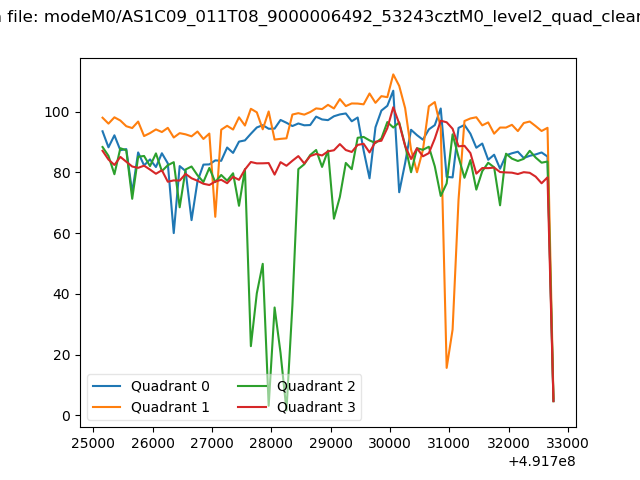
| Quadrant-wise count rates Data is divided into 100 sec bins |
 |
|
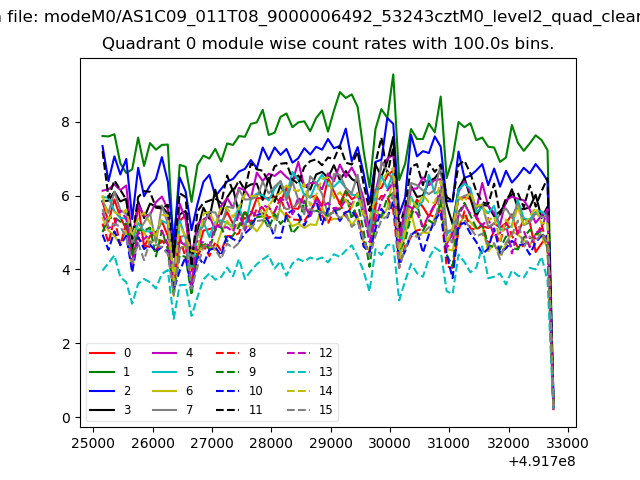
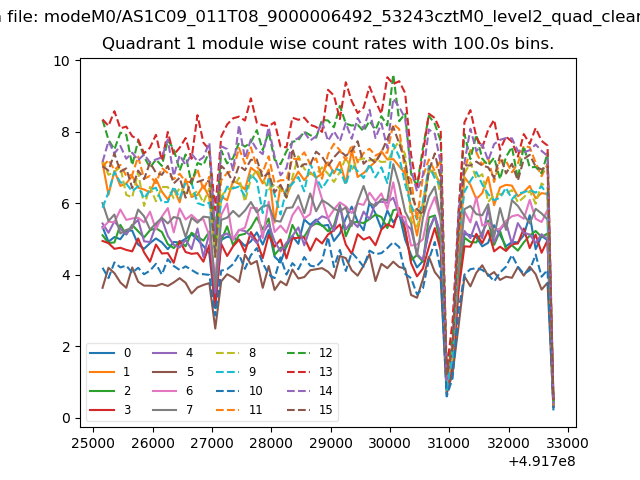
| Module-wise count rates for Quadrant A Data is divided into 100 sec bins |
 |
 |
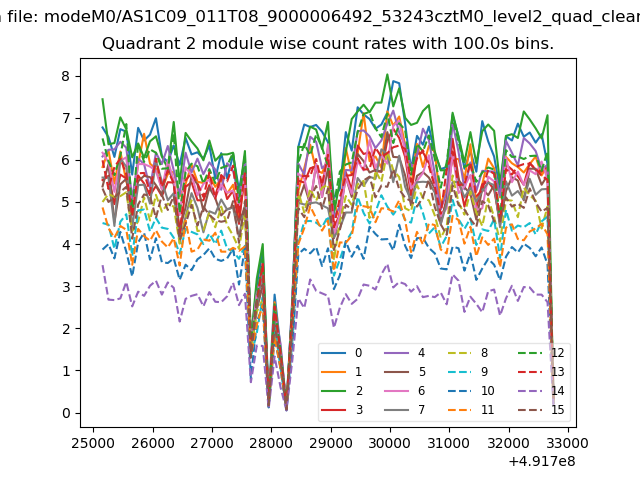
| Module-wise count rates for Quadrant B Data is divided into 100 sec bins |
 |
 |
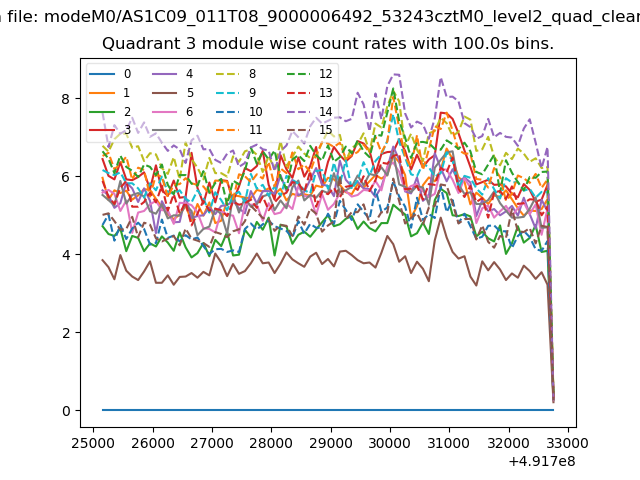
| Module-wise count rates for Quadrant C Data is divided into 100 sec bins |
 |
 |
| Module-wise count rates for Quadrant D Data is divided into 100 sec bins |
 |
 |
| Parameter | Plot |
|---|---|
| CZT HV Monitor | 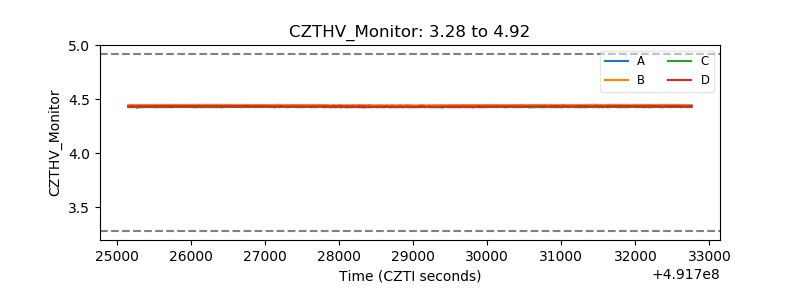 |
| D_VDD | 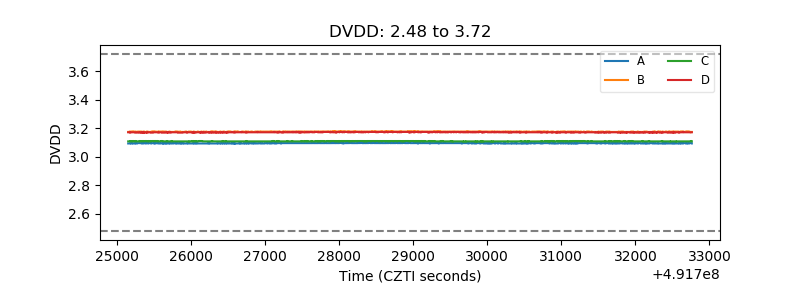 |
| Temperature 1 | 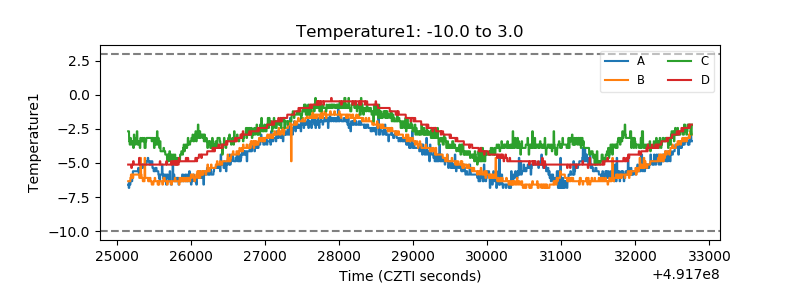 |
| Veto HV Monitor | 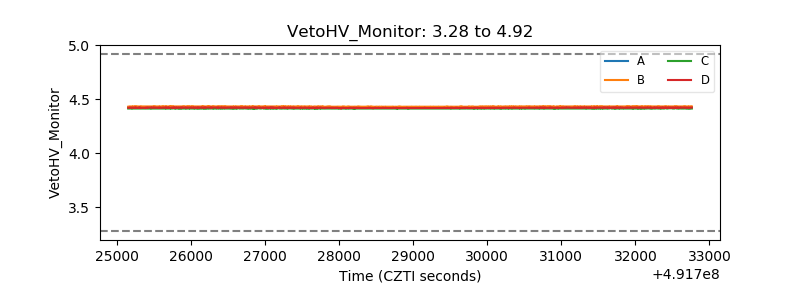 |
| Veto LLD | 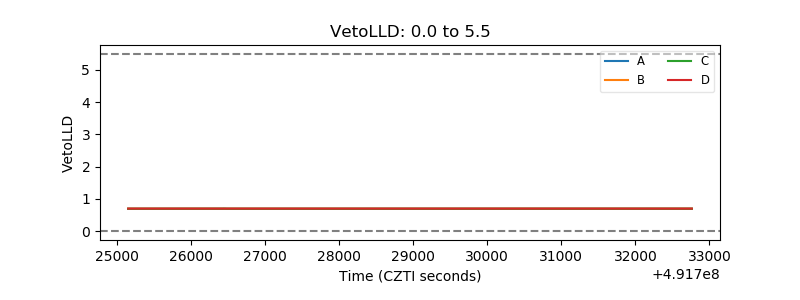 |
| Alpha Counter | 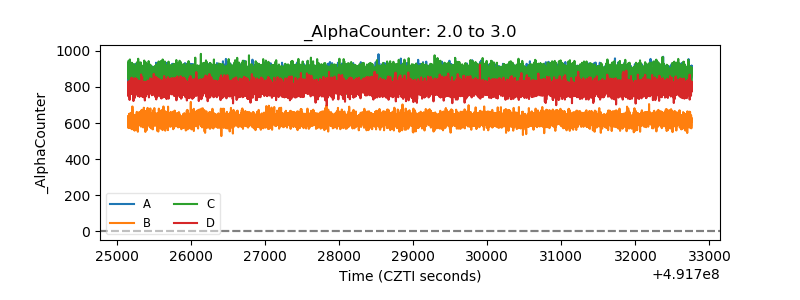 |
| _CPM_Rate | 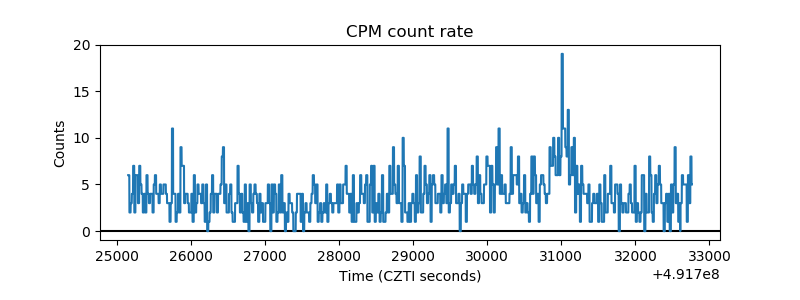 |
| CZT Counter | 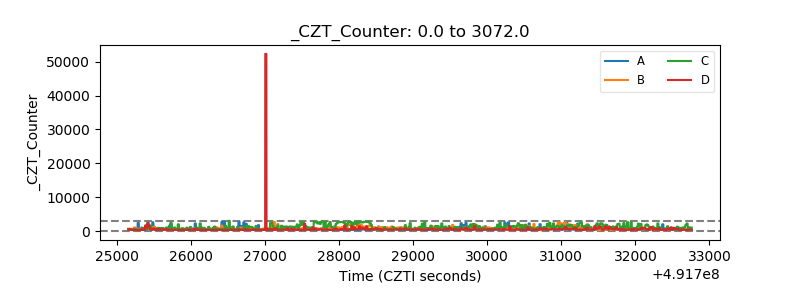 |
| +2.5 Volts monitor |  |
| +5 Volts monitor |  |
| _ROLL_ROT | 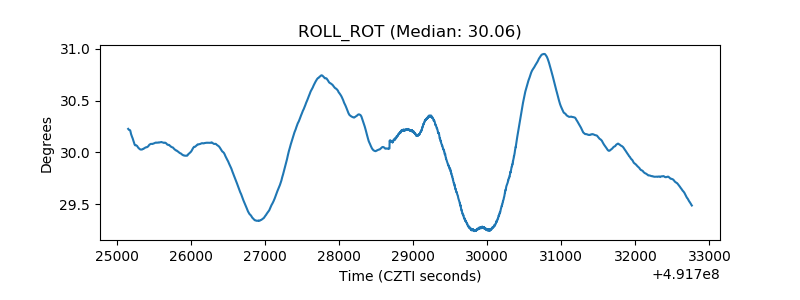 |
| _Roll_DEC | 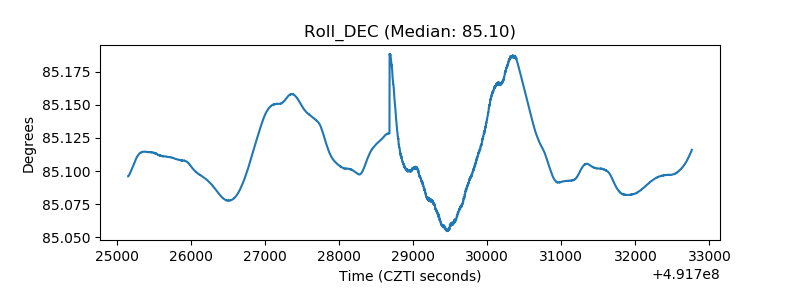 |
| _Roll_RA | 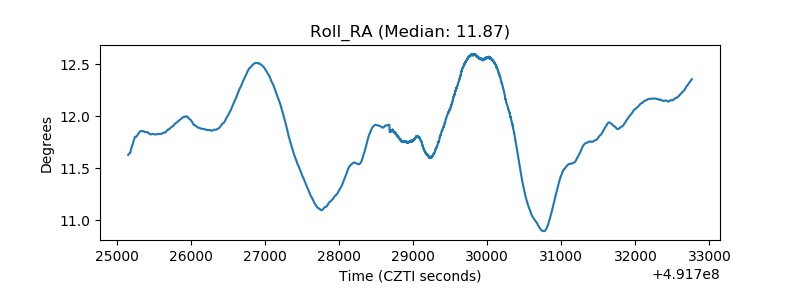 |
| Veto Counter | 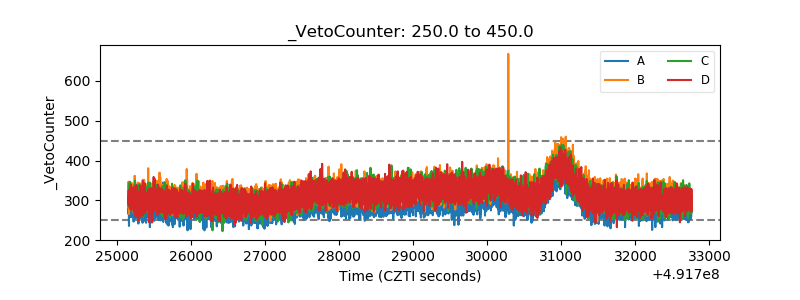 |