| Param | Original file | Final file |
|---|---|---|
| Filename | modeM0/AS1C09_011T08_9000006492_53246cztM0_level2.fits | modeM0/AS1C09_011T08_9000006492_53246cztM0_level2_quad_clean.evt |
| Size (bytes) | 1,487,931,840 | 174,686,400 |
| Size | 1.4 GB | 166.6 MB |
| Events in quadrant A | 9,495,125 | 1,225,142 |
| Events in quadrant B | 10,377,941 | 1,369,541 |
| Events in quadrant C | 25,523,603 | 572,041 |
| Events in quadrant D | 8,598,877 | 1,154,032 |
| Mode M0 | |||
|---|---|---|---|
| Quadrant | BADHDUFLAG | Total packets | Discarded packets |
| A | 0 | 38138 | 1 |
| B | 0 | 40553 | 1 |
| C | 0 | 85628 | 1 |
| D | 0 | 35385 | 1 |
| Mode M9 | |||
|---|---|---|---|
| Quadrant | BADHDUFLAG | Total packets | Discarded packets |
| A | 0 | 2 | 0 |
| B | 0 | 2 | 0 |
| C | 0 | 2 | 0 |
| D | 0 | 2 | 0 |
| Mode SS | |||
|---|---|---|---|
| Quadrant | BADHDUFLAG | Total packets | Discarded packets |
| A | 0 | 282 | 0 |
| B | 0 | 282 | 0 |
| C | 0 | 282 | 0 |
| D | 0 | 282 | 0 |
| Quadrant | Total seconds | Saturated seconds | Saturation percentage |
|---|---|---|---|
| A | 14017 | 974 | 6.948705% |
| B | 14016 | 506 | 3.610160% |
| C | 14016 | 7686 | 54.837329% |
| D | 14017 | 321 | 2.290076% |
Noise dominated data is calculated using 1-second bins in cleaned event files. If a bin has >2000 counts, and if more than 50% of those come from <1% of pixels, then it is considered to be noise-dominated and hence unusable.
| Quadrant | # 1 sec bins | Bins with >0 counts | Bins with >2000 counts | High rate bins dominated by noise | Noise dominated (total time) | Noise dominated (detector-on time) | Marked lightcurve |
|---|---|---|---|---|---|---|---|
| A | 14282 | 14018 | 734 | 734 | 5.14% | 5.24% | 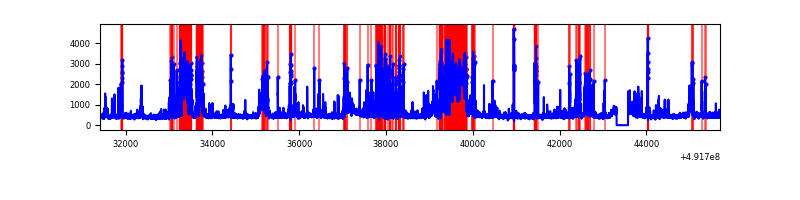 |
| B | 14281 | 14017 | 282 | 282 | 1.97% | 2.01% | 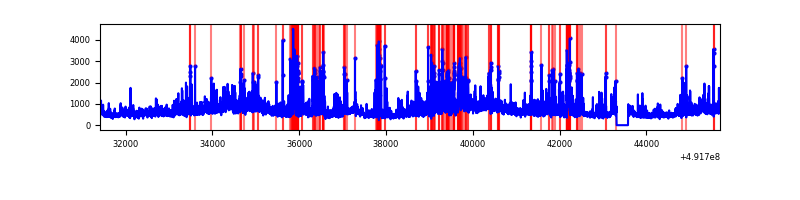 |
| C | 14281 | 14016 | 7128 | 7128 | 49.91% | 50.86% | 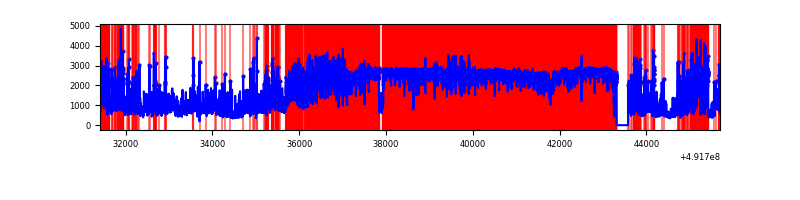 |
| D | 14282 | 14018 | 179 | 179 | 1.25% | 1.28% | 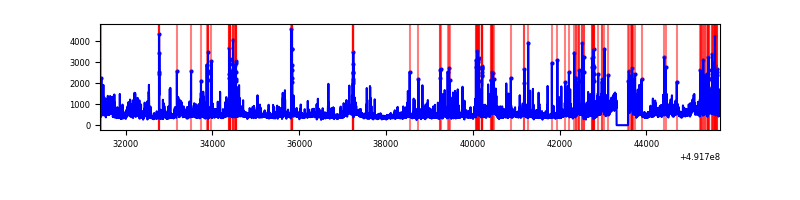 |
Top three noisy pixels from each quadrant. If the there are fewer than three noisy pixels in the level2.evt file, extra rows are filled as -1
| Pixel properties | Quadrant properties | ||||||
|---|---|---|---|---|---|---|---|
| Quadrant | DetID | PixID | Counts | Sigma | Mean | Median | Sigma |
| A | 7 | 206 | 1642219 | 4606.56 | 1435 | 1402 | 356.2 |
| A | 14 | 254 | 392257 | 1097.32 | 1435 | 1402 | 356.2 |
| A | 0 | 8 | 339287 | 948.61 | 1435 | 1402 | 356.2 |
| B | 12 | 33 | 2351894 | 7746.06 | 1433 | 1381 | 303.4 |
| B | 2 | 249 | 670502 | 2205.07 | 1433 | 1381 | 303.4 |
| B | 12 | 17 | 383222 | 1258.35 | 1433 | 1381 | 303.4 |
| C | 15 | 165 | 18205129 | 75403.26 | 873 | 866 | 241.4 |
| C | 15 | 224 | 1203175 | 4980.04 | 873 | 866 | 241.4 |
| C | 15 | 198 | 761760 | 3151.67 | 873 | 866 | 241.4 |
| D | 0 | 18 | 902048 | 2261.48 | 1412 | 1348 | 398.3 |
| D | 2 | 37 | 404446 | 1012.1 | 1412 | 1348 | 398.3 |
| D | 10 | 172 | 272311 | 680.33 | 1412 | 1348 | 398.3 |
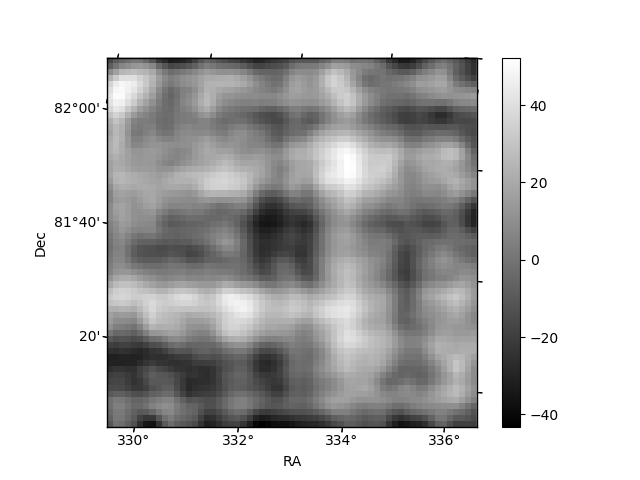
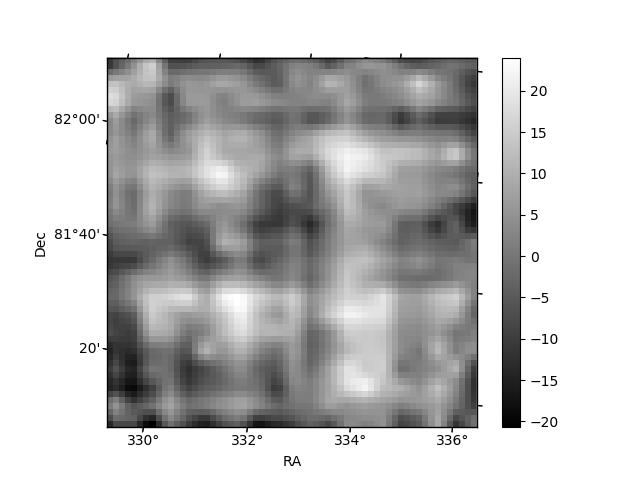
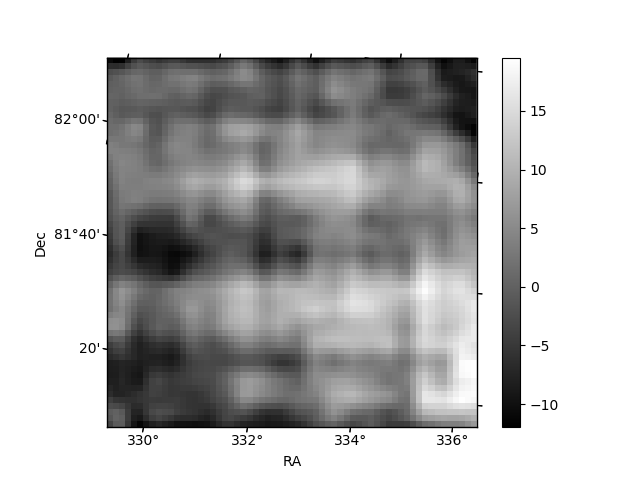
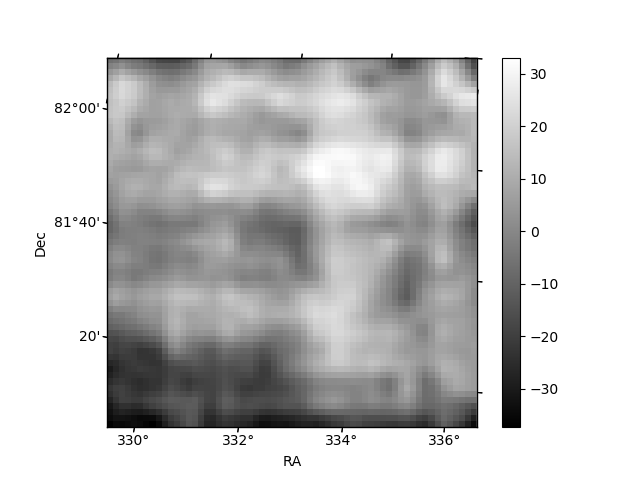
Histogram calculated using DETX and DETY for each event in the final _common_clean file
| Quadrant A | 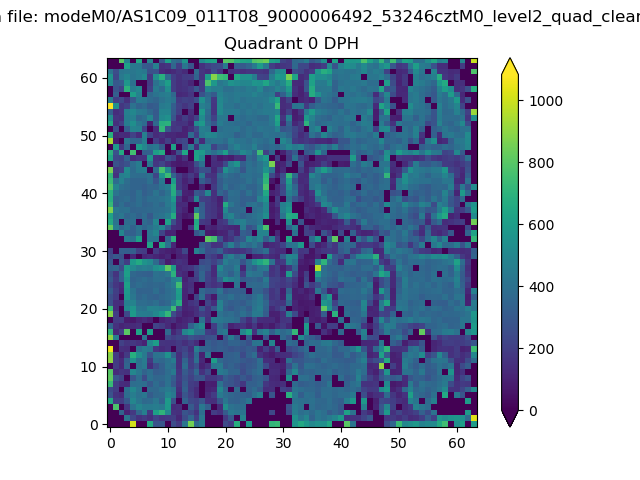 |
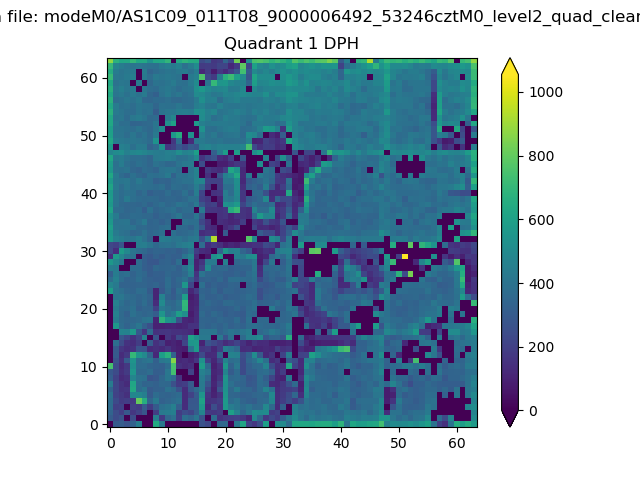 |
Quadrant B |
|---|---|---|---|
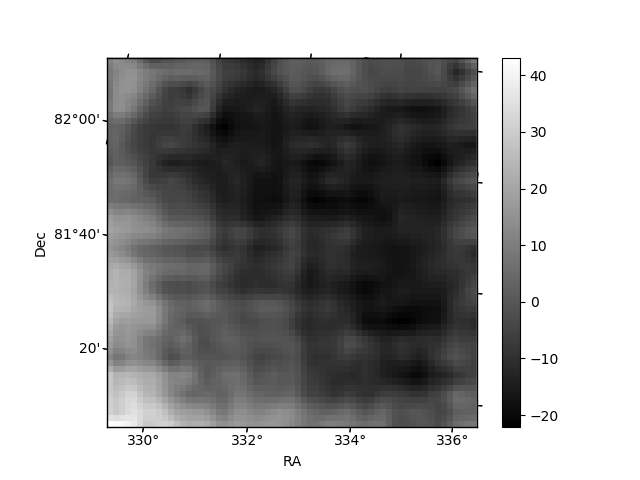
| Quadrant D | 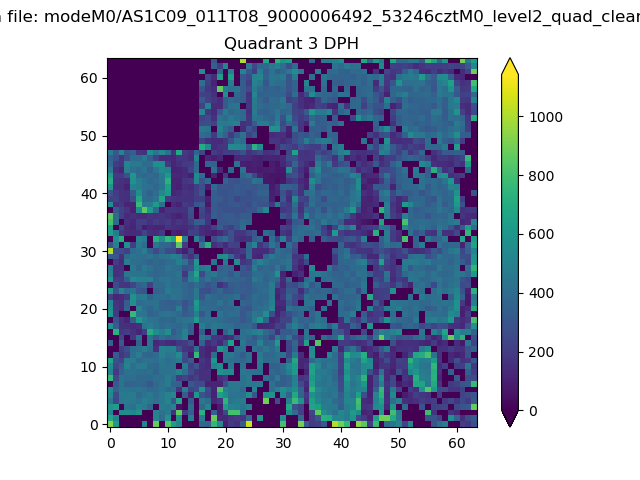 |
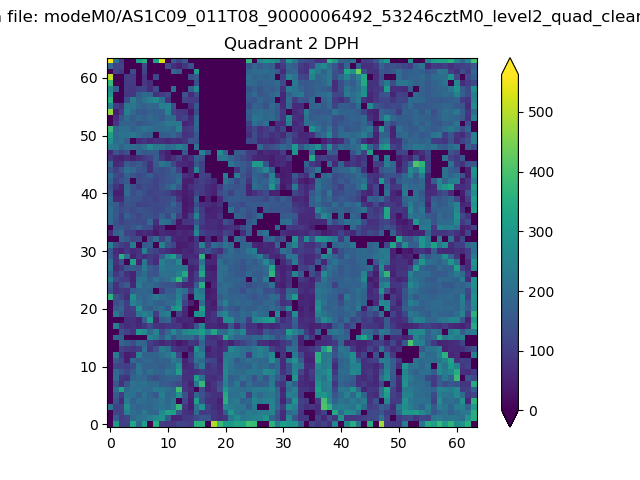 |
Quadrant C |
| Plot type | Count rate plots | Images |
|---|---|---|
| Comparison with Poisson distribution Blue bars denote a histogram of data divided into 1 sec bins. Red curve is a Poisson curve with rate = median count rate of data. |
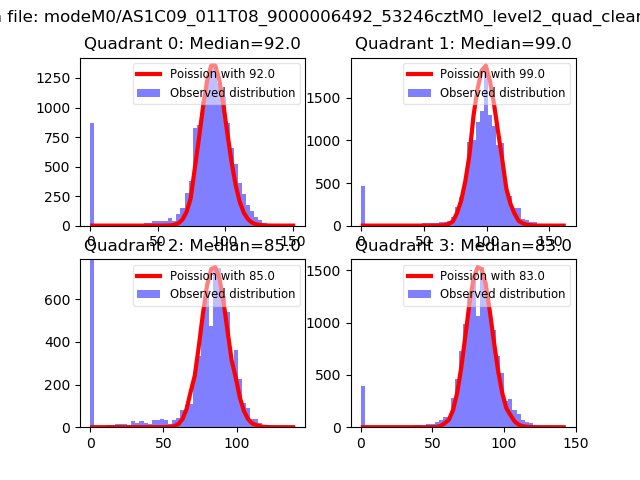 |
 |
| Quadrant-wise count rates Data is divided into 100 sec bins |
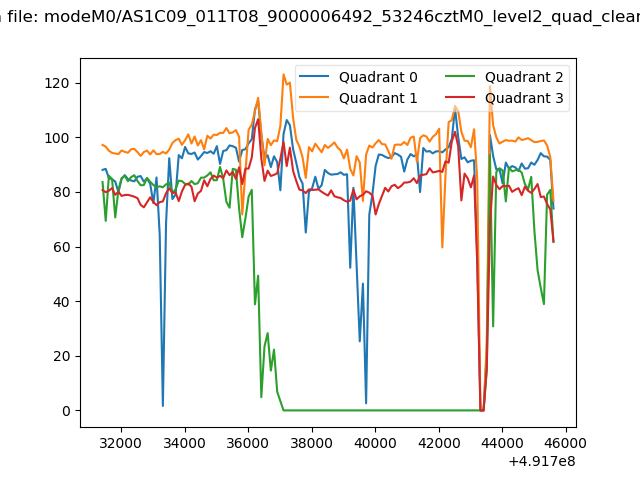 |
|
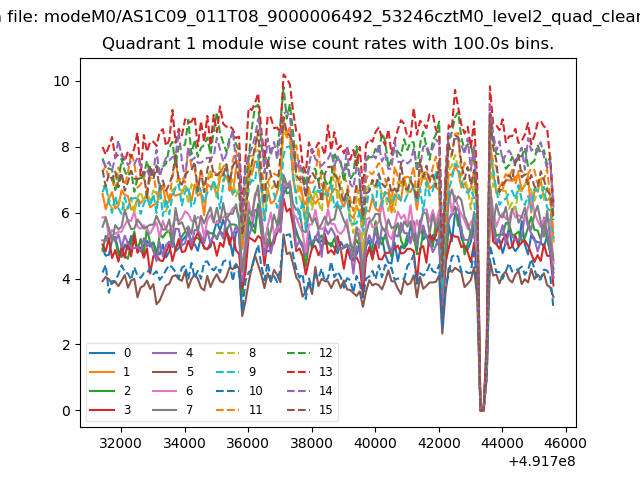
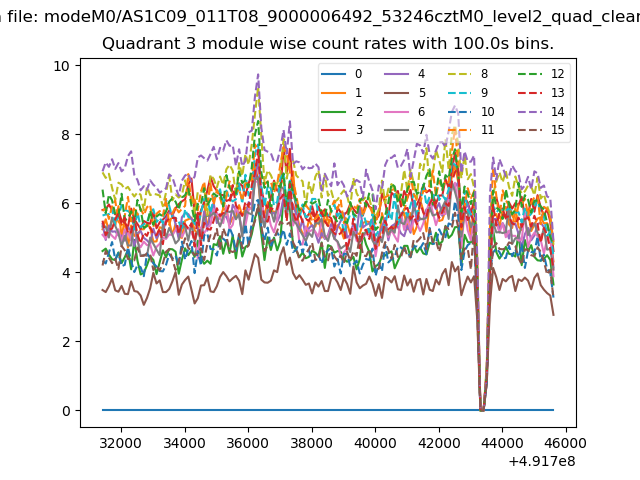
| Module-wise count rates for Quadrant A Data is divided into 100 sec bins |
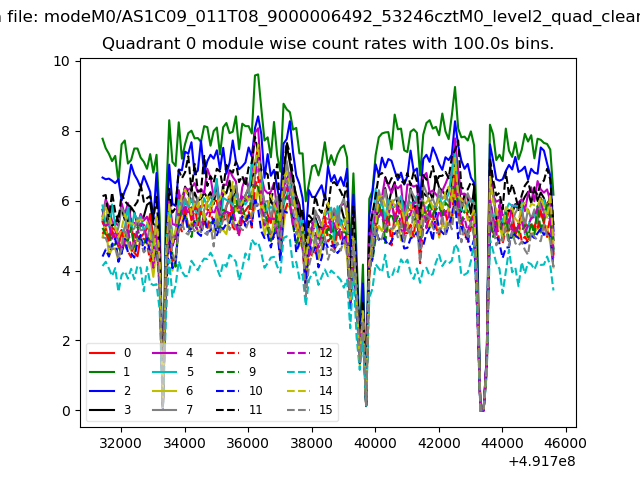 |
 |
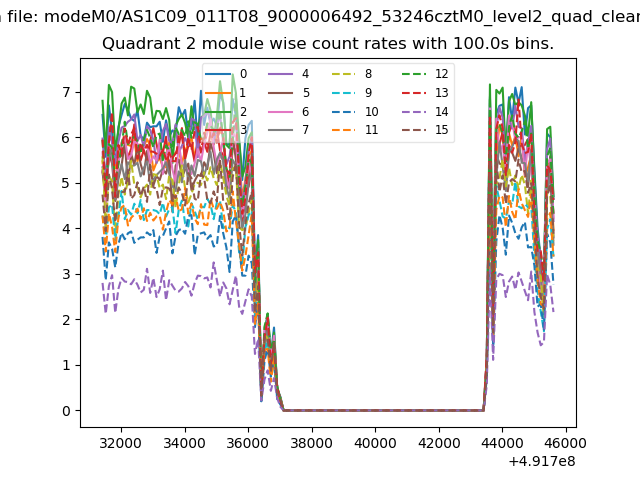
| Module-wise count rates for Quadrant B Data is divided into 100 sec bins |
 |
 |
| Module-wise count rates for Quadrant C Data is divided into 100 sec bins |
 |
 |
| Module-wise count rates for Quadrant D Data is divided into 100 sec bins |
 |
 |
| Parameter | Plot |
|---|---|
| CZT HV Monitor |  |
| D_VDD | 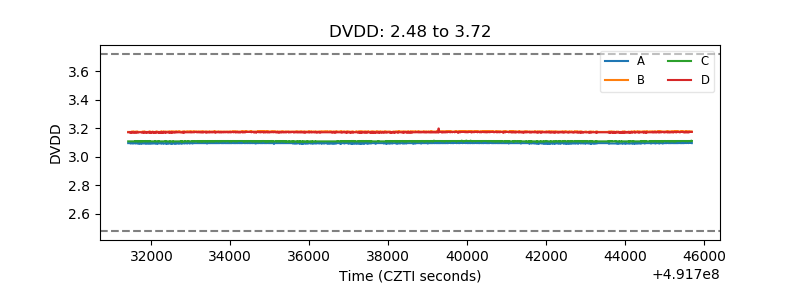 |
| Temperature 1 | 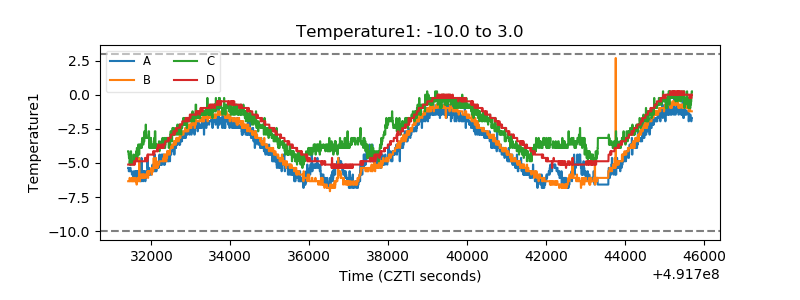 |
| Veto HV Monitor | 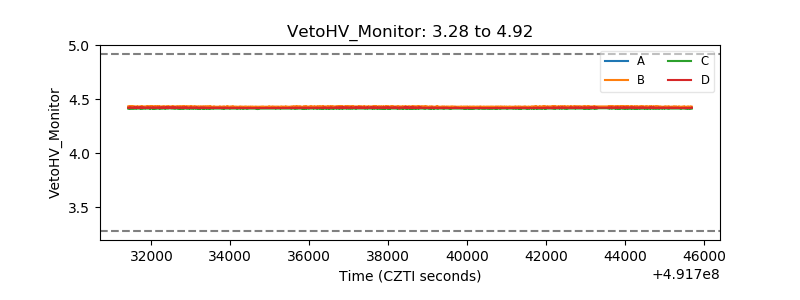 |
| Veto LLD | 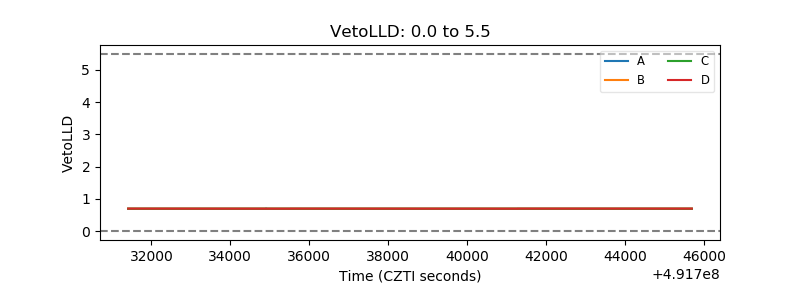 |
| Alpha Counter | 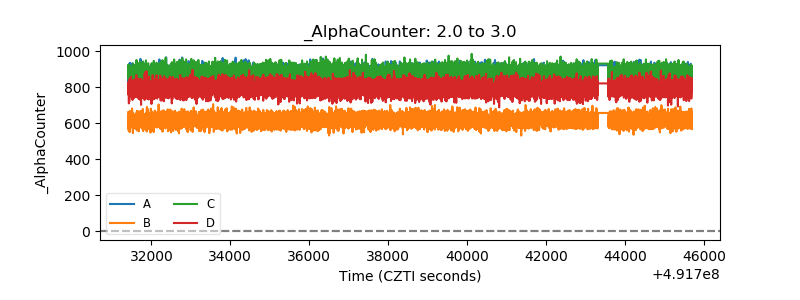 |
| _CPM_Rate | 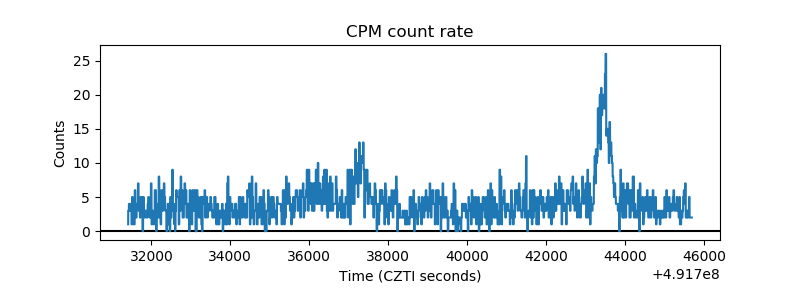 |
| CZT Counter | 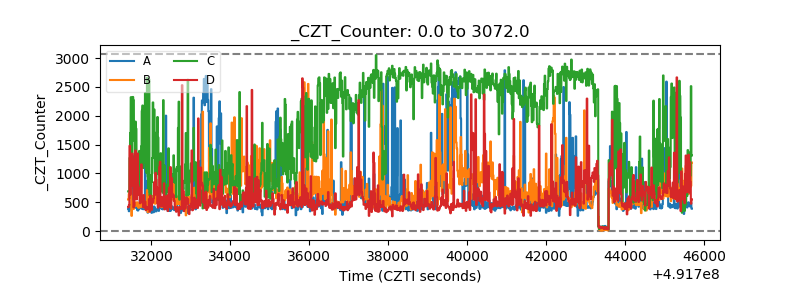 |
| +2.5 Volts monitor |  |
| +5 Volts monitor | 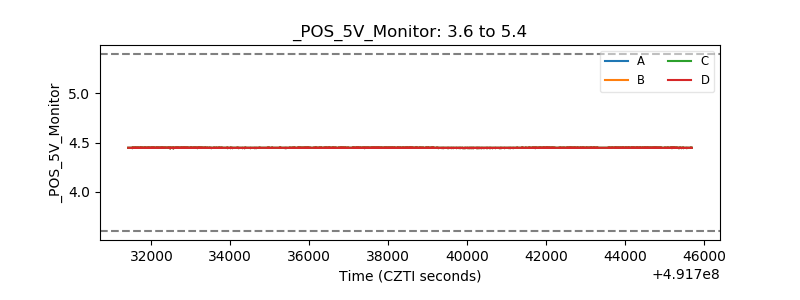 |
| _ROLL_ROT | 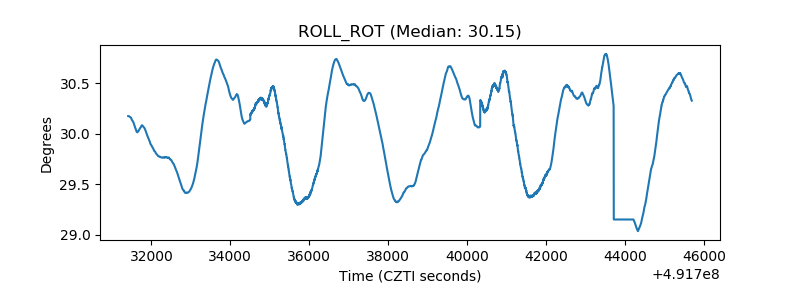 |
| _Roll_DEC | 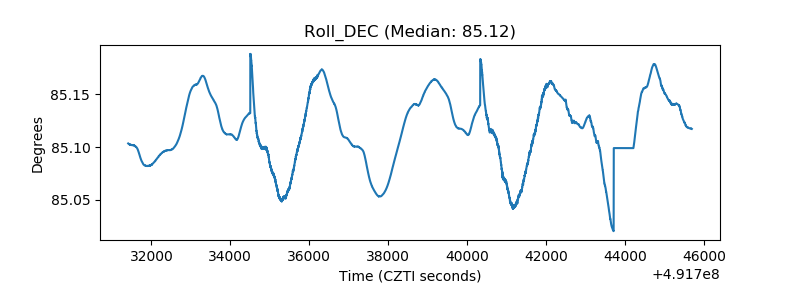 |
| _Roll_RA | 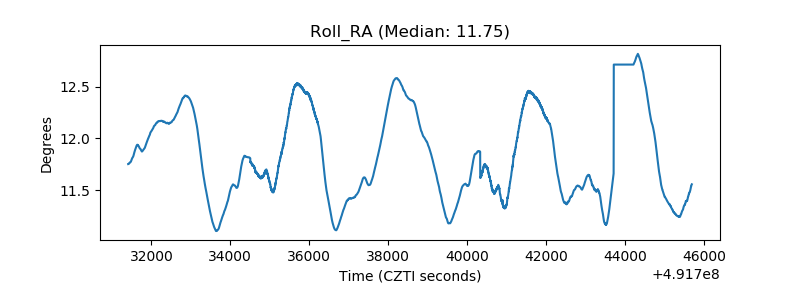 |
| Veto Counter | 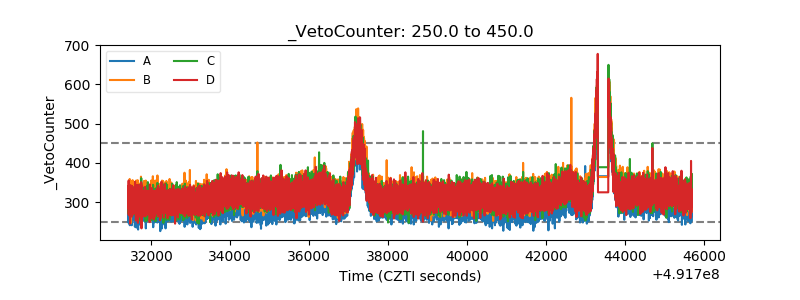 |