| Param | Original file | Final file |
|---|---|---|
| Filename | modeM0/AS1C09_011T08_9000006492_53247cztM0_level2.fits | modeM0/AS1C09_011T08_9000006492_53247cztM0_level2_quad_clean.evt |
| Size (bytes) | 1,317,502,080 | 138,821,760 |
| Size | 1.2 GB | 132.4 MB |
| Events in quadrant A | 11,129,588 | 863,951 |
| Events in quadrant B | 8,170,955 | 1,116,602 |
| Events in quadrant C | 20,494,299 | 512,891 |
| Events in quadrant D | 8,097,838 | 923,358 |
| Mode M0 | |||
|---|---|---|---|
| Quadrant | BADHDUFLAG | Total packets | Discarded packets |
| A | 0 | 40778 | 2 |
| B | 0 | 32019 | 2 |
| C | 0 | 68711 | 2 |
| D | 0 | 31855 | 3 |
| Mode M9 | |||
|---|---|---|---|
| Quadrant | BADHDUFLAG | Total packets | Discarded packets |
| A | 0 | 14 | 0 |
| B | 0 | 14 | 0 |
| C | 0 | 14 | 0 |
| D | 0 | 14 | 0 |
| Mode SS | |||
|---|---|---|---|
| Quadrant | BADHDUFLAG | Total packets | Discarded packets |
| A | 0 | 230 | 0 |
| B | 0 | 230 | 0 |
| C | 0 | 230 | 0 |
| D | 0 | 230 | 0 |
| Quadrant | Total seconds | Saturated seconds | Saturation percentage |
|---|---|---|---|
| A | 11359 | 2374 | 20.899727% |
| B | 11360 | 280 | 2.464789% |
| C | 11360 | 5925 | 52.156690% |
| D | 11359 | 579 | 5.097280% |
Noise dominated data is calculated using 1-second bins in cleaned event files. If a bin has >2000 counts, and if more than 50% of those come from <1% of pixels, then it is considered to be noise-dominated and hence unusable.
| Quadrant | # 1 sec bins | Bins with >0 counts | Bins with >2000 counts | High rate bins dominated by noise | Noise dominated (total time) | Noise dominated (detector-on time) | Marked lightcurve |
|---|---|---|---|---|---|---|---|
| A | 12724 | 11361 | 1920 | 1920 | 15.09% | 16.90% | 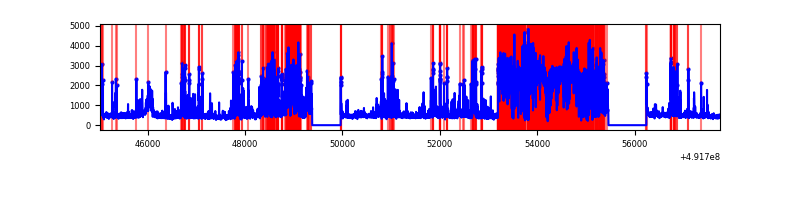 |
| B | 12725 | 11362 | 159 | 159 | 1.25% | 1.40% | 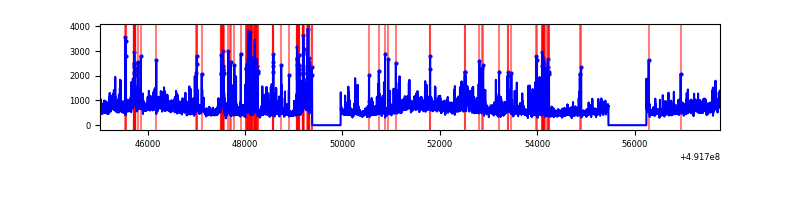 |
| C | 12725 | 11360 | 5376 | 5376 | 42.25% | 47.32% | 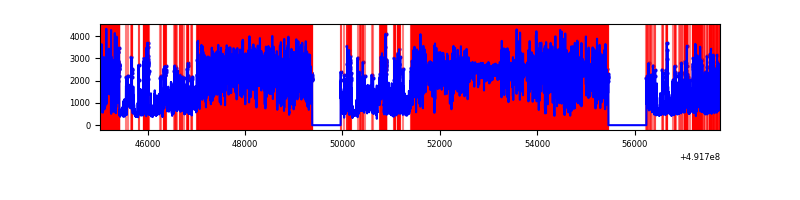 |
| D | 12724 | 11361 | 467 | 467 | 3.67% | 4.11% | 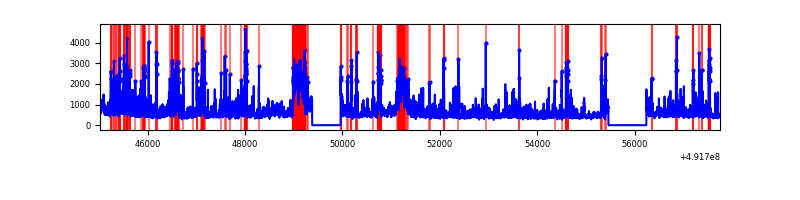 |
Top three noisy pixels from each quadrant. If the there are fewer than three noisy pixels in the level2.evt file, extra rows are filled as -1
| Pixel properties | Quadrant properties | ||||||
|---|---|---|---|---|---|---|---|
| Quadrant | DetID | PixID | Counts | Sigma | Mean | Median | Sigma |
| A | 8 | 230 | 4458551 | 17281.14 | 1036 | 1011 | 257.9 |
| A | 3 | 62 | 1011909 | 3919.08 | 1036 | 1011 | 257.9 |
| A | 0 | 8 | 513097 | 1985.27 | 1036 | 1011 | 257.9 |
| B | 12 | 33 | 1631332 | 6633.31 | 1164 | 1126 | 245.8 |
| B | 2 | 249 | 570348 | 2316.16 | 1164 | 1126 | 245.8 |
| B | 4 | 170 | 387655 | 1572.79 | 1164 | 1126 | 245.8 |
| C | 15 | 165 | 12453706 | 53033.69 | 851 | 842 | 234.8 |
| C | 4 | 5 | 1757021 | 7479.14 | 851 | 842 | 234.8 |
| C | 15 | 224 | 925267 | 3936.9 | 851 | 842 | 234.8 |
| D | 2 | 37 | 1145662 | 3542.94 | 1139 | 1090 | 323.1 |
| D | 0 | 18 | 472860 | 1460.33 | 1139 | 1090 | 323.1 |
| D | 2 | 120 | 345468 | 1066.0 | 1139 | 1090 | 323.1 |
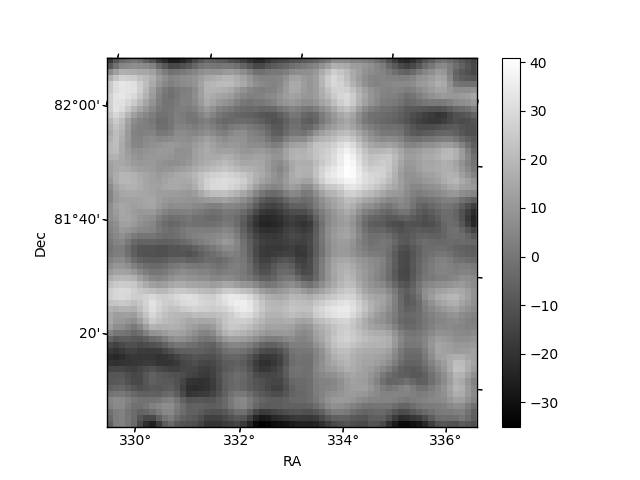
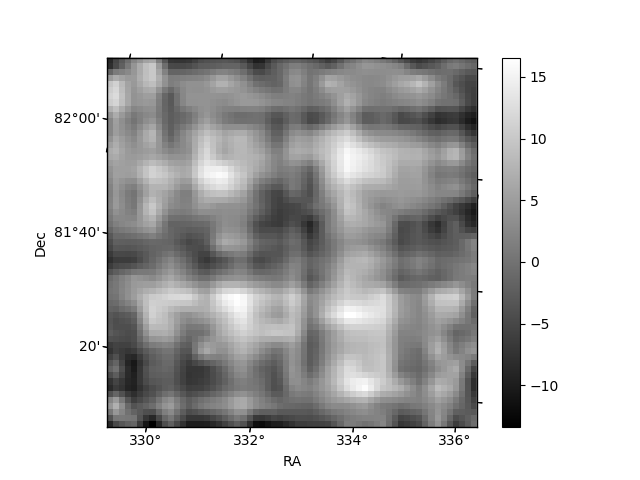
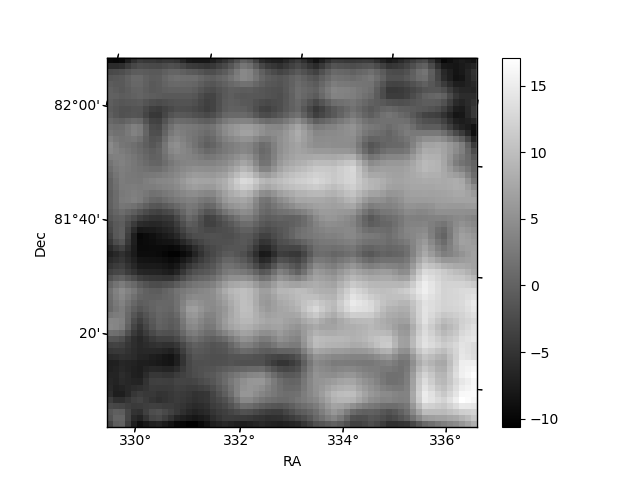
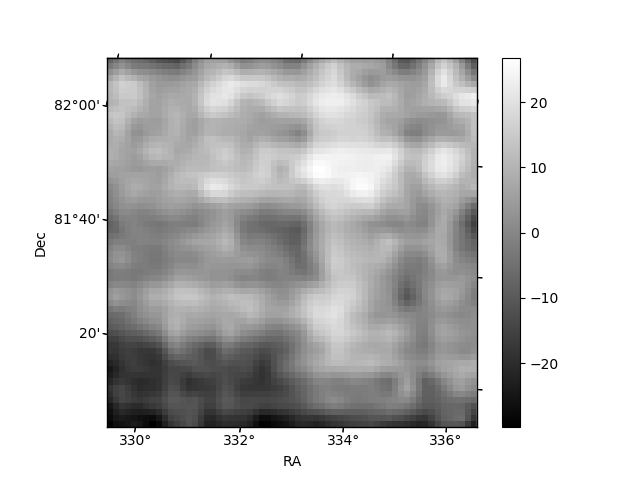
Histogram calculated using DETX and DETY for each event in the final _common_clean file
| Quadrant A | 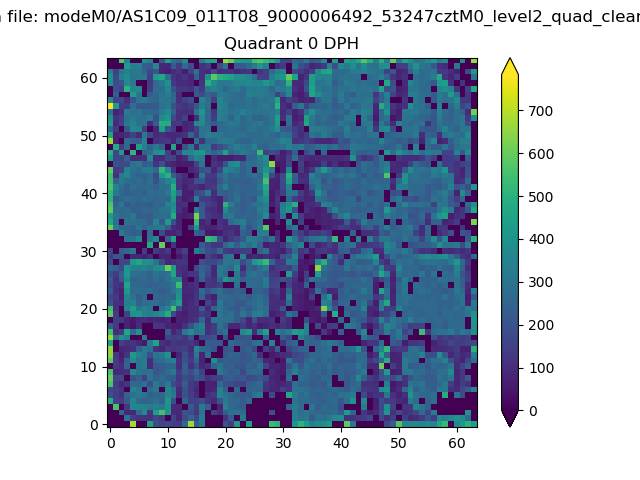 |
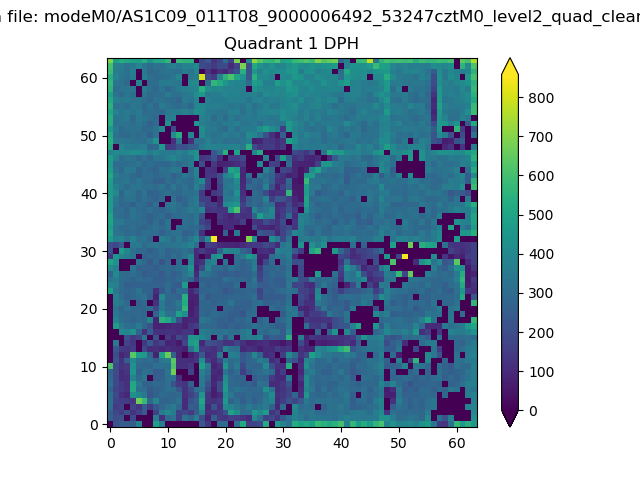 |
Quadrant B |
|---|---|---|---|
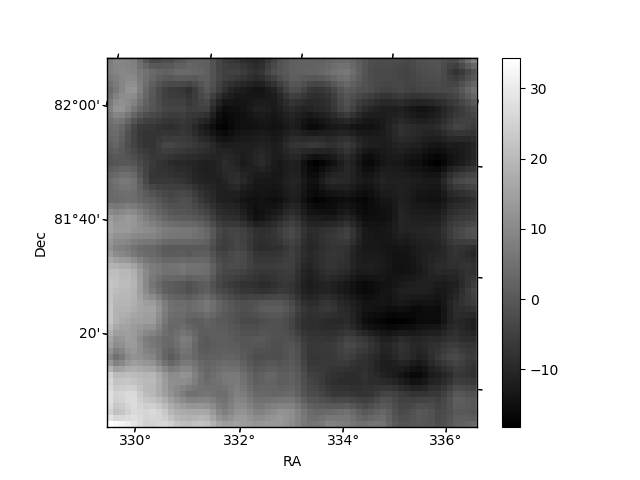
| Quadrant D | 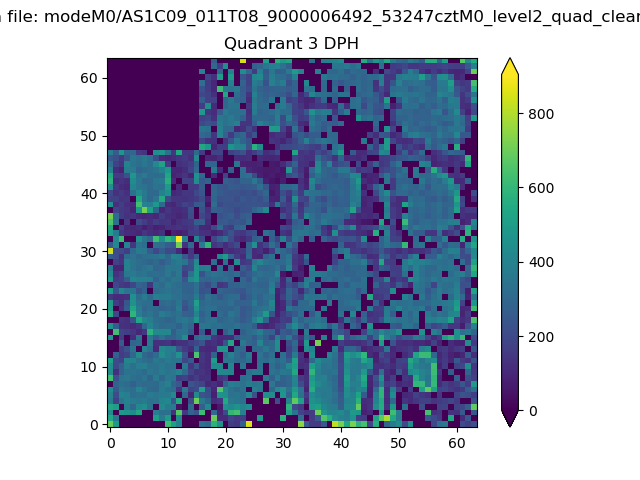 |
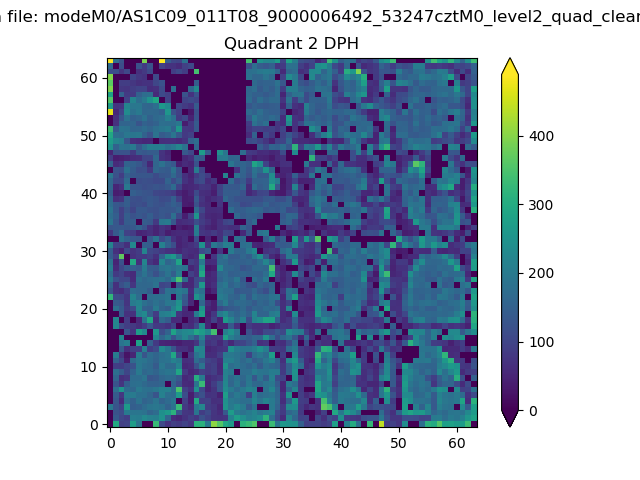 |
Quadrant C |
| Plot type | Count rate plots | Images |
|---|---|---|
| Comparison with Poisson distribution Blue bars denote a histogram of data divided into 1 sec bins. Red curve is a Poisson curve with rate = median count rate of data. |
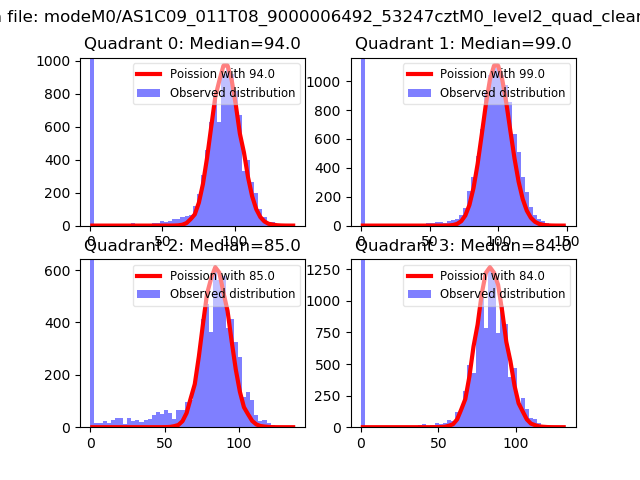 |
 |
| Quadrant-wise count rates Data is divided into 100 sec bins |
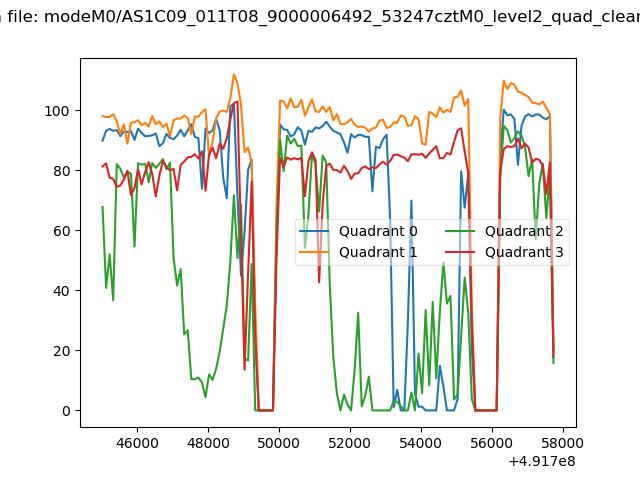 |
|
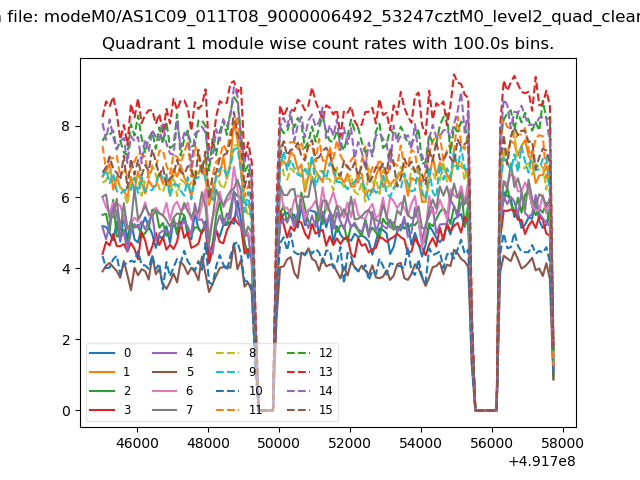
| Module-wise count rates for Quadrant A Data is divided into 100 sec bins |
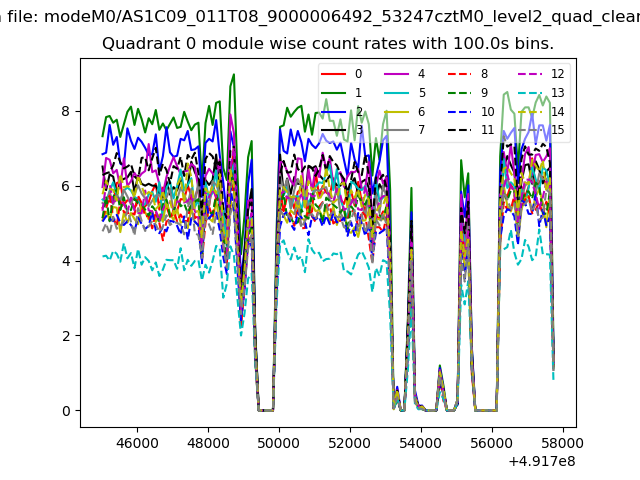 |
 |
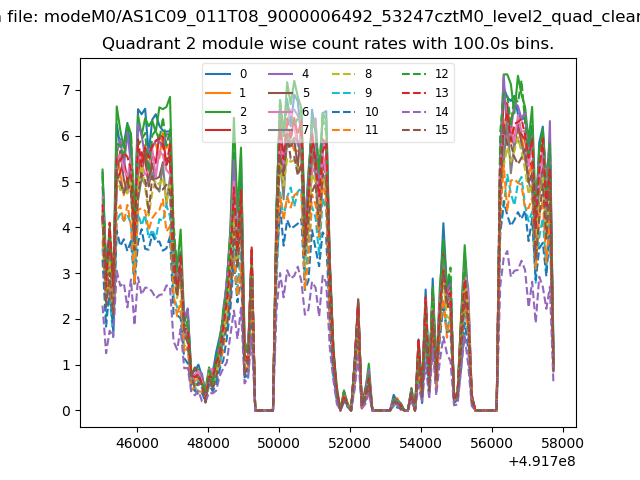
| Module-wise count rates for Quadrant B Data is divided into 100 sec bins |
 |
 |
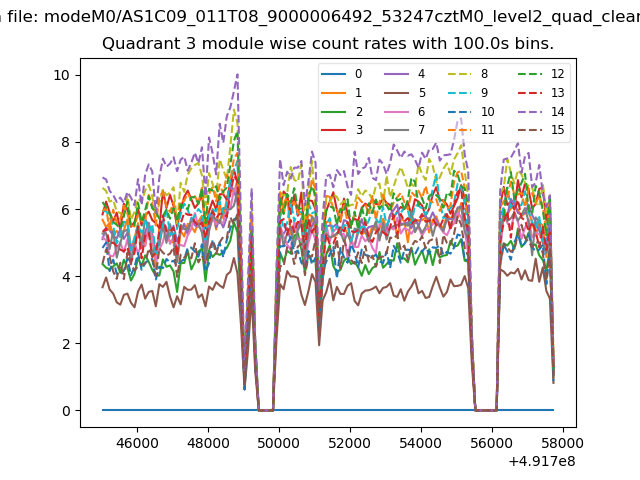
| Module-wise count rates for Quadrant C Data is divided into 100 sec bins |
 |
 |
| Module-wise count rates for Quadrant D Data is divided into 100 sec bins |
 |
 |
| Parameter | Plot |
|---|---|
| CZT HV Monitor | 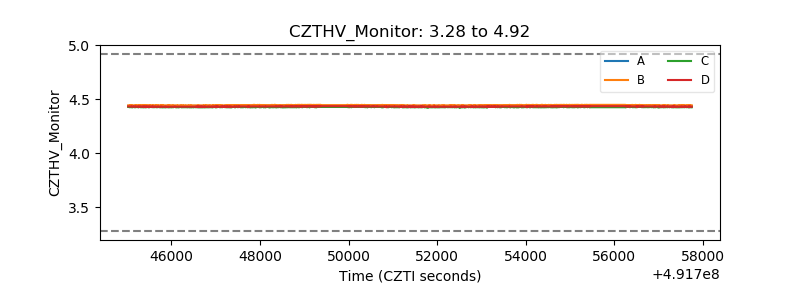 |
| D_VDD | 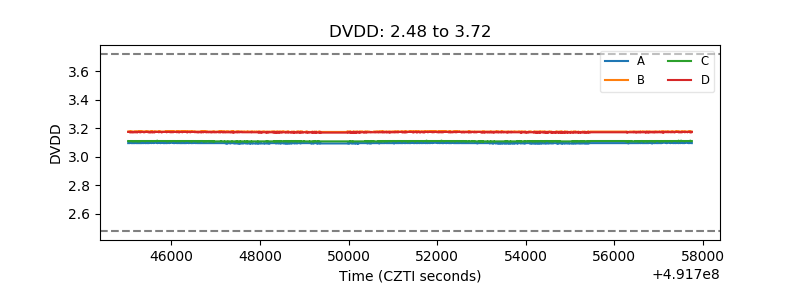 |
| Temperature 1 | 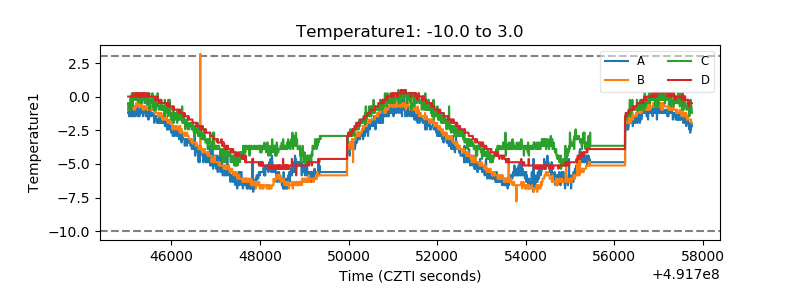 |
| Veto HV Monitor | 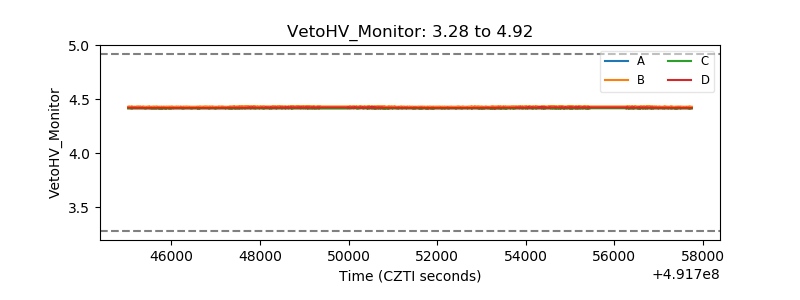 |
| Veto LLD | 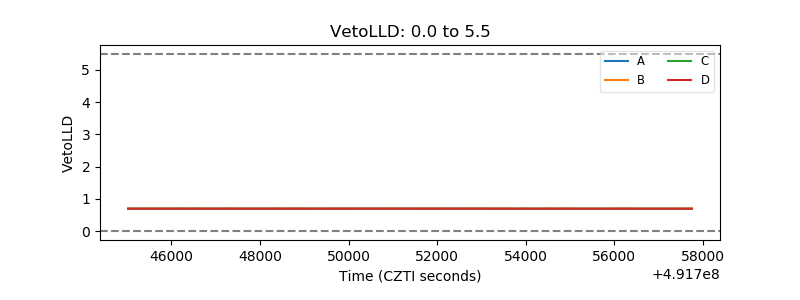 |
| Alpha Counter | 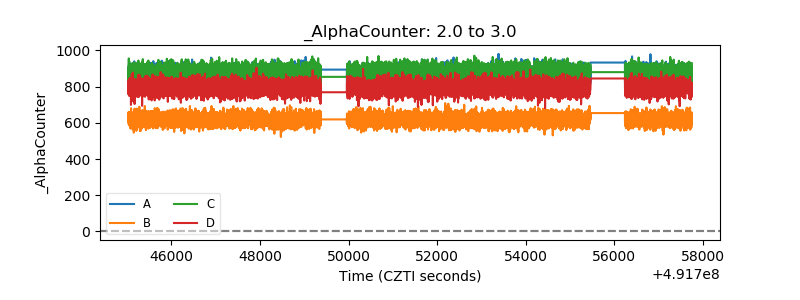 |
| _CPM_Rate | 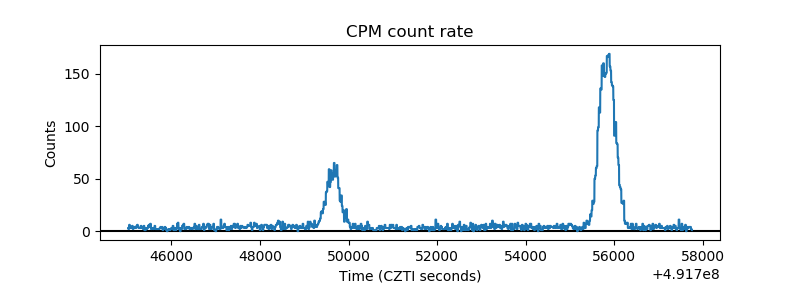 |
| CZT Counter | 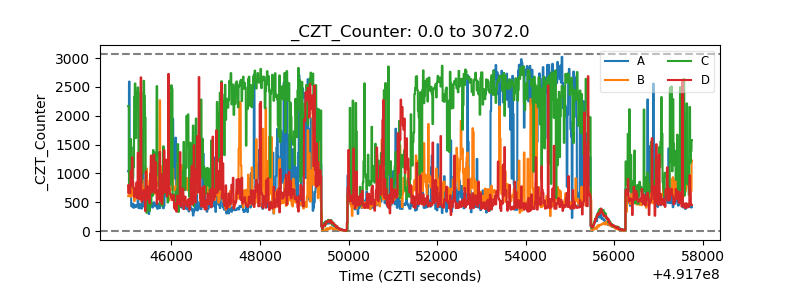 |
| +2.5 Volts monitor | 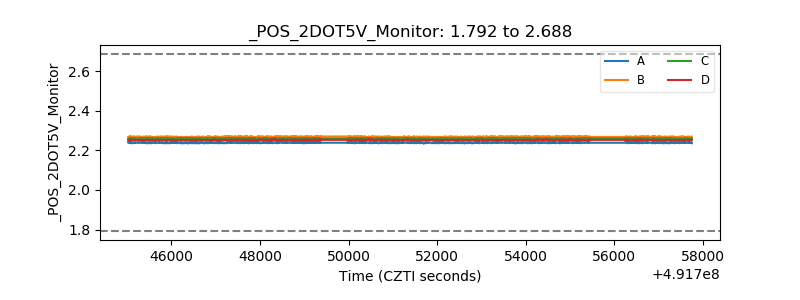 |
| +5 Volts monitor | 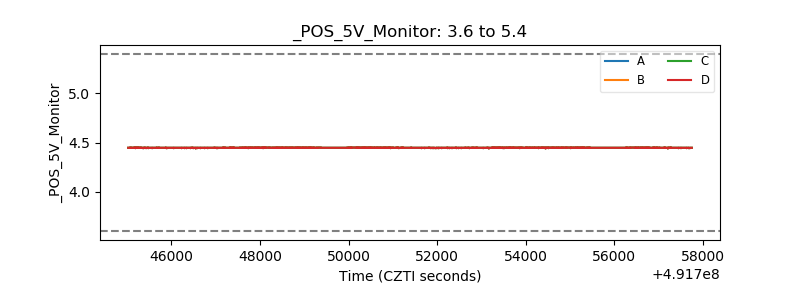 |
| _ROLL_ROT | 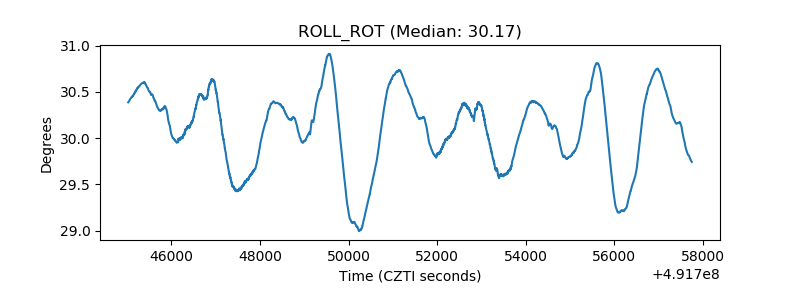 |
| _Roll_DEC | 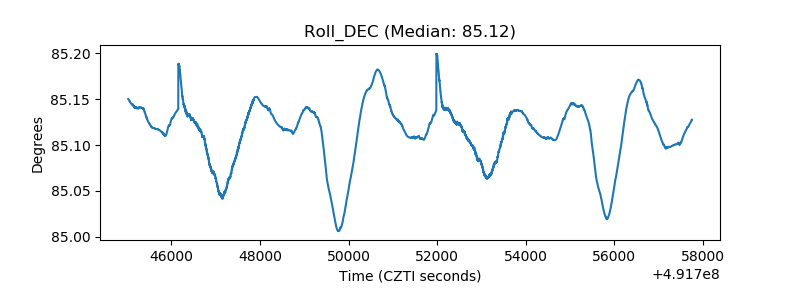 |
| _Roll_RA | 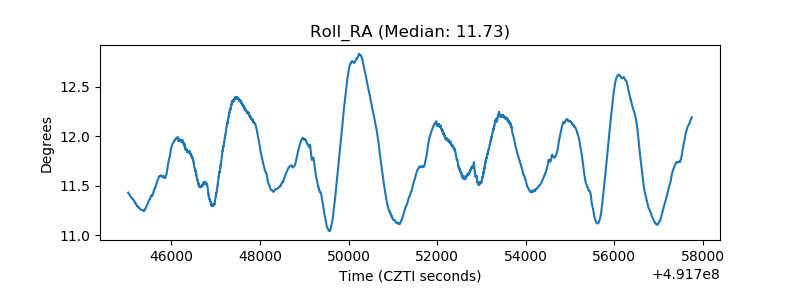 |
| Veto Counter | 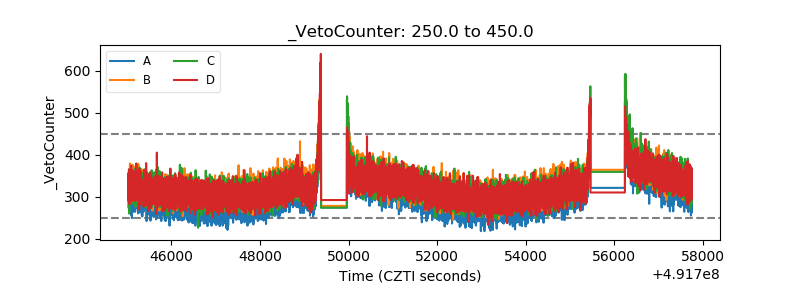 |