| Param | Original file | Final file |
|---|---|---|
| Filename | modeM0/AS1C09_011T08_9000006492_53248cztM0_level2.fits | modeM0/AS1C09_011T08_9000006492_53248cztM0_level2_quad_clean.evt |
| Size (bytes) | 556,983,360 | 91,560,960 |
| Size | 531.2 MB | 87.3 MB |
| Events in quadrant A | 3,606,341 | 617,246 |
| Events in quadrant B | 4,811,619 | 649,182 |
| Events in quadrant C | 7,749,595 | 496,478 |
| Events in quadrant D | 3,948,173 | 557,186 |
| Mode M0 | |||
|---|---|---|---|
| Quadrant | BADHDUFLAG | Total packets | Discarded packets |
| A | 0 | 15246 | 2 |
| B | 0 | 18770 | 2 |
| C | 0 | 27574 | 2 |
| D | 0 | 16177 | 3 |
| Mode M9 | |||
|---|---|---|---|
| Quadrant | BADHDUFLAG | Total packets | Discarded packets |
| A | 0 | 9 | 0 |
| B | 0 | 9 | 0 |
| C | 0 | 9 | 0 |
| D | 0 | 9 | 0 |
| Mode SS | |||
|---|---|---|---|
| Quadrant | BADHDUFLAG | Total packets | Discarded packets |
| A | 0 | 134 | 0 |
| B | 0 | 134 | 0 |
| C | 0 | 134 | 0 |
| D | 0 | 134 | 0 |
| Quadrant | Total seconds | Saturated seconds | Saturation percentage |
|---|---|---|---|
| A | 6473 | 153 | 2.363664% |
| B | 6474 | 193 | 2.981155% |
| C | 6474 | 1239 | 19.138091% |
| D | 6473 | 151 | 2.332767% |
Noise dominated data is calculated using 1-second bins in cleaned event files. If a bin has >2000 counts, and if more than 50% of those come from <1% of pixels, then it is considered to be noise-dominated and hence unusable.
| Quadrant | # 1 sec bins | Bins with >0 counts | Bins with >2000 counts | High rate bins dominated by noise | Noise dominated (total time) | Noise dominated (detector-on time) | Marked lightcurve |
|---|---|---|---|---|---|---|---|
| A | 7433 | 6475 | 116 | 116 | 1.56% | 1.79% | 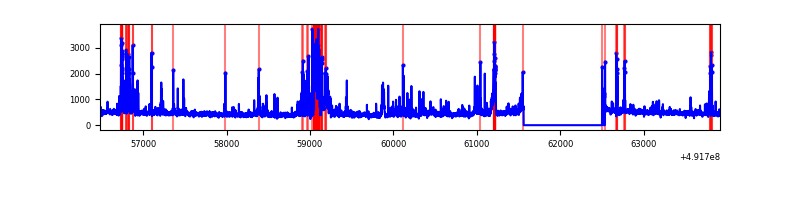 |
| B | 7434 | 6476 | 107 | 107 | 1.44% | 1.65% | 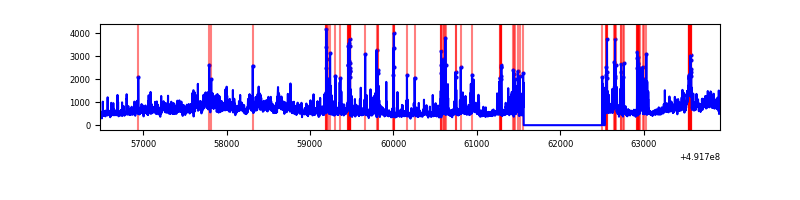 |
| C | 7434 | 6476 | 1126 | 1126 | 15.15% | 17.39% | 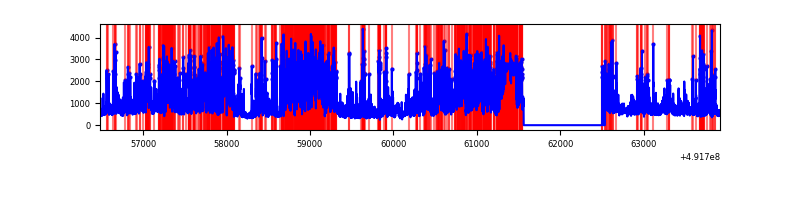 |
| D | 7433 | 6474 | 111 | 111 | 1.49% | 1.71% | 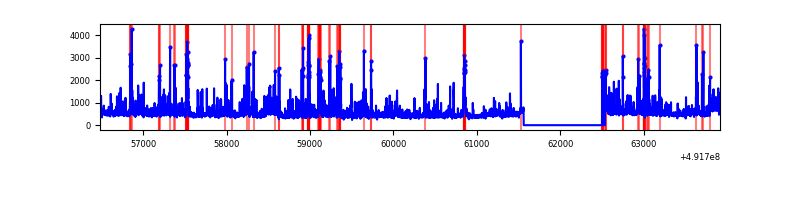 |
Top three noisy pixels from each quadrant. If the there are fewer than three noisy pixels in the level2.evt file, extra rows are filled as -1
| Pixel properties | Quadrant properties | ||||||
|---|---|---|---|---|---|---|---|
| Quadrant | DetID | PixID | Counts | Sigma | Mean | Median | Sigma |
| A | 7 | 206 | 265593 | 1566.39 | 681 | 664 | 169.1 |
| A | 4 | 238 | 132976 | 782.29 | 681 | 664 | 169.1 |
| A | 3 | 62 | 121517 | 714.54 | 681 | 664 | 169.1 |
| B | 12 | 33 | 1118794 | 7847.39 | 670 | 648 | 142.5 |
| B | 2 | 249 | 224653 | 1572.12 | 670 | 648 | 142.5 |
| B | 4 | 170 | 179337 | 1254.08 | 670 | 648 | 142.5 |
| C | 15 | 165 | 2034154 | 12123.8 | 613 | 607 | 167.7 |
| C | 4 | 5 | 1035764 | 6171.5 | 613 | 607 | 167.7 |
| C | 15 | 224 | 809963 | 4825.3 | 613 | 607 | 167.7 |
| D | 2 | 37 | 235533 | 1232.9 | 663 | 632 | 190.5 |
| D | 8 | 48 | 188843 | 987.84 | 663 | 632 | 190.5 |
| D | 13 | 170 | 171274 | 895.63 | 663 | 632 | 190.5 |
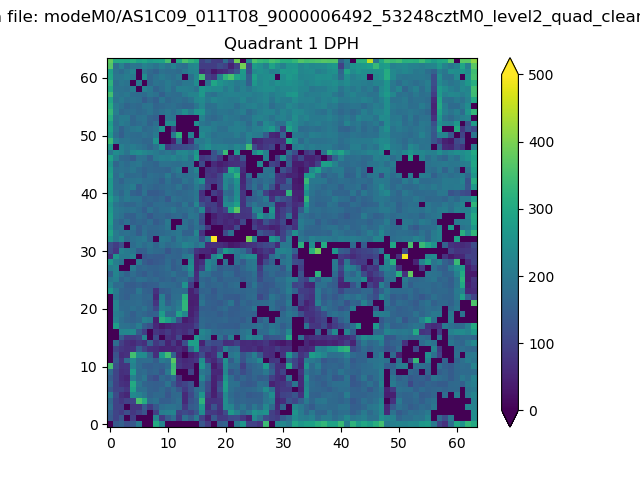
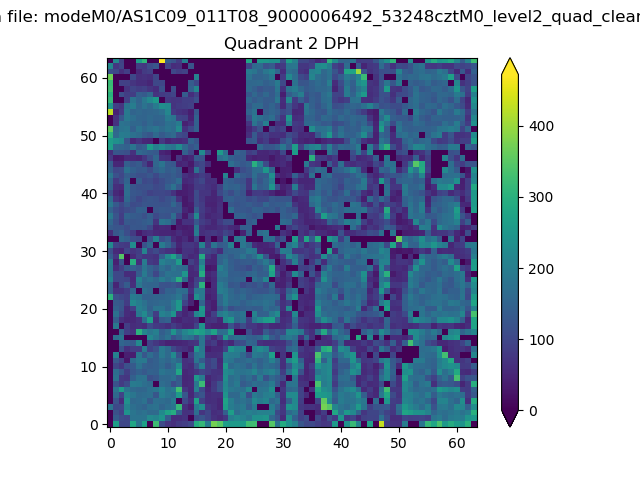
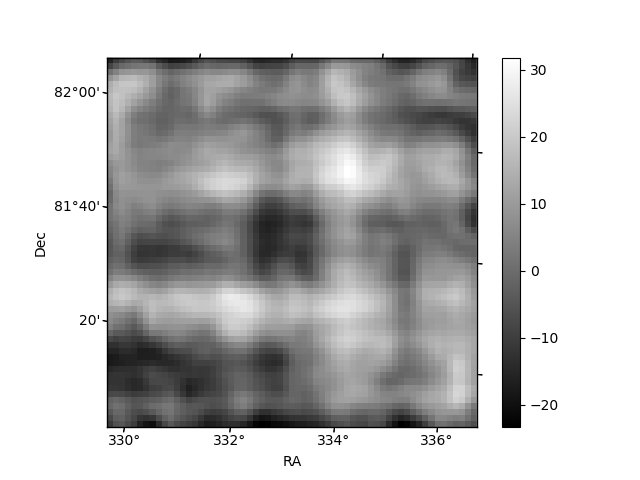
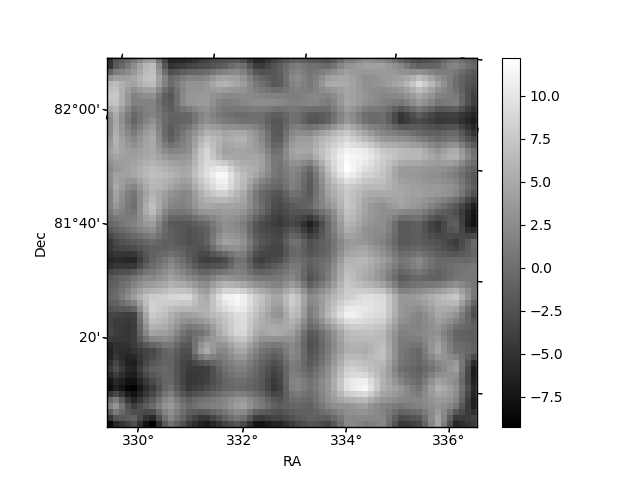
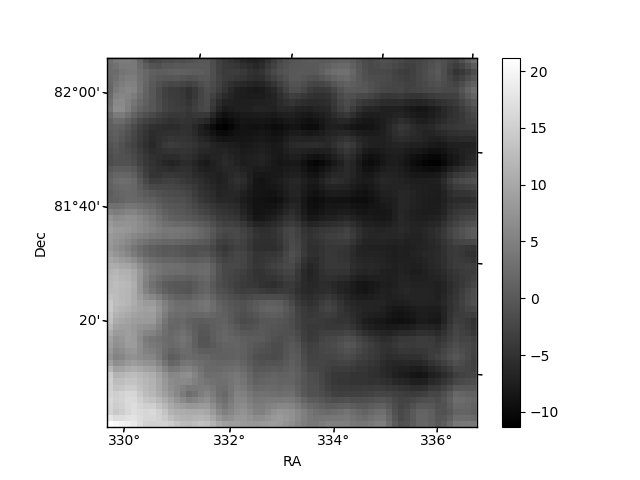
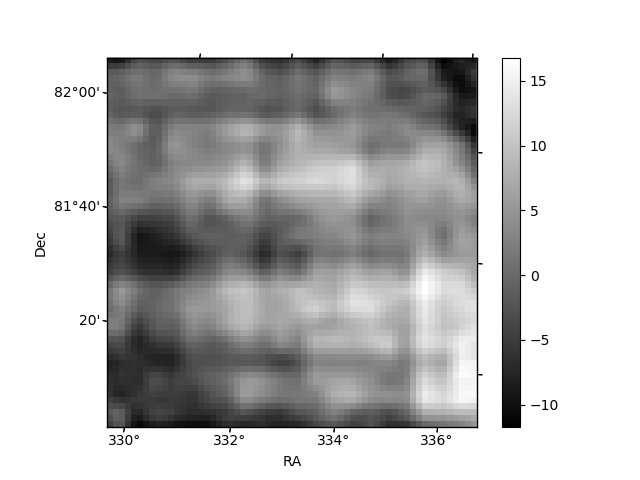
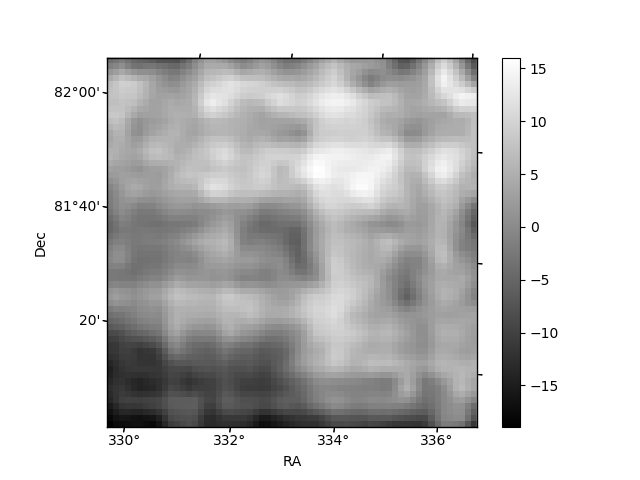
Histogram calculated using DETX and DETY for each event in the final _common_clean file
| Quadrant A |  |
 |
Quadrant B |
|---|---|---|---|
| Quadrant D | 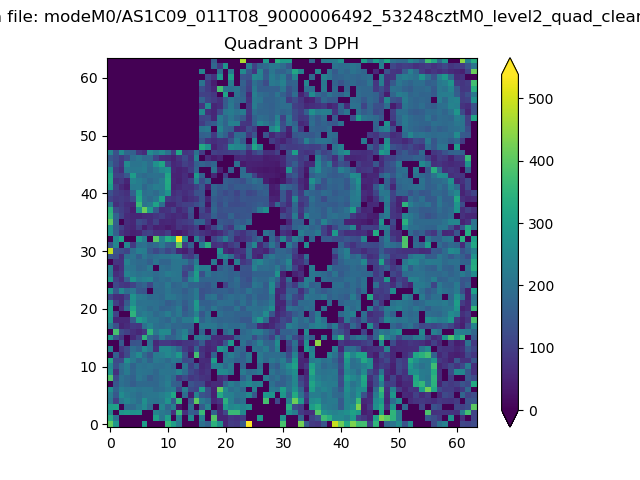 |
 |
Quadrant C |
| Plot type | Count rate plots | Images |
|---|---|---|
| Comparison with Poisson distribution Blue bars denote a histogram of data divided into 1 sec bins. Red curve is a Poisson curve with rate = median count rate of data. |
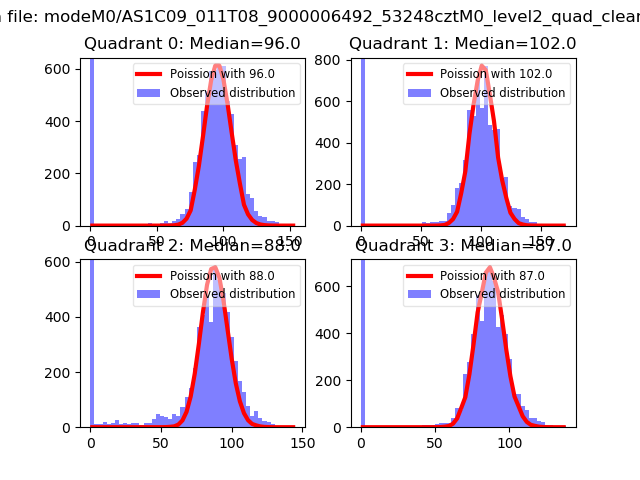 |
 |
| Quadrant-wise count rates Data is divided into 100 sec bins |
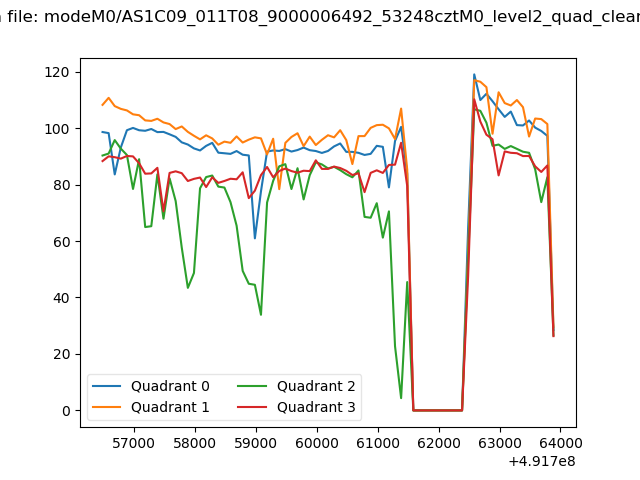 |
|
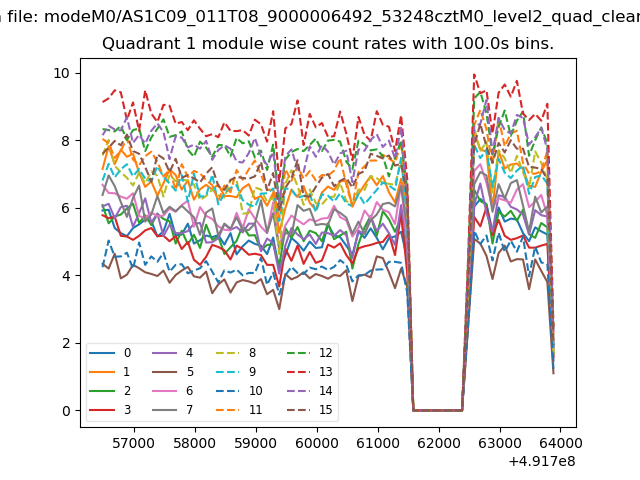
| Module-wise count rates for Quadrant A Data is divided into 100 sec bins |
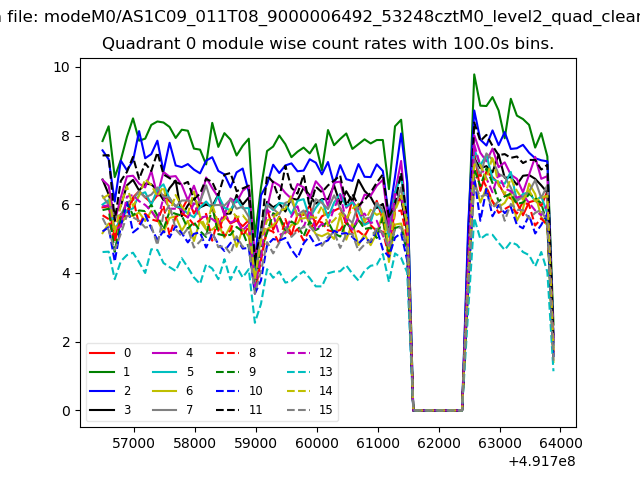 |
 |
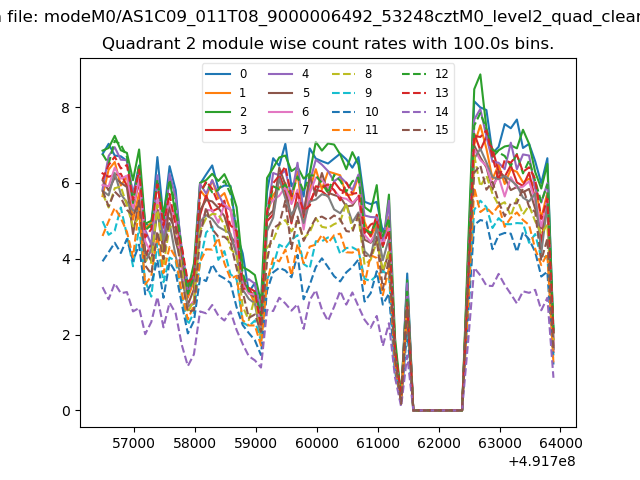
| Module-wise count rates for Quadrant B Data is divided into 100 sec bins |
 |
 |
| Module-wise count rates for Quadrant C Data is divided into 100 sec bins |
 |
 |
| Module-wise count rates for Quadrant D Data is divided into 100 sec bins |
 |
 |
| Parameter | Plot |
|---|---|
| CZT HV Monitor |  |
| D_VDD | 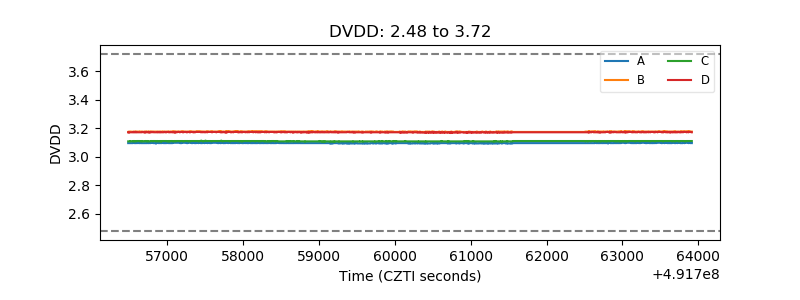 |
| Temperature 1 | 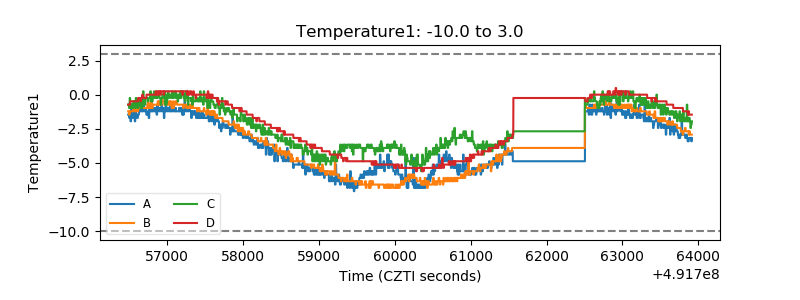 |
| Veto HV Monitor | 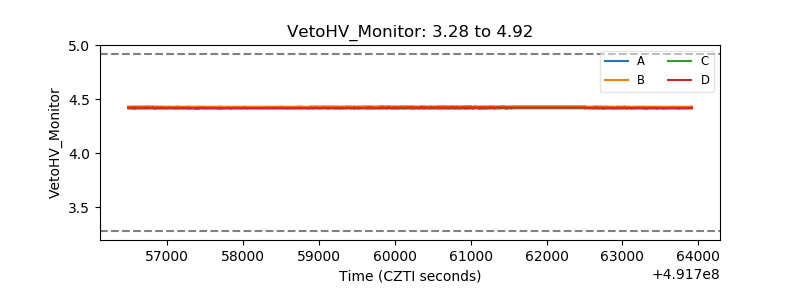 |
| Veto LLD | 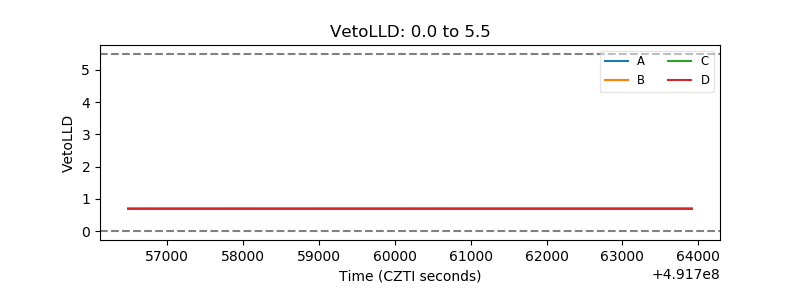 |
| Alpha Counter | 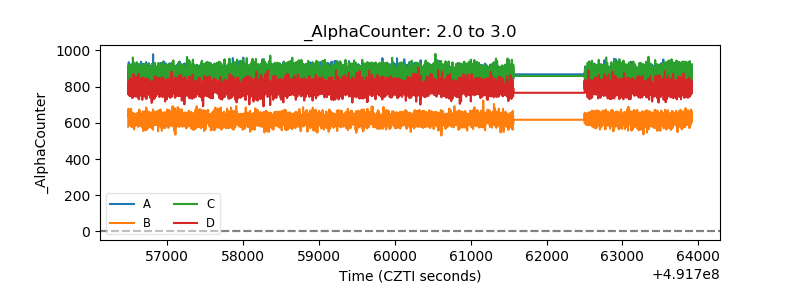 |
| _CPM_Rate | 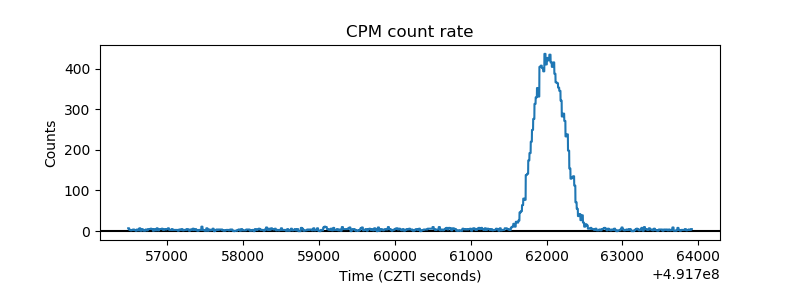 |
| CZT Counter | 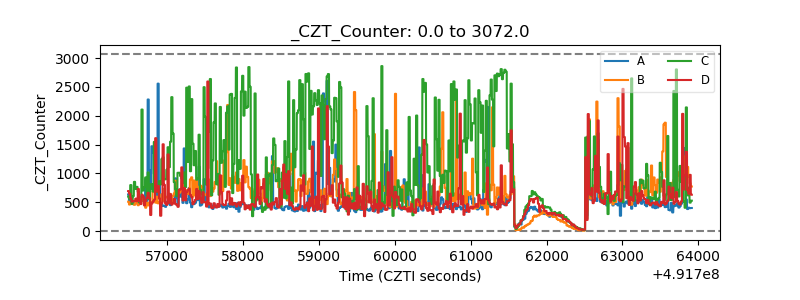 |
| +2.5 Volts monitor |  |
| +5 Volts monitor |  |
| _ROLL_ROT | 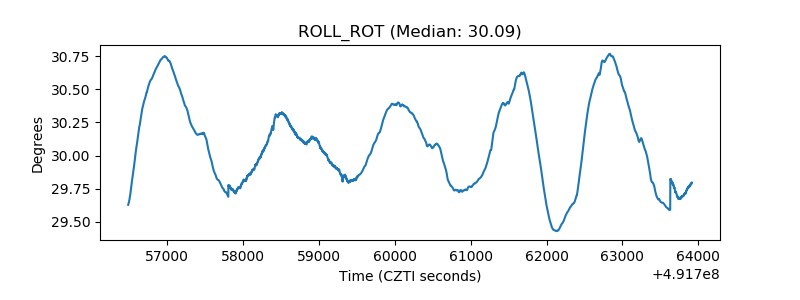 |
| _Roll_DEC | 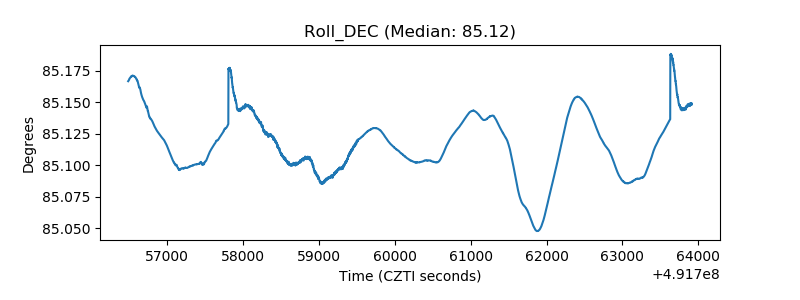 |
| _Roll_RA | 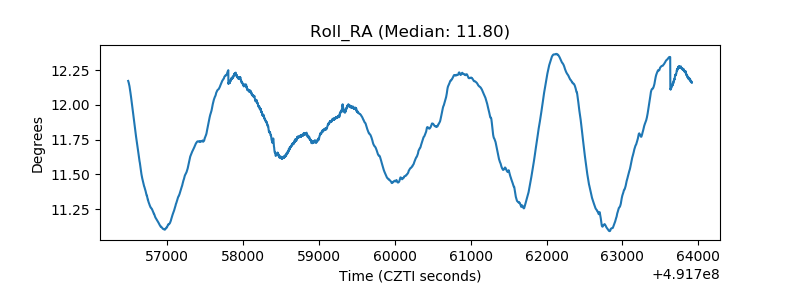 |
| Veto Counter | 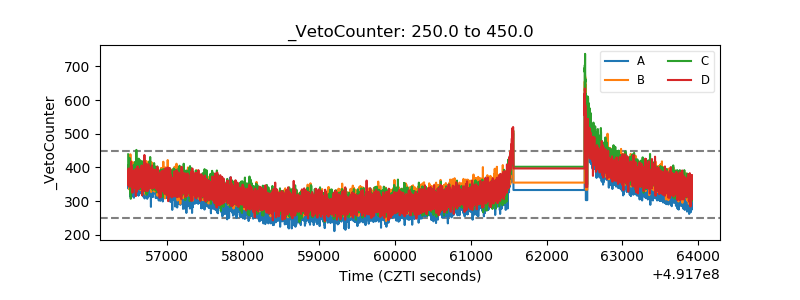 |