| Param | Original file | Final file |
|---|---|---|
| Filename | modeM0/AS1C09_011T08_9000006492_53250cztM0_level2.fits | modeM0/AS1C09_011T08_9000006492_53250cztM0_level2_quad_clean.evt |
| Size (bytes) | 703,961,280 | 87,886,080 |
| Size | 671.3 MB | 83.8 MB |
| Events in quadrant A | 5,085,788 | 596,712 |
| Events in quadrant B | 5,566,408 | 656,061 |
| Events in quadrant C | 10,414,130 | 382,061 |
| Events in quadrant D | 4,484,359 | 568,823 |
| Mode M0 | |||
|---|---|---|---|
| Quadrant | BADHDUFLAG | Total packets | Discarded packets |
| A | 0 | 19606 | 3 |
| B | 0 | 20990 | 3 |
| C | 0 | 35443 | 3 |
| D | 0 | 17815 | 3 |
| Mode M9 | |||
|---|---|---|---|
| Quadrant | BADHDUFLAG | Total packets | Discarded packets |
| A | 0 | 12 | 0 |
| B | 0 | 12 | 0 |
| C | 0 | 13 | 0 |
| D | 0 | 13 | 0 |
| Mode SS | |||
|---|---|---|---|
| Quadrant | BADHDUFLAG | Total packets | Discarded packets |
| A | 0 | 134 | 0 |
| B | 0 | 134 | 0 |
| C | 0 | 134 | 0 |
| D | 0 | 134 | 0 |
| Quadrant | Total seconds | Saturated seconds | Saturation percentage |
|---|---|---|---|
| A | 6553 | 607 | 9.262933% |
| B | 6553 | 483 | 7.370670% |
| C | 6553 | 2825 | 43.110026% |
| D | 6553 | 288 | 4.394934% |
Noise dominated data is calculated using 1-second bins in cleaned event files. If a bin has >2000 counts, and if more than 50% of those come from <1% of pixels, then it is considered to be noise-dominated and hence unusable.
| Quadrant | # 1 sec bins | Bins with >0 counts | Bins with >2000 counts | High rate bins dominated by noise | Noise dominated (total time) | Noise dominated (detector-on time) | Marked lightcurve |
|---|---|---|---|---|---|---|---|
| A | 7658 | 6555 | 567 | 567 | 7.40% | 8.65% | 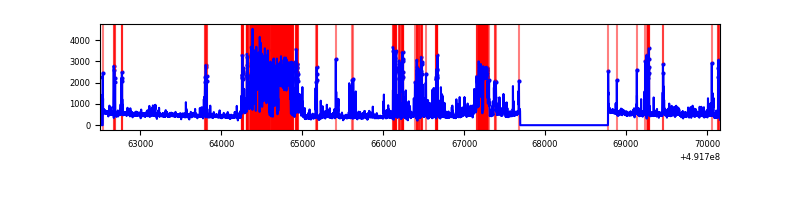 |
| B | 7658 | 6555 | 358 | 358 | 4.67% | 5.46% | 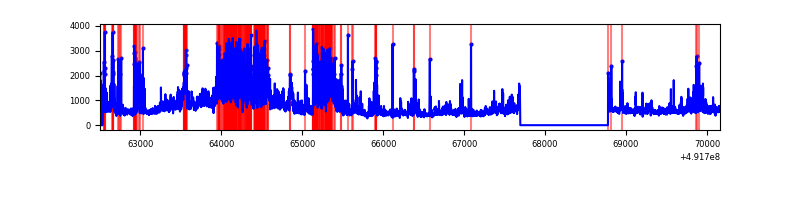 |
| C | 7658 | 6554 | 2527 | 2527 | 33.00% | 38.56% | 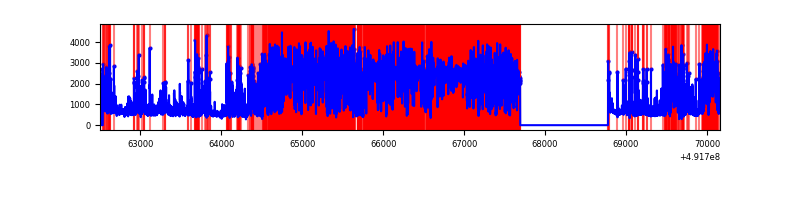 |
| D | 7658 | 6554 | 226 | 226 | 2.95% | 3.45% | 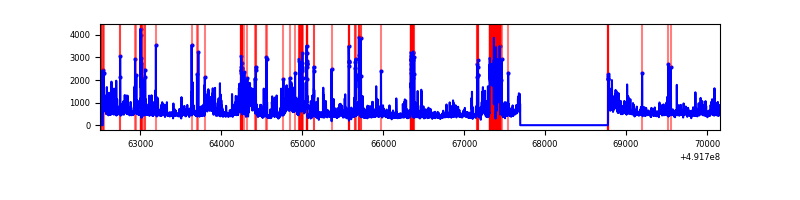 |
Top three noisy pixels from each quadrant. If the there are fewer than three noisy pixels in the level2.evt file, extra rows are filled as -1
| Pixel properties | Quadrant properties | ||||||
|---|---|---|---|---|---|---|---|
| Quadrant | DetID | PixID | Counts | Sigma | Mean | Median | Sigma |
| A | 12 | 115 | 1068352 | 6249.45 | 680 | 664 | 170.8 |
| A | 7 | 206 | 389455 | 2275.69 | 680 | 664 | 170.8 |
| A | 0 | 8 | 297348 | 1736.57 | 680 | 664 | 170.8 |
| B | 12 | 33 | 1717688 | 11973.81 | 678 | 654 | 143.4 |
| B | 12 | 17 | 234779 | 1632.68 | 678 | 654 | 143.4 |
| B | 2 | 249 | 172411 | 1197.75 | 678 | 654 | 143.4 |
| C | 15 | 165 | 6077014 | 41638.7 | 530 | 525 | 145.9 |
| C | 15 | 224 | 959537 | 6571.56 | 530 | 525 | 145.9 |
| C | 4 | 5 | 533178 | 3649.97 | 530 | 525 | 145.9 |
| D | 8 | 48 | 414521 | 2133.81 | 674 | 641 | 194.0 |
| D | 12 | 3 | 326345 | 1679.21 | 674 | 641 | 194.0 |
| D | 2 | 37 | 194872 | 1001.38 | 674 | 641 | 194.0 |
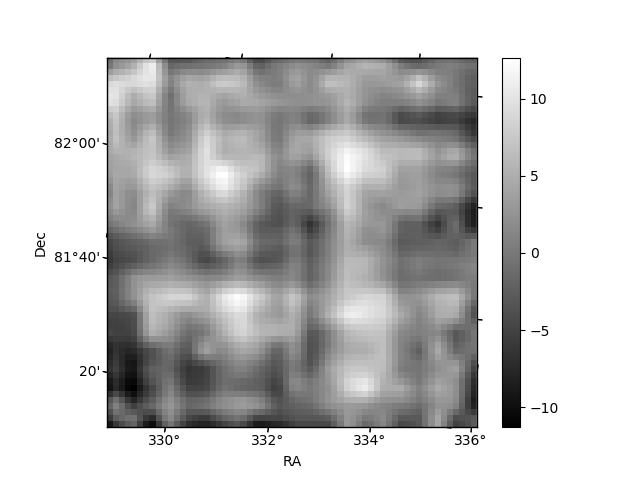
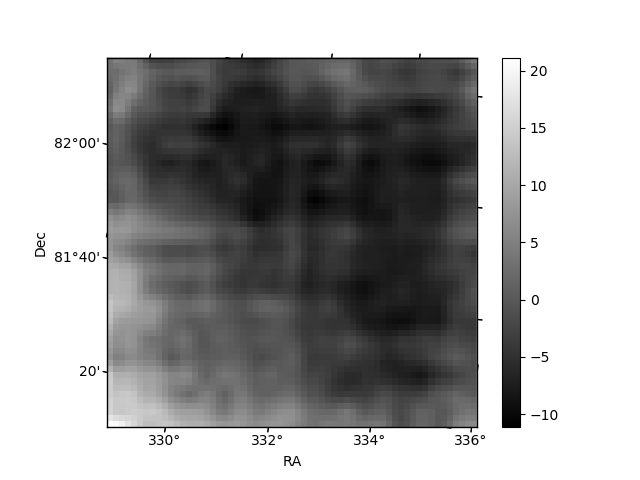
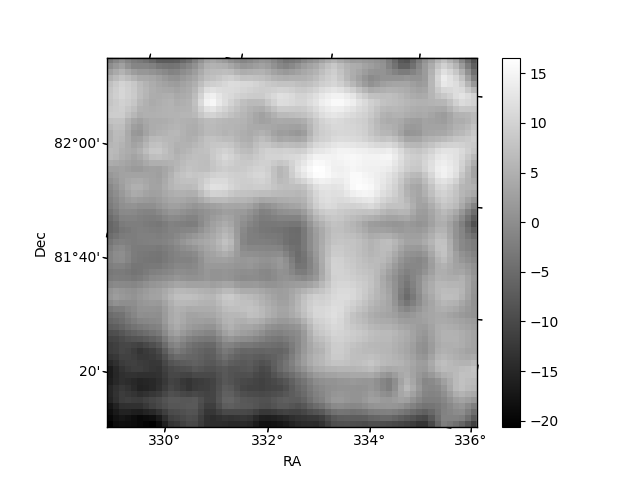
Histogram calculated using DETX and DETY for each event in the final _common_clean file
| Quadrant A | 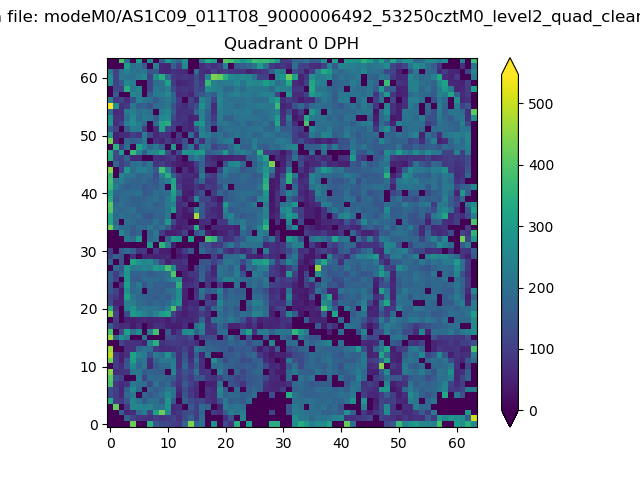 |
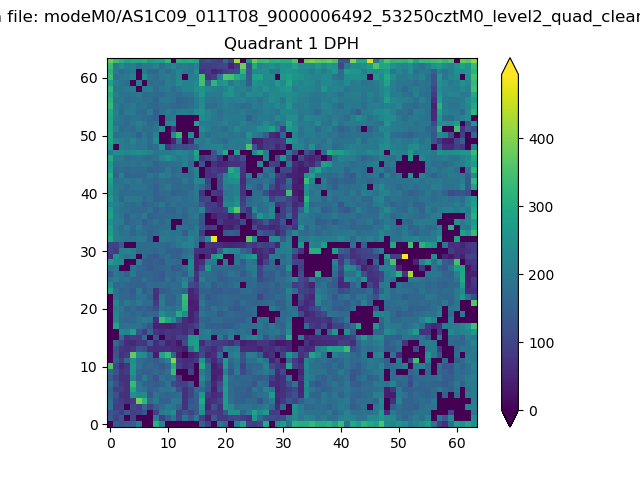 |
Quadrant B |
|---|---|---|---|
| Quadrant D | 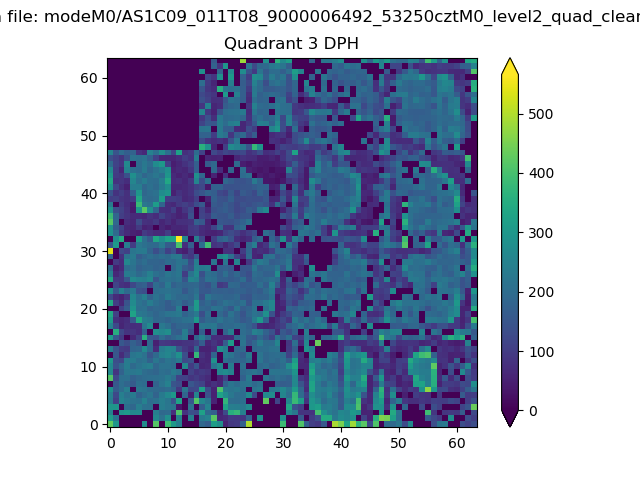 |
 |
Quadrant C |
| Plot type | Count rate plots | Images |
|---|---|---|
| Comparison with Poisson distribution Blue bars denote a histogram of data divided into 1 sec bins. Red curve is a Poisson curve with rate = median count rate of data. |
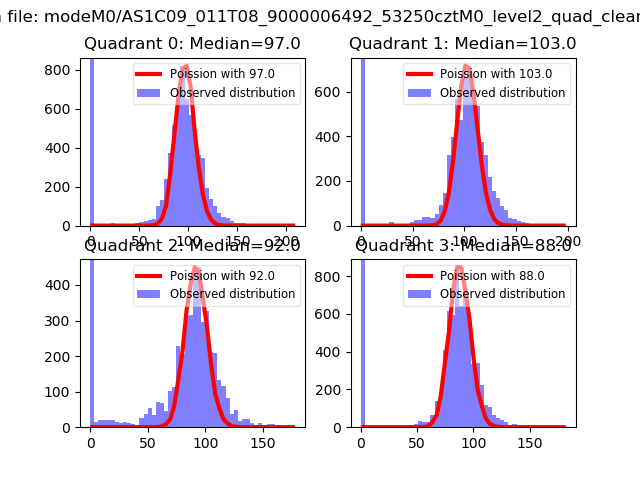 |
 |
| Quadrant-wise count rates Data is divided into 100 sec bins |
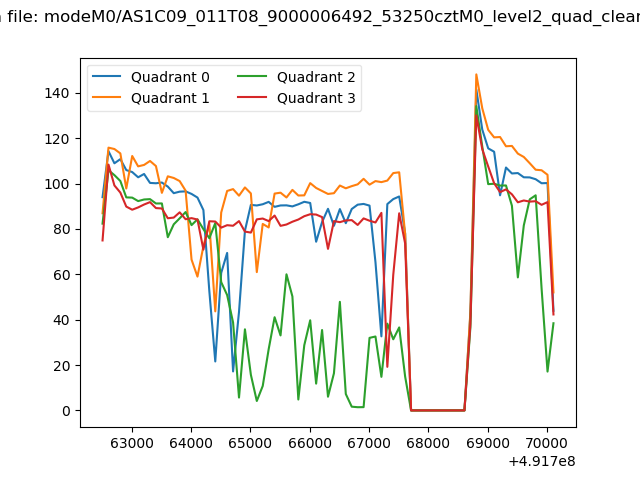 |
|
| Module-wise count rates for Quadrant A Data is divided into 100 sec bins |
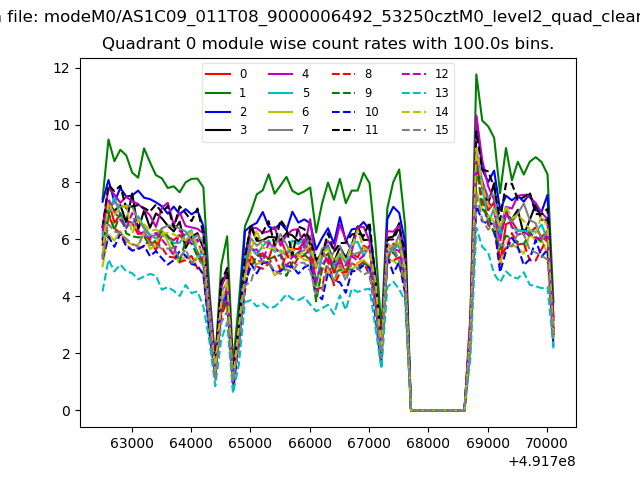 |
 |
| Module-wise count rates for Quadrant B Data is divided into 100 sec bins |
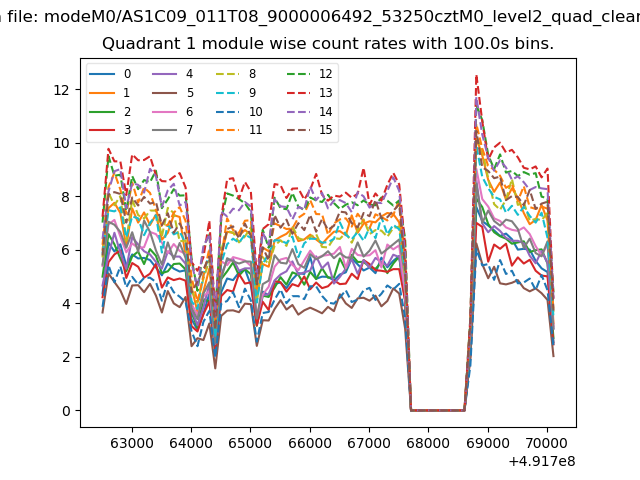 |
 |
| Module-wise count rates for Quadrant C Data is divided into 100 sec bins |
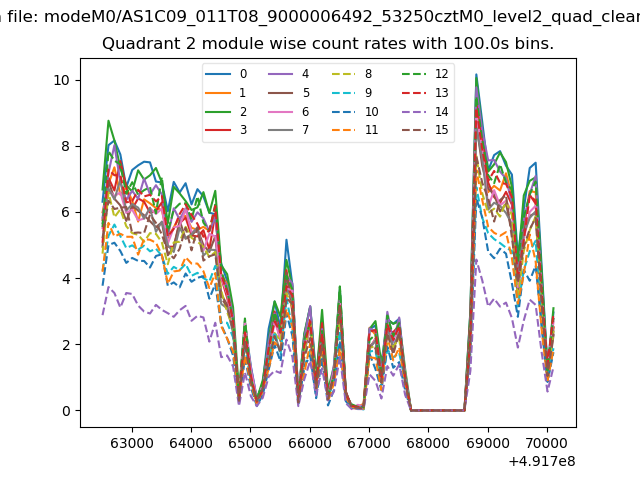 |
 |
| Module-wise count rates for Quadrant D Data is divided into 100 sec bins |
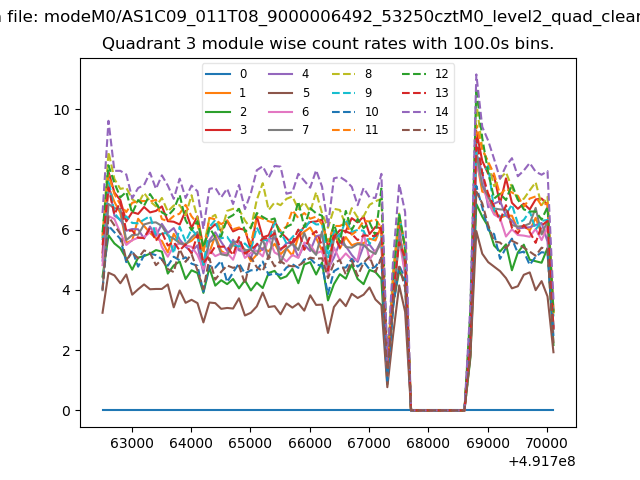 |
 |
| Parameter | Plot |
|---|---|
| CZT HV Monitor | 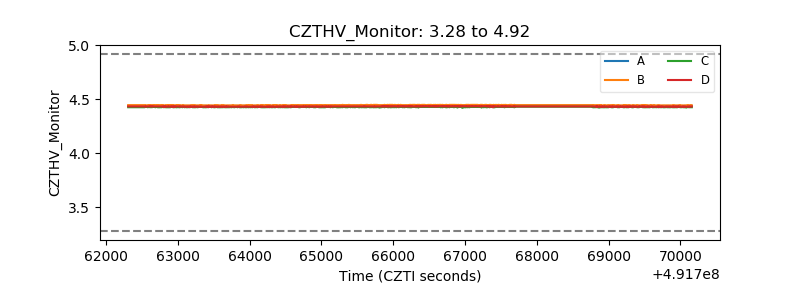 |
| D_VDD | 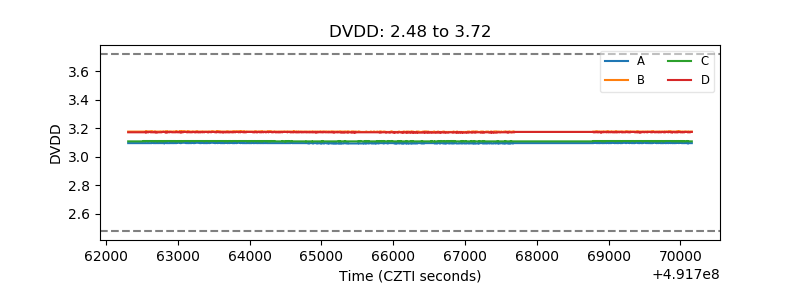 |
| Temperature 1 | 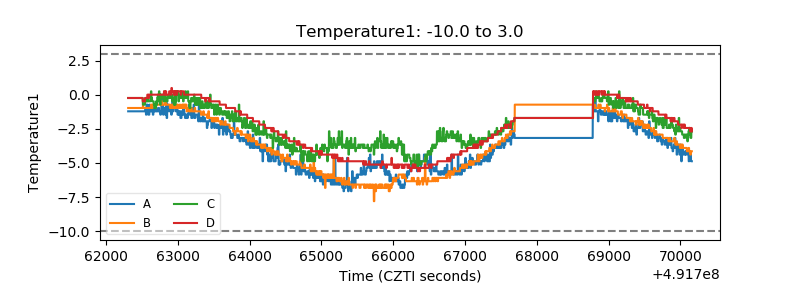 |
| Veto HV Monitor | 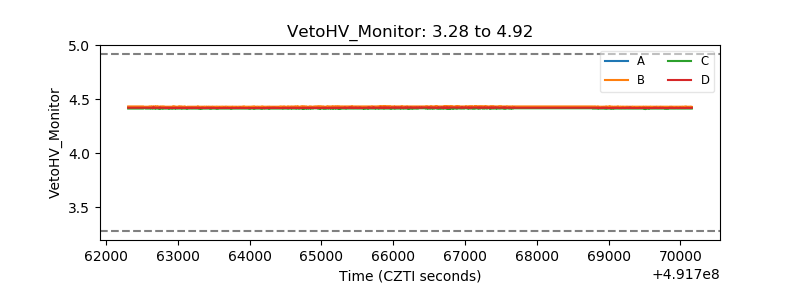 |
| Veto LLD |  |
| Alpha Counter |  |
| _CPM_Rate | 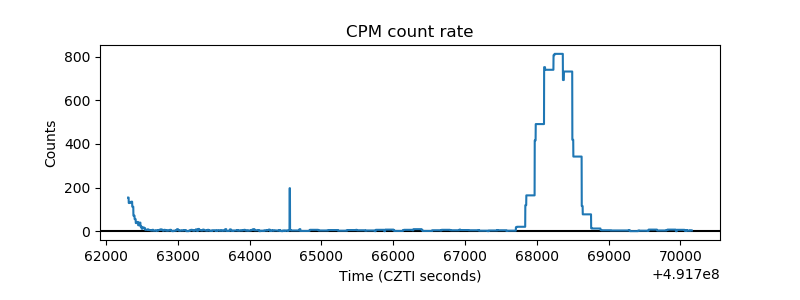 |
| CZT Counter | 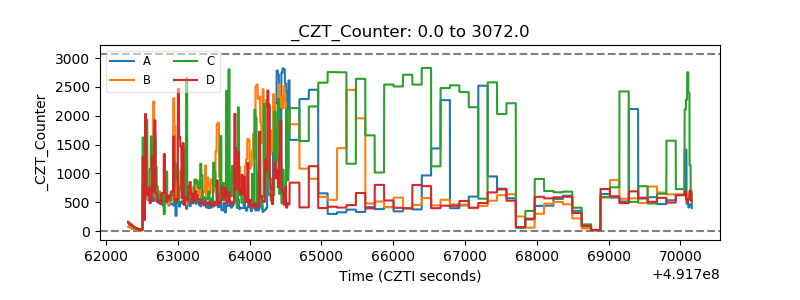 |
| +2.5 Volts monitor | 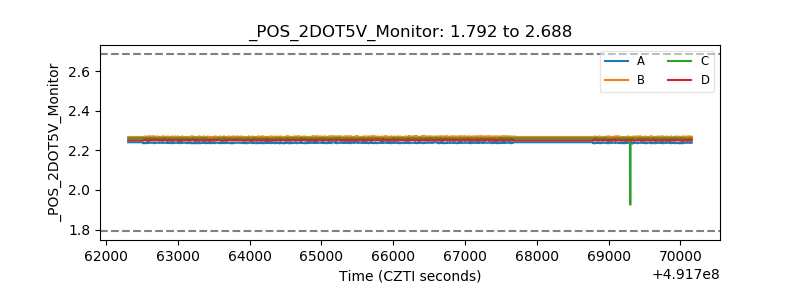 |
| +5 Volts monitor |  |
| _ROLL_ROT | 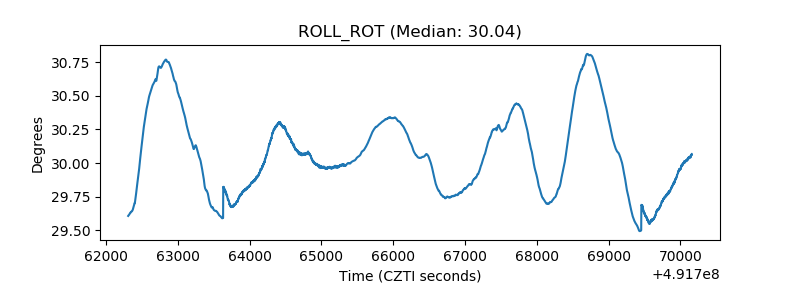 |
| _Roll_DEC | 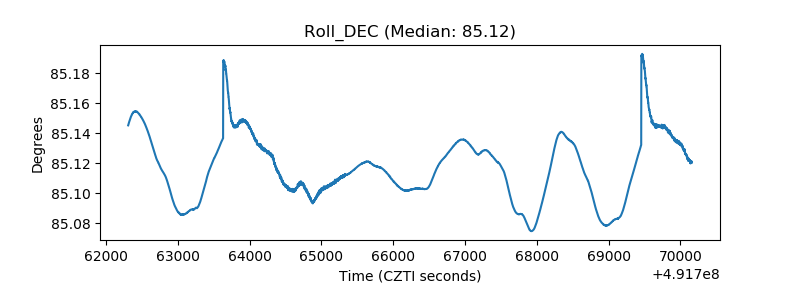 |
| _Roll_RA | 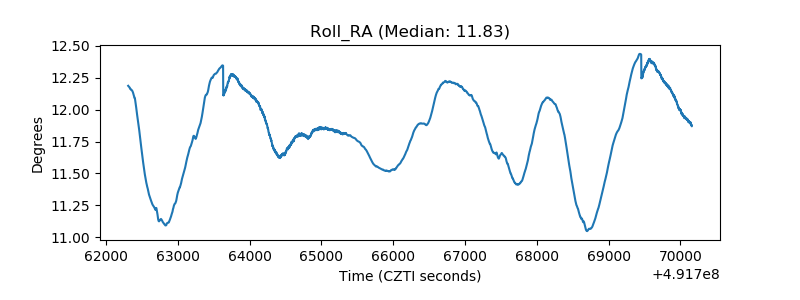 |
| Veto Counter | 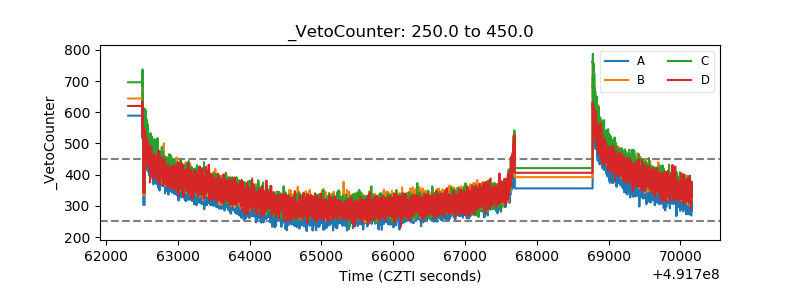 |