| Param | Original file | Final file |
|---|---|---|
| Filename | modeM0/AS1C09_011T08_9000006492_53253cztM0_level2.fits | modeM0/AS1C09_011T08_9000006492_53253cztM0_level2_quad_clean.evt |
| Size (bytes) | 751,014,720 | 82,166,400 |
| Size | 716.2 MB | 78.4 MB |
| Events in quadrant A | 4,177,880 | 618,951 |
| Events in quadrant B | 3,819,380 | 682,903 |
| Events in quadrant C | 14,280,734 | 172,317 |
| Events in quadrant D | 5,020,822 | 563,185 |
| Mode M0 | |||
|---|---|---|---|
| Quadrant | BADHDUFLAG | Total packets | Discarded packets |
| A | 0 | 16971 | 4 |
| B | 0 | 15884 | 2 |
| C | 0 | 46804 | 2 |
| D | 0 | 19521 | 2 |
| Mode M9 | |||
|---|---|---|---|
| Quadrant | BADHDUFLAG | Total packets | Discarded packets |
| A | 0 | 21 | 0 |
| B | 0 | 22 | 0 |
| C | 0 | 22 | 0 |
| D | 0 | 22 | 0 |
| Mode SS | |||
|---|---|---|---|
| Quadrant | BADHDUFLAG | Total packets | Discarded packets |
| A | 0 | 130 | 0 |
| B | 0 | 130 | 0 |
| C | 0 | 130 | 0 |
| D | 0 | 130 | 0 |
| Quadrant | Total seconds | Saturated seconds | Saturation percentage |
|---|---|---|---|
| A | 6459 | 313 | 4.845951% |
| B | 6459 | 217 | 3.359653% |
| C | 6459 | 4892 | 75.739279% |
| D | 6459 | 365 | 5.651030% |
Noise dominated data is calculated using 1-second bins in cleaned event files. If a bin has >2000 counts, and if more than 50% of those come from <1% of pixels, then it is considered to be noise-dominated and hence unusable.
| Quadrant | # 1 sec bins | Bins with >0 counts | Bins with >2000 counts | High rate bins dominated by noise | Noise dominated (total time) | Noise dominated (detector-on time) | Marked lightcurve |
|---|---|---|---|---|---|---|---|
| A | 7664 | 6460 | 249 | 249 | 3.25% | 3.85% | 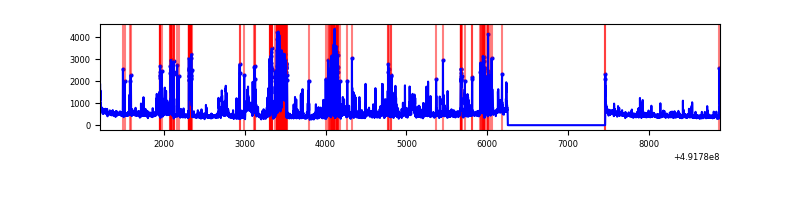 |
| B | 7664 | 6460 | 88 | 88 | 1.15% | 1.36% | 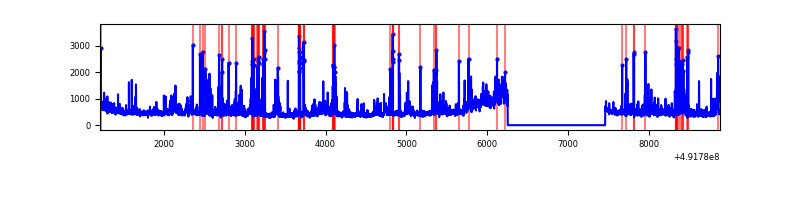 |
| C | 7663 | 6458 | 4600 | 4600 | 60.03% | 71.23% | 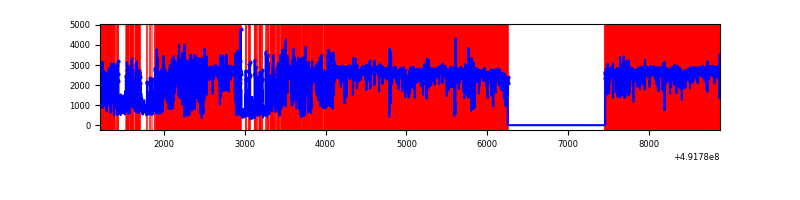 |
| D | 7664 | 6460 | 315 | 315 | 4.11% | 4.88% | 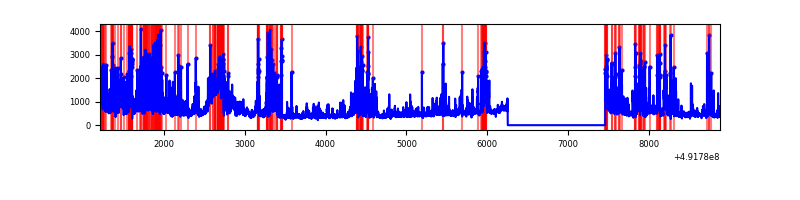 |
Top three noisy pixels from each quadrant. If the there are fewer than three noisy pixels in the level2.evt file, extra rows are filled as -1
| Pixel properties | Quadrant properties | ||||||
|---|---|---|---|---|---|---|---|
| Quadrant | DetID | PixID | Counts | Sigma | Mean | Median | Sigma |
| A | 8 | 230 | 431967 | 2599.19 | 670 | 654 | 165.9 |
| A | 0 | 8 | 319134 | 1919.23 | 670 | 654 | 165.9 |
| A | 15 | 174 | 161279 | 967.96 | 670 | 654 | 165.9 |
| B | 12 | 33 | 283813 | 1977.69 | 677 | 655 | 143.2 |
| B | 2 | 249 | 259745 | 1809.59 | 677 | 655 | 143.2 |
| B | 4 | 81 | 195229 | 1358.99 | 677 | 655 | 143.2 |
| C | 1 | 241 | 6521472 | 69089.28 | 340 | 339 | 94.4 |
| C | 15 | 165 | 3045913 | 32266.86 | 340 | 339 | 94.4 |
| C | 15 | 224 | 1781966 | 18875.76 | 340 | 339 | 94.4 |
| D | 10 | 172 | 505957 | 2698.94 | 650 | 620 | 187.2 |
| D | 12 | 3 | 354637 | 1890.76 | 650 | 620 | 187.2 |
| D | 13 | 170 | 313154 | 1669.2 | 650 | 620 | 187.2 |
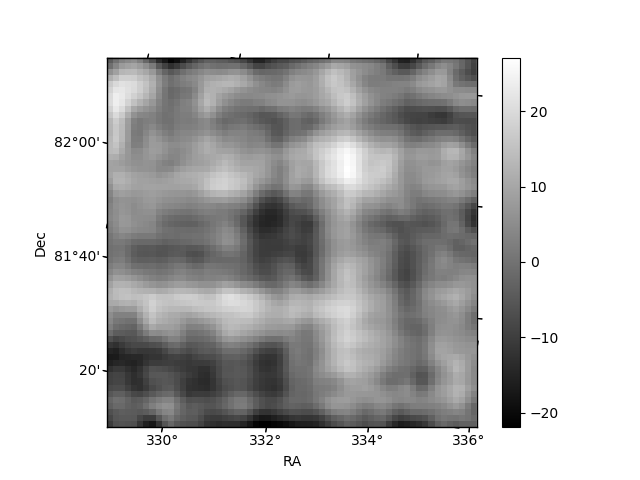
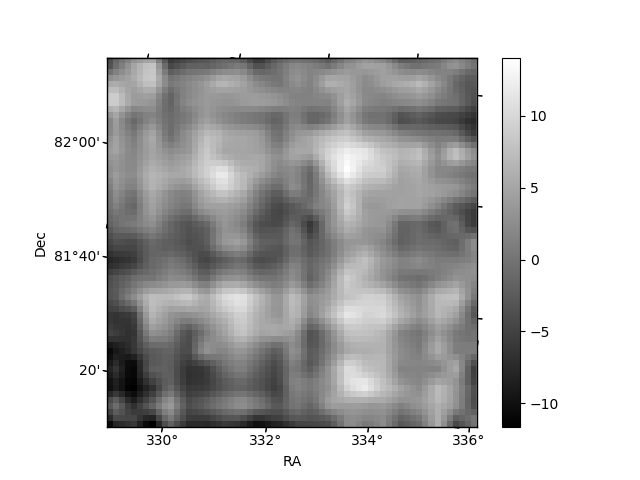
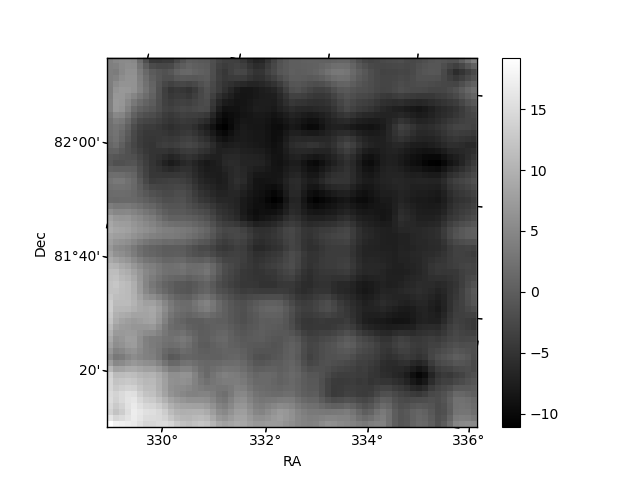
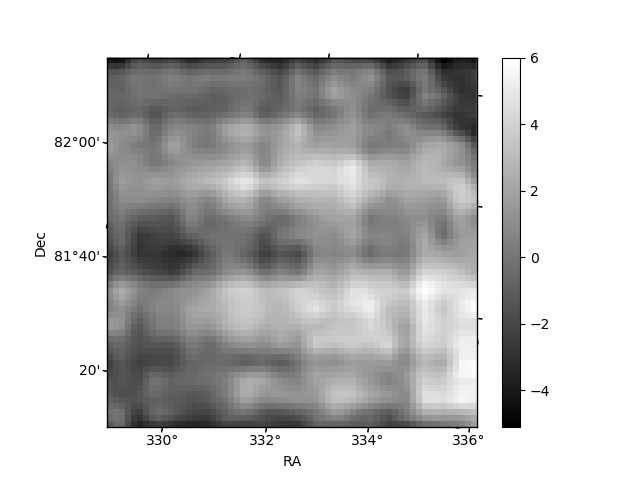
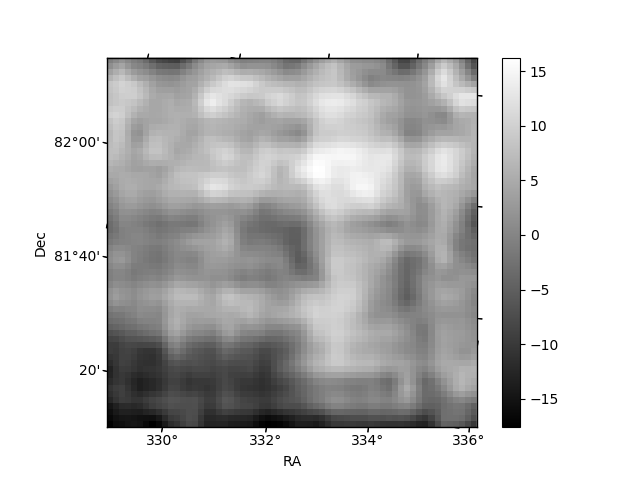
Histogram calculated using DETX and DETY for each event in the final _common_clean file
| Quadrant A | 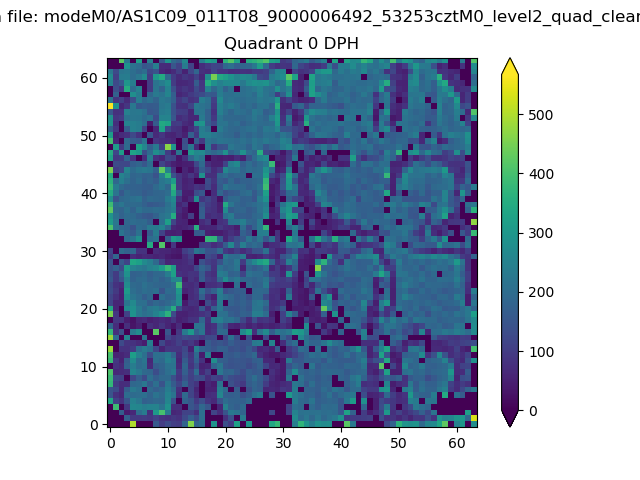 |
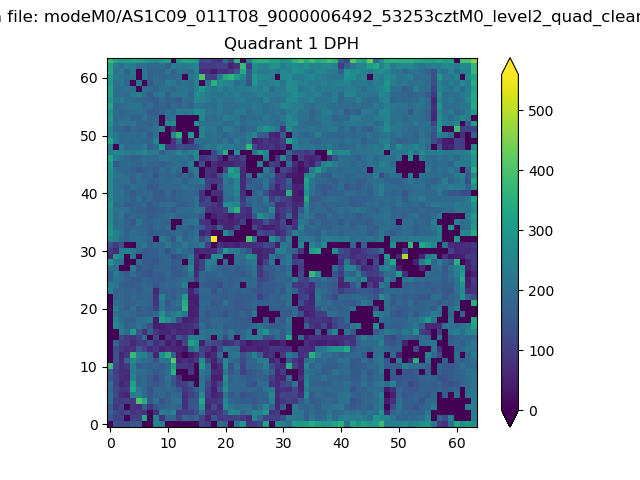 |
Quadrant B |
|---|---|---|---|
| Quadrant D | 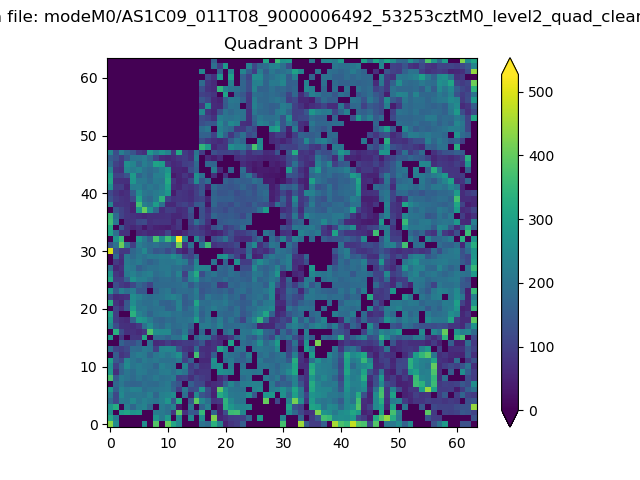 |
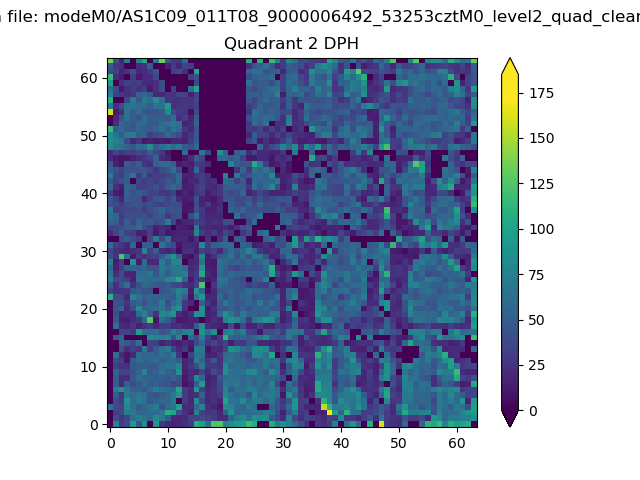 |
Quadrant C |
| Plot type | Count rate plots | Images |
|---|---|---|
| Comparison with Poisson distribution Blue bars denote a histogram of data divided into 1 sec bins. Red curve is a Poisson curve with rate = median count rate of data. |
 |
 |
| Quadrant-wise count rates Data is divided into 100 sec bins |
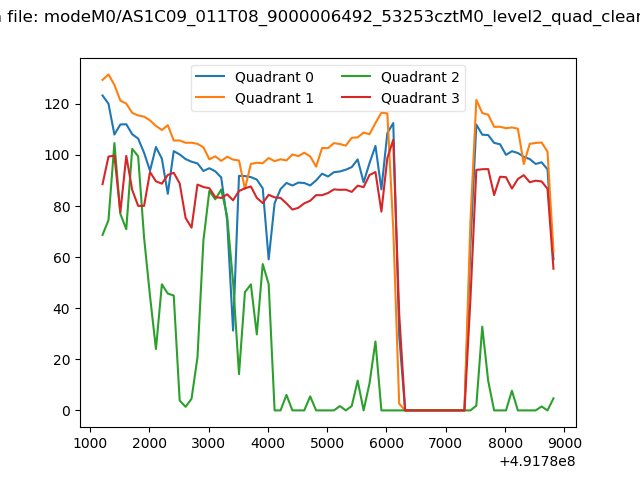 |
|
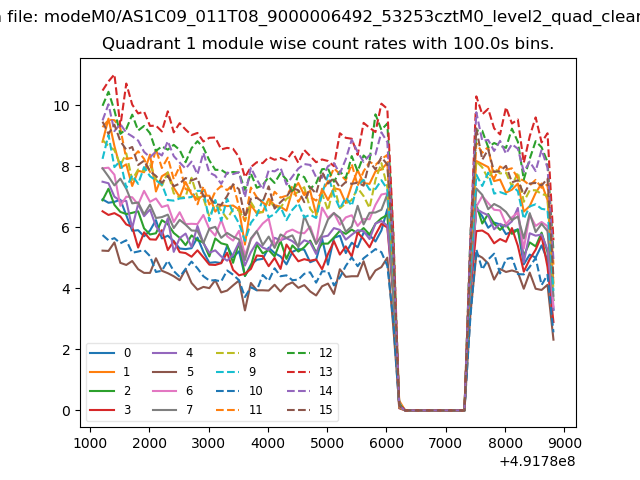
| Module-wise count rates for Quadrant A Data is divided into 100 sec bins |
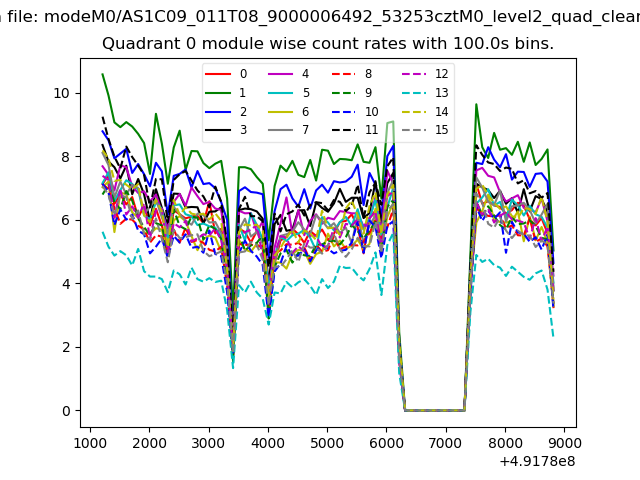 |
 |
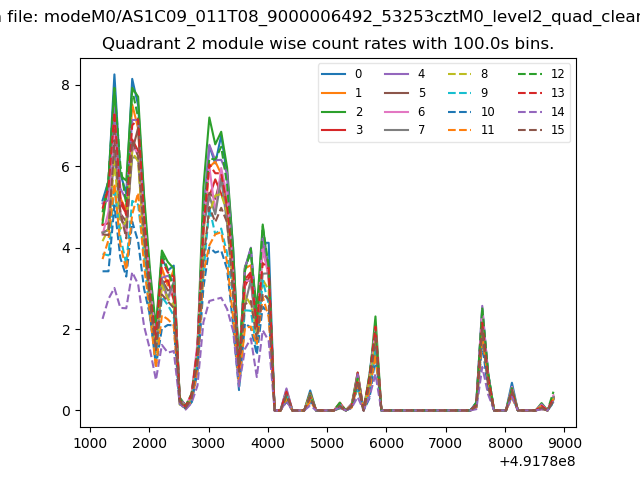
| Module-wise count rates for Quadrant B Data is divided into 100 sec bins |
 |
 |
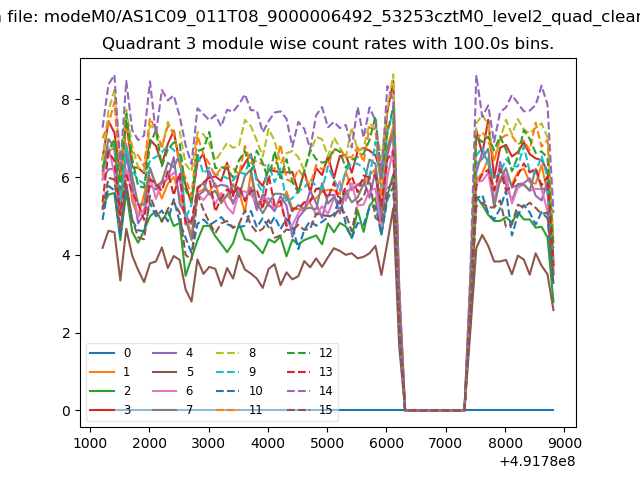
| Module-wise count rates for Quadrant C Data is divided into 100 sec bins |
 |
 |
| Module-wise count rates for Quadrant D Data is divided into 100 sec bins |
 |
 |
| Parameter | Plot |
|---|---|
| CZT HV Monitor | 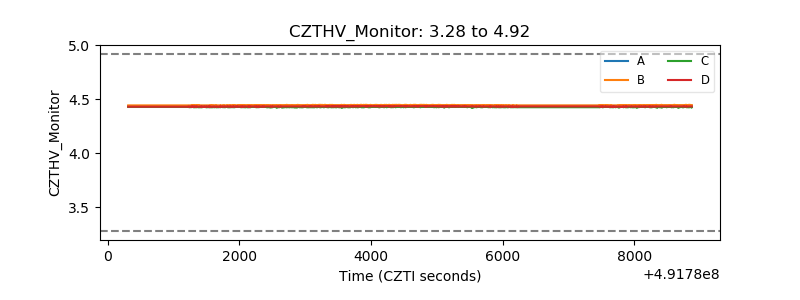 |
| D_VDD | 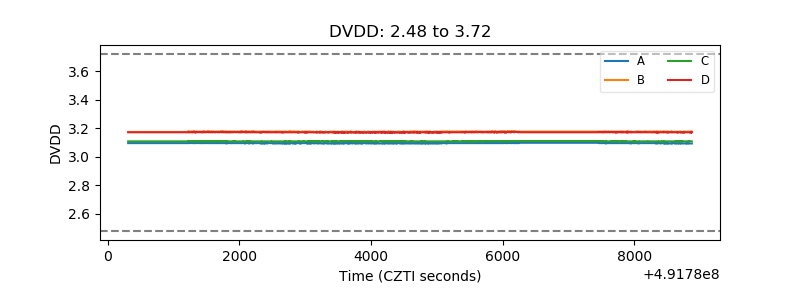 |
| Temperature 1 | 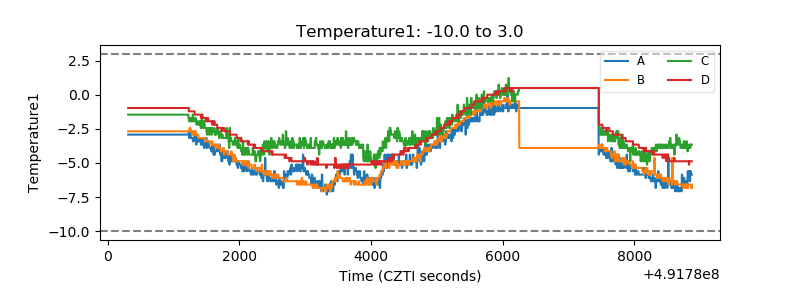 |
| Veto HV Monitor | 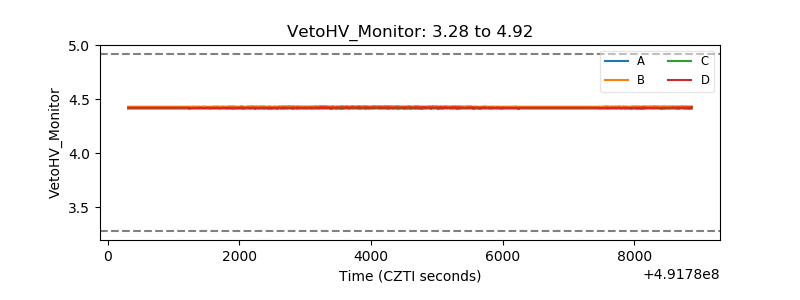 |
| Veto LLD | 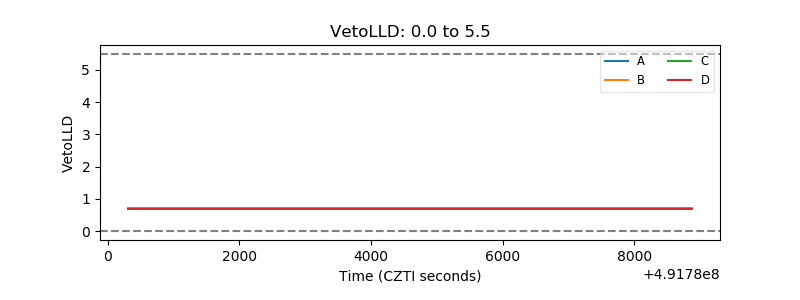 |
| Alpha Counter | 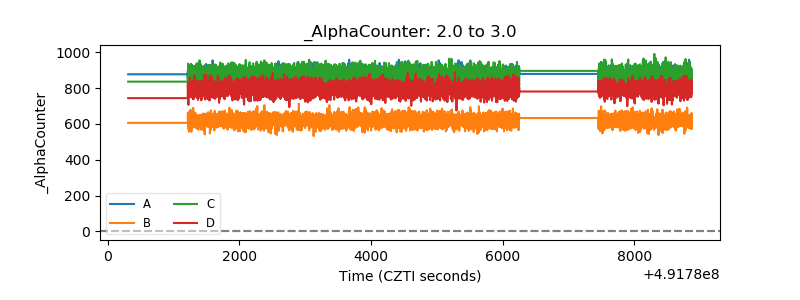 |
| _CPM_Rate | 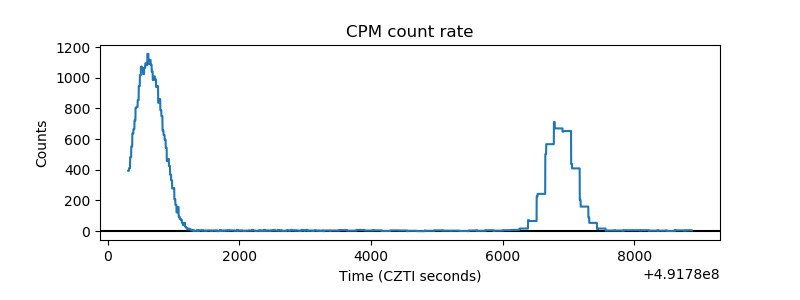 |
| CZT Counter | 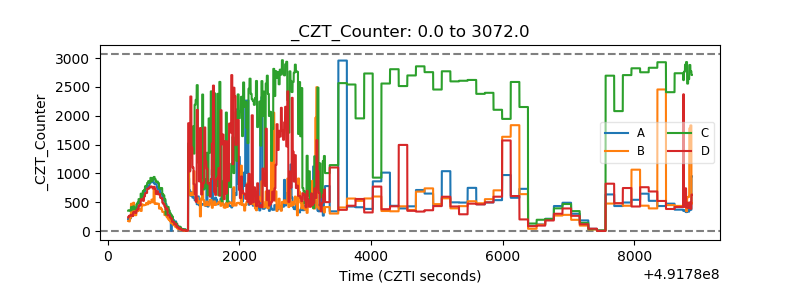 |
| +2.5 Volts monitor |  |
| +5 Volts monitor |  |
| _ROLL_ROT | 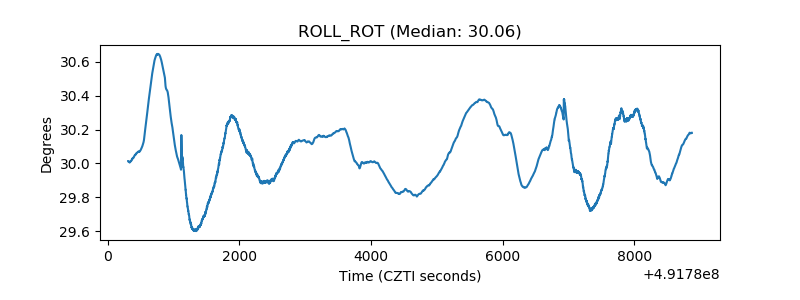 |
| _Roll_DEC | 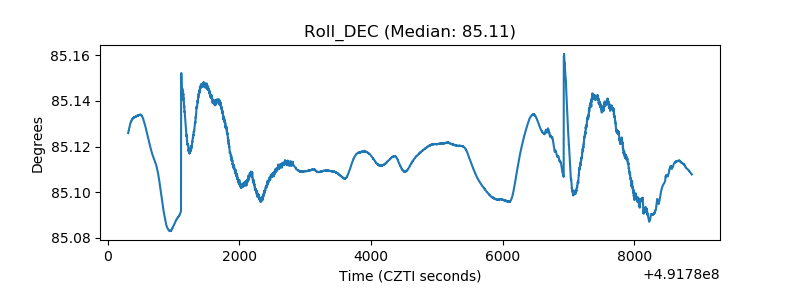 |
| _Roll_RA | 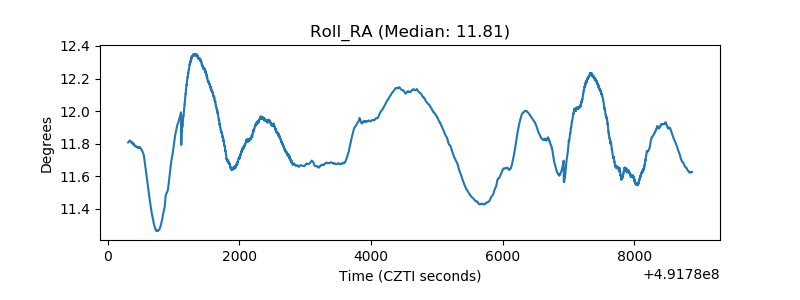 |
| Veto Counter | 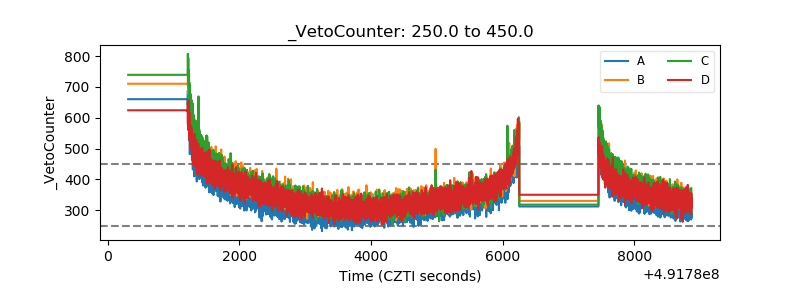 |