| Param | Original file | Final file |
|---|---|---|
| Filename | modeM0/AS1C09_011T08_9000006492_53254cztM0_level2.fits | modeM0/AS1C09_011T08_9000006492_53254cztM0_level2_quad_clean.evt |
| Size (bytes) | 713,813,760 | 86,353,920 |
| Size | 680.7 MB | 82.4 MB |
| Events in quadrant A | 4,014,940 | 634,423 |
| Events in quadrant B | 3,897,555 | 687,708 |
| Events in quadrant C | 13,672,988 | 242,163 |
| Events in quadrant D | 4,313,628 | 579,780 |
| Mode M0 | |||
|---|---|---|---|
| Quadrant | BADHDUFLAG | Total packets | Discarded packets |
| A | 0 | 16923 | 2 |
| B | 0 | 16548 | 2 |
| C | 0 | 45202 | 3 |
| D | 0 | 17680 | 2 |
| Mode M9 | |||
|---|---|---|---|
| Quadrant | BADHDUFLAG | Total packets | Discarded packets |
| A | 0 | 18 | 0 |
| B | 0 | 19 | 0 |
| C | 0 | 19 | 0 |
| D | 0 | 19 | 0 |
| Mode SS | |||
|---|---|---|---|
| Quadrant | BADHDUFLAG | Total packets | Discarded packets |
| A | 0 | 138 | 0 |
| B | 0 | 138 | 0 |
| C | 0 | 138 | 0 |
| D | 0 | 138 | 0 |
| Quadrant | Total seconds | Saturated seconds | Saturation percentage |
|---|---|---|---|
| A | 6746 | 266 | 3.943077% |
| B | 6746 | 238 | 3.528017% |
| C | 6745 | 4386 | 65.025945% |
| D | 6745 | 231 | 3.424759% |
Noise dominated data is calculated using 1-second bins in cleaned event files. If a bin has >2000 counts, and if more than 50% of those come from <1% of pixels, then it is considered to be noise-dominated and hence unusable.
| Quadrant | # 1 sec bins | Bins with >0 counts | Bins with >2000 counts | High rate bins dominated by noise | Noise dominated (total time) | Noise dominated (detector-on time) | Marked lightcurve |
|---|---|---|---|---|---|---|---|
| A | 7886 | 6747 | 212 | 212 | 2.69% | 3.14% | 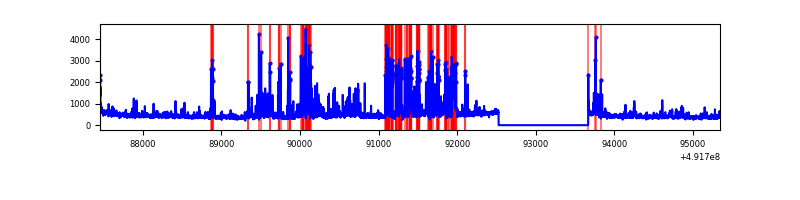 |
| B | 7886 | 6747 | 162 | 162 | 2.05% | 2.40% | 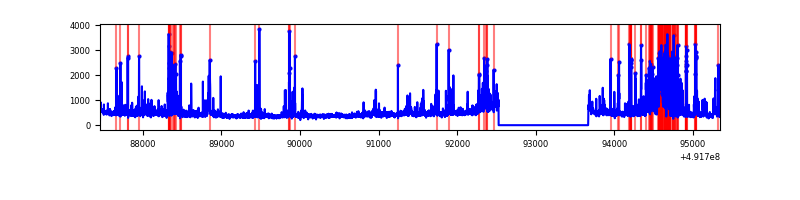 |
| C | 7885 | 6745 | 4122 | 4122 | 52.28% | 61.11% | 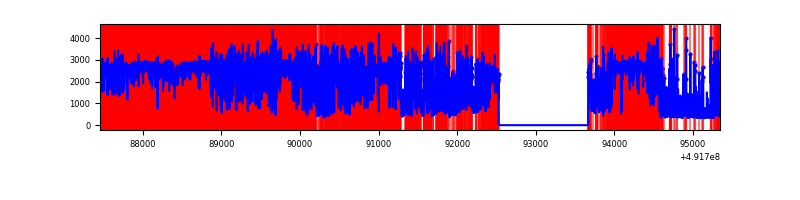 |
| D | 7885 | 6746 | 229 | 229 | 2.90% | 3.39% | 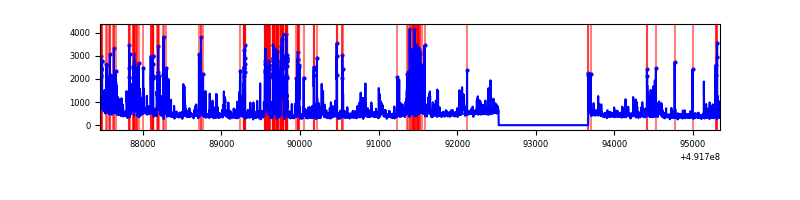 |
Top three noisy pixels from each quadrant. If the there are fewer than three noisy pixels in the level2.evt file, extra rows are filled as -1
| Pixel properties | Quadrant properties | ||||||
|---|---|---|---|---|---|---|---|
| Quadrant | DetID | PixID | Counts | Sigma | Mean | Median | Sigma |
| A | 0 | 8 | 567914 | 3308.19 | 679 | 661 | 171.5 |
| A | 4 | 249 | 289082 | 1682.05 | 679 | 661 | 171.5 |
| A | 7 | 206 | 164241 | 953.99 | 679 | 661 | 171.5 |
| B | 2 | 249 | 421595 | 2920.27 | 682 | 660 | 144.1 |
| B | 4 | 81 | 368977 | 2555.23 | 682 | 660 | 144.1 |
| B | 4 | 171 | 84247 | 579.89 | 682 | 660 | 144.1 |
| C | 1 | 241 | 4985858 | 43619.72 | 413 | 409 | 114.3 |
| C | 15 | 165 | 3442240 | 30113.98 | 413 | 409 | 114.3 |
| C | 15 | 224 | 2095606 | 18331.73 | 413 | 409 | 114.3 |
| D | 11 | 245 | 340972 | 1795.9 | 661 | 632 | 189.5 |
| D | 12 | 17 | 282961 | 1489.79 | 661 | 632 | 189.5 |
| D | 12 | 3 | 185727 | 976.71 | 661 | 632 | 189.5 |
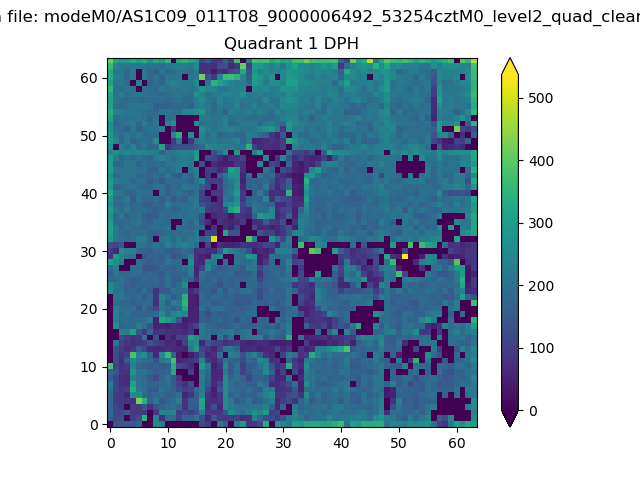
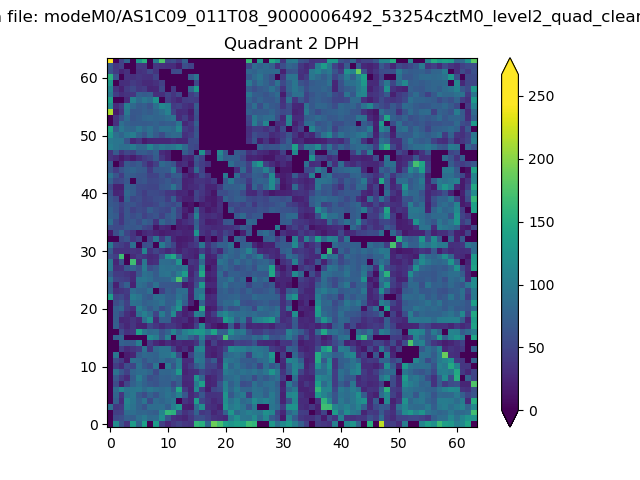
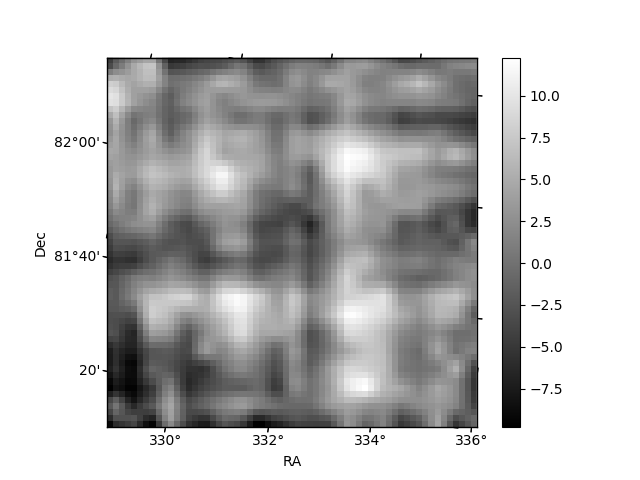
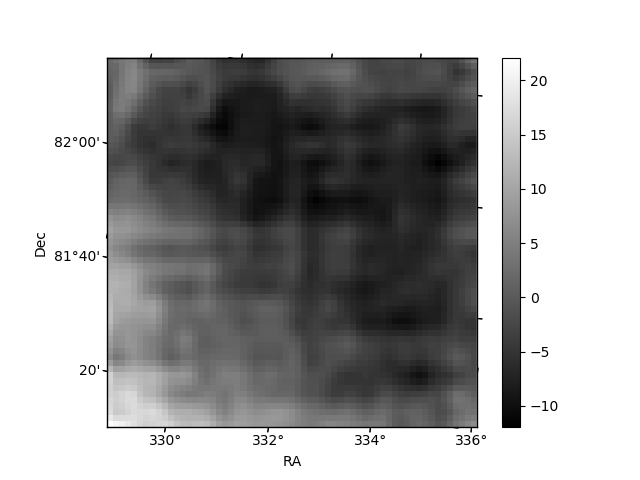
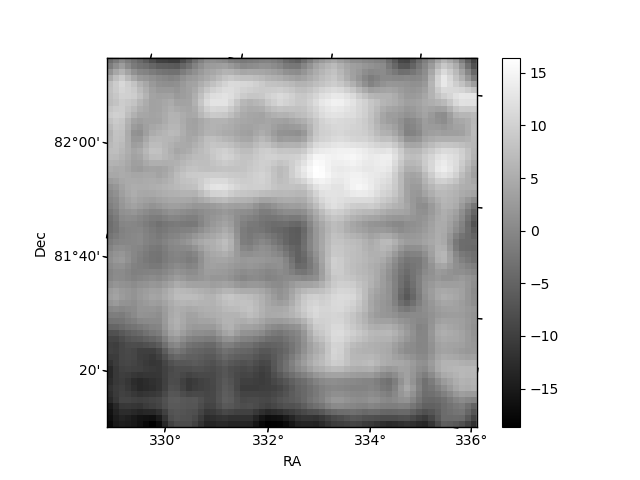
Histogram calculated using DETX and DETY for each event in the final _common_clean file
| Quadrant A |  |
 |
Quadrant B |
|---|---|---|---|
| Quadrant D | 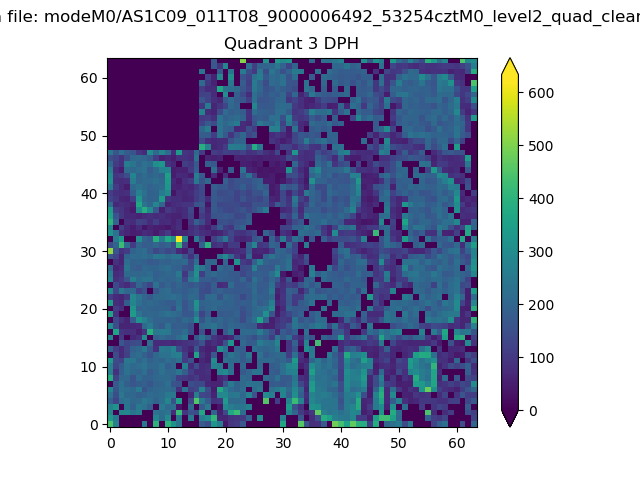 |
 |
Quadrant C |
| Plot type | Count rate plots | Images |
|---|---|---|
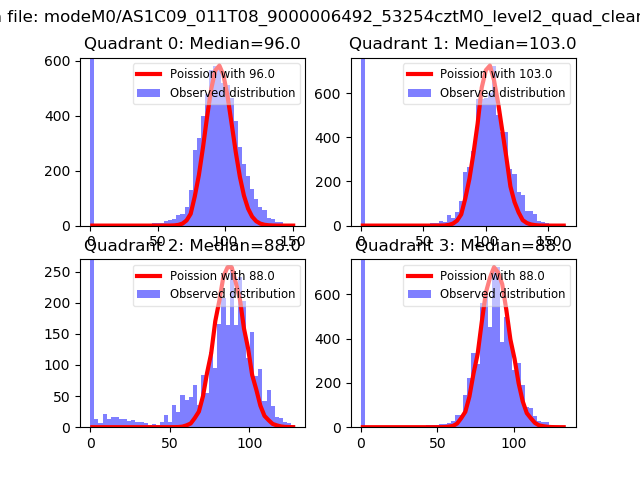
| Comparison with Poisson distribution Blue bars denote a histogram of data divided into 1 sec bins. Red curve is a Poisson curve with rate = median count rate of data. |
 |
 |
| Quadrant-wise count rates Data is divided into 100 sec bins |
 |
|
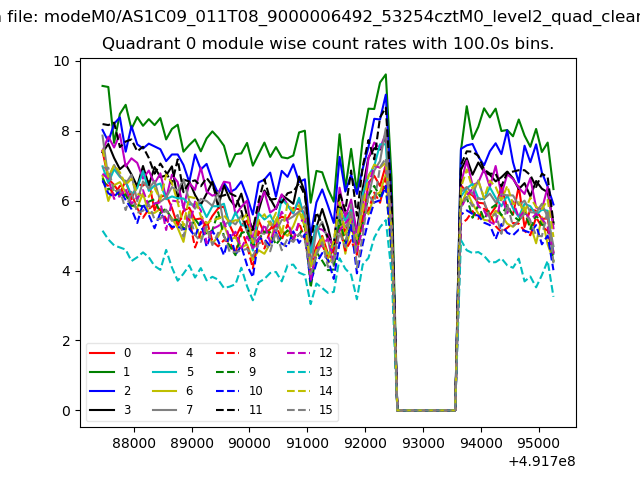
| Module-wise count rates for Quadrant A Data is divided into 100 sec bins |
 |
 |
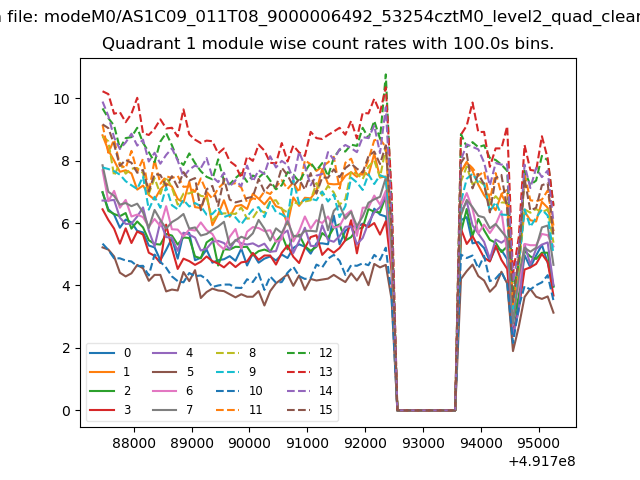
| Module-wise count rates for Quadrant B Data is divided into 100 sec bins |
 |
 |
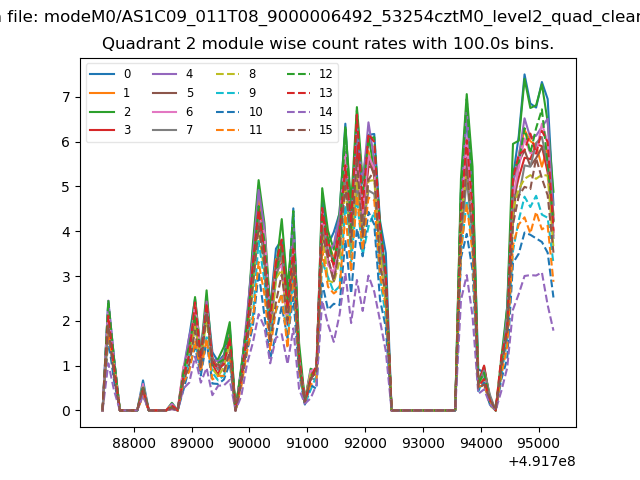
| Module-wise count rates for Quadrant C Data is divided into 100 sec bins |
 |
 |
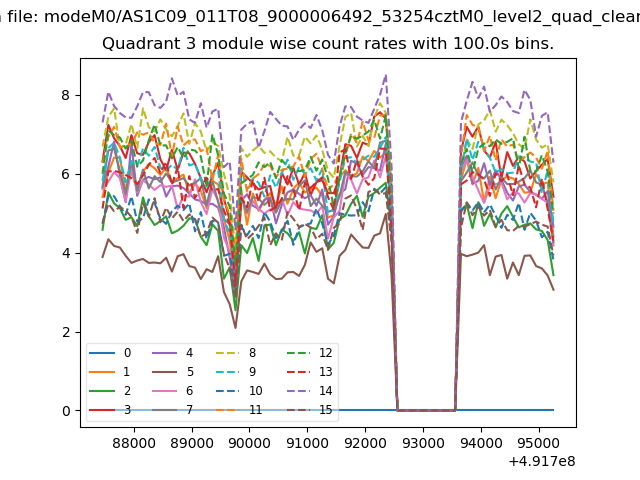
| Module-wise count rates for Quadrant D Data is divided into 100 sec bins |
 |
 |
| Parameter | Plot |
|---|---|
| CZT HV Monitor | 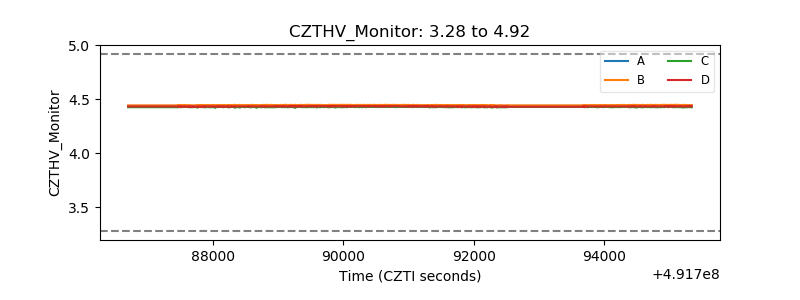 |
| D_VDD | 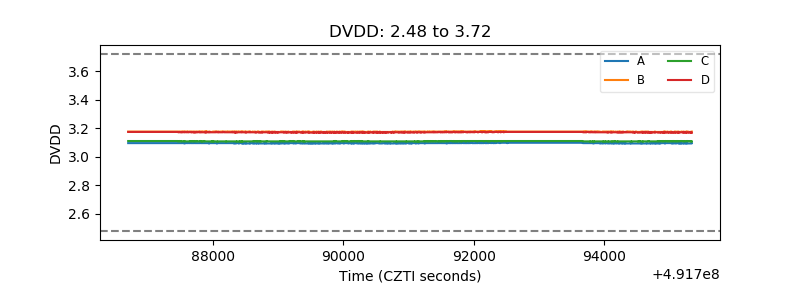 |
| Temperature 1 | 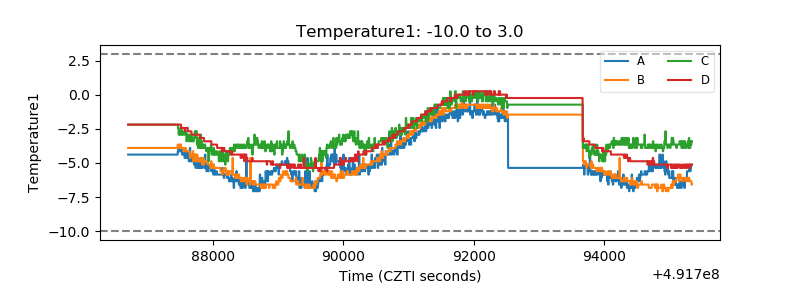 |
| Veto HV Monitor |  |
| Veto LLD | 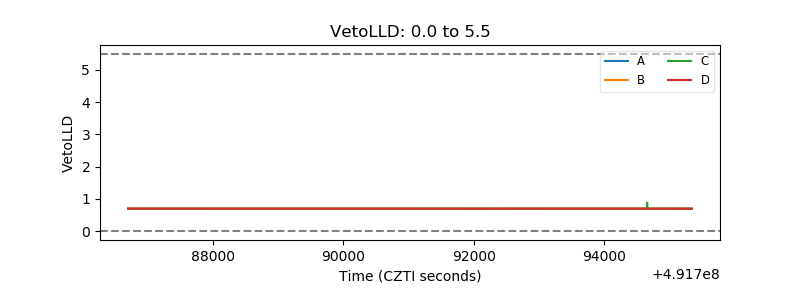 |
| Alpha Counter |  |
| _CPM_Rate | 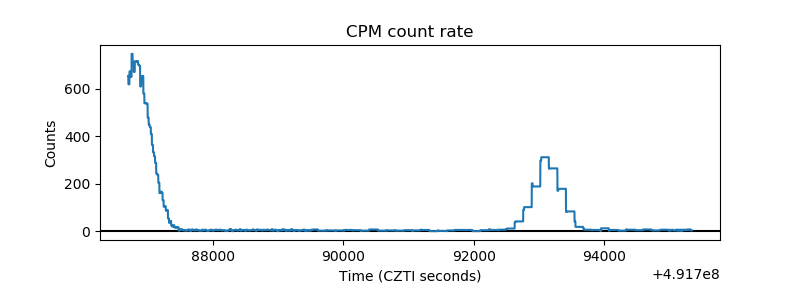 |
| CZT Counter | 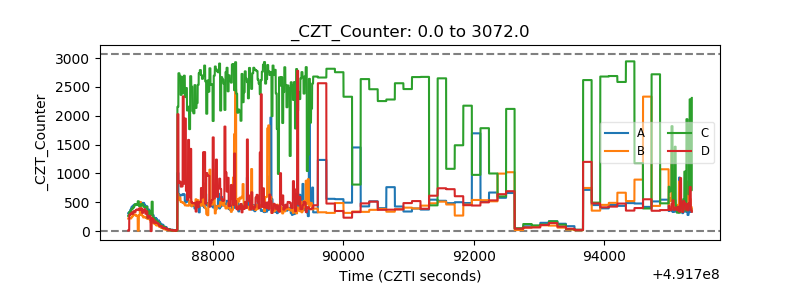 |
| +2.5 Volts monitor | 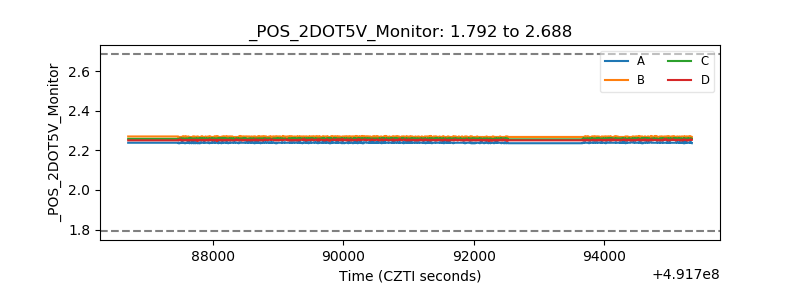 |
| +5 Volts monitor | 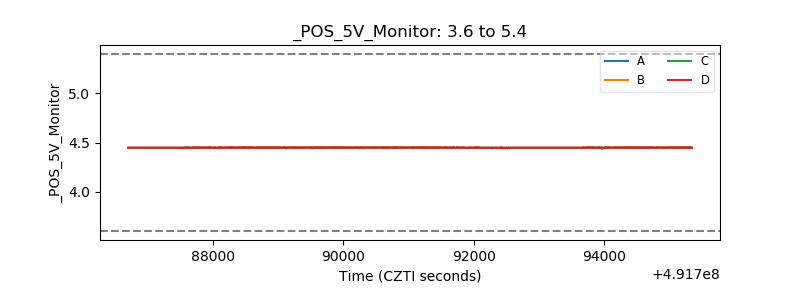 |
| _ROLL_ROT | 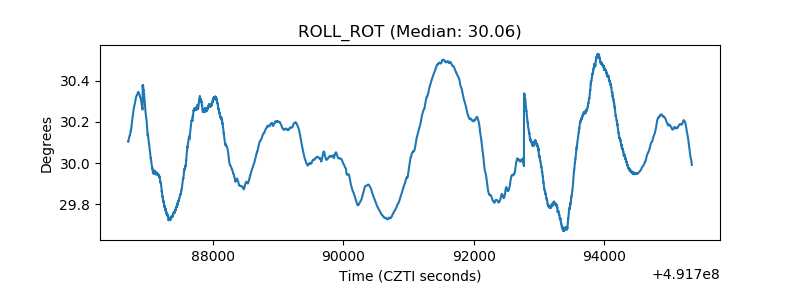 |
| _Roll_DEC | 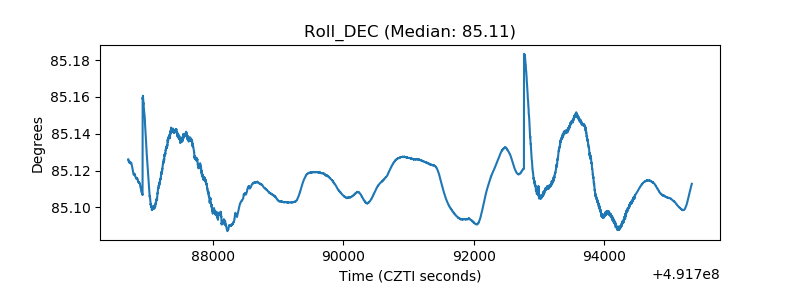 |
| _Roll_RA | 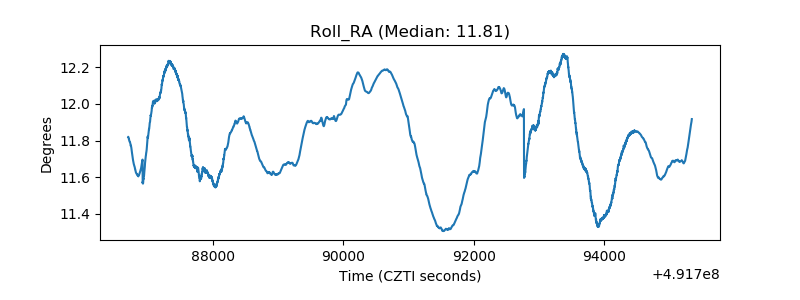 |
| Veto Counter | 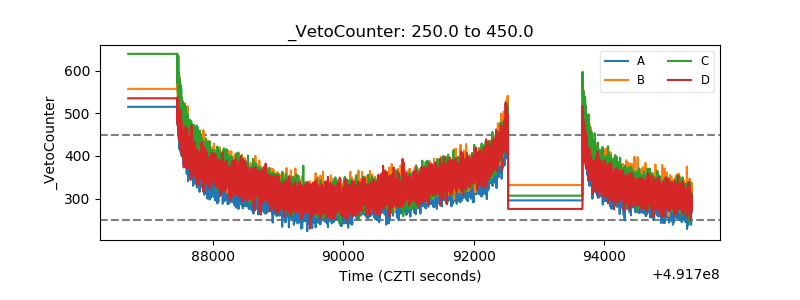 |