| Param | Original file | Final file |
|---|---|---|
| Filename | modeM0/AS1C09_011T08_9000006492_53256cztM0_level2.fits | modeM0/AS1C09_011T08_9000006492_53256cztM0_level2_quad_clean.evt |
| Size (bytes) | 610,744,320 | 108,527,040 |
| Size | 582.5 MB | 103.5 MB |
| Events in quadrant A | 4,278,829 | 706,325 |
| Events in quadrant B | 4,395,685 | 772,266 |
| Events in quadrant C | 8,480,071 | 610,092 |
| Events in quadrant D | 4,850,955 | 657,686 |
| Mode M0 | |||
|---|---|---|---|
| Quadrant | BADHDUFLAG | Total packets | Discarded packets |
| A | 0 | 18663 | 2 |
| B | 0 | 18765 | 2 |
| C | 0 | 30752 | 4 |
| D | 0 | 20033 | 2 |
| Mode M9 | |||
|---|---|---|---|
| Quadrant | BADHDUFLAG | Total packets | Discarded packets |
| A | 0 | 9 | 0 |
| B | 0 | 10 | 0 |
| C | 0 | 10 | 0 |
| D | 0 | 10 | 0 |
| Mode SS | |||
|---|---|---|---|
| Quadrant | BADHDUFLAG | Total packets | Discarded packets |
| A | 0 | 156 | 0 |
| B | 0 | 158 | 0 |
| C | 0 | 158 | 0 |
| D | 0 | 158 | 0 |
| Quadrant | Total seconds | Saturated seconds | Saturation percentage |
|---|---|---|---|
| A | 7763 | 316 | 4.070591% |
| B | 7763 | 258 | 3.323457% |
| C | 7762 | 1251 | 16.116980% |
| D | 7762 | 212 | 2.731255% |
Noise dominated data is calculated using 1-second bins in cleaned event files. If a bin has >2000 counts, and if more than 50% of those come from <1% of pixels, then it is considered to be noise-dominated and hence unusable.
| Quadrant | # 1 sec bins | Bins with >0 counts | Bins with >2000 counts | High rate bins dominated by noise | Noise dominated (total time) | Noise dominated (detector-on time) | Marked lightcurve |
|---|---|---|---|---|---|---|---|
| A | 7898 | 7764 | 219 | 219 | 2.77% | 2.82% | 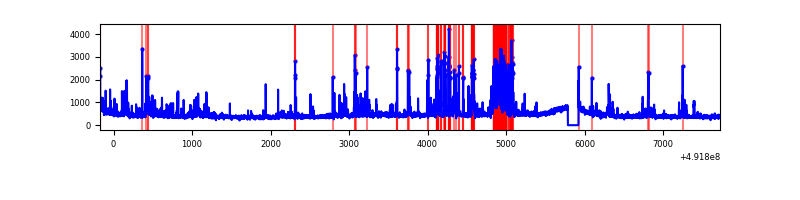 |
| B | 7898 | 7764 | 79 | 79 | 1.00% | 1.02% | 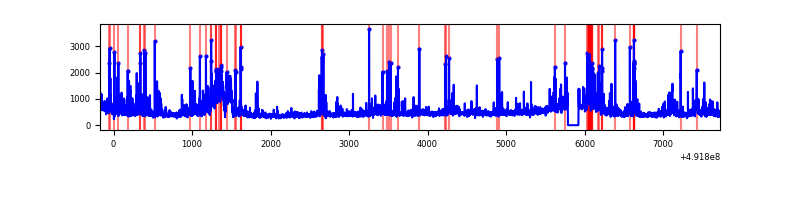 |
| C | 7897 | 7763 | 1050 | 1050 | 13.30% | 13.53% | 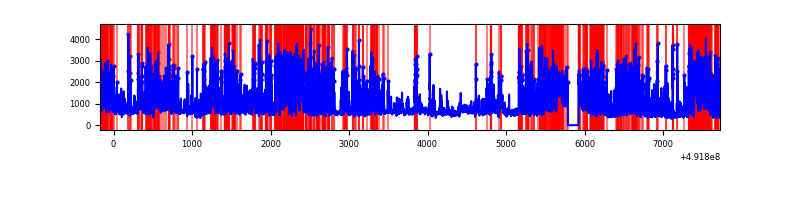 |
| D | 7897 | 7763 | 180 | 180 | 2.28% | 2.32% | 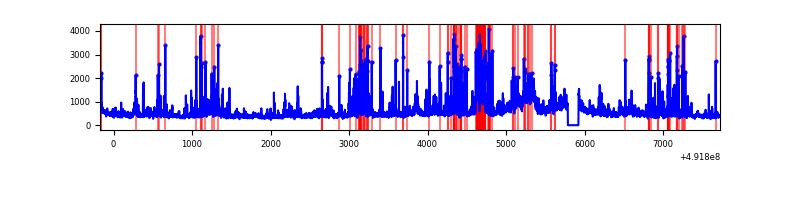 |
Top three noisy pixels from each quadrant. If the there are fewer than three noisy pixels in the level2.evt file, extra rows are filled as -1
| Pixel properties | Quadrant properties | ||||||
|---|---|---|---|---|---|---|---|
| Quadrant | DetID | PixID | Counts | Sigma | Mean | Median | Sigma |
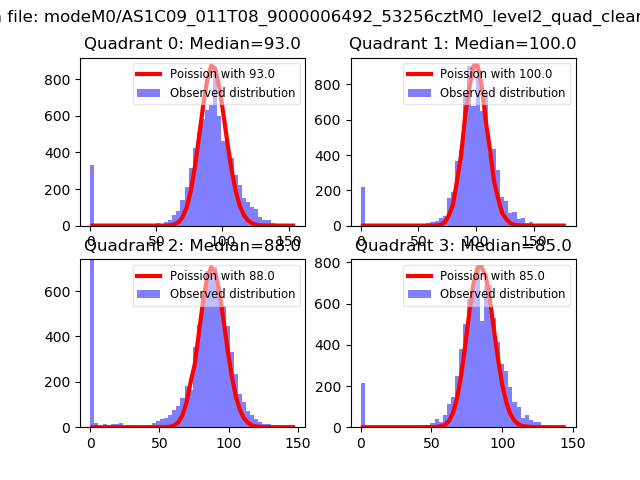
| A | 0 | 8 | 267716 | 1354.66 | 797 | 775 | 197.1 |
| A | 8 | 47 | 258156 | 1306.15 | 797 | 775 | 197.1 |
| A | 8 | 63 | 207962 | 1051.42 | 797 | 775 | 197.1 |
| B | 10 | 254 | 358851 | 2069.35 | 805 | 774 | 173.0 |
| B | 4 | 81 | 293691 | 1692.79 | 805 | 774 | 173.0 |
| B | 2 | 249 | 234695 | 1351.85 | 805 | 774 | 173.0 |
| C | 15 | 224 | 3435869 | 17070.1 | 732 | 726 | 201.2 |
| C | 10 | 22 | 959759 | 4765.68 | 732 | 726 | 201.2 |
| C | 13 | 3 | 354292 | 1756.96 | 732 | 726 | 201.2 |
| D | 6 | 42 | 424861 | 1916.05 | 779 | 743 | 221.4 |
| D | 10 | 172 | 346778 | 1563.29 | 779 | 743 | 221.4 |
| D | 1 | 0 | 260708 | 1174.45 | 779 | 743 | 221.4 |
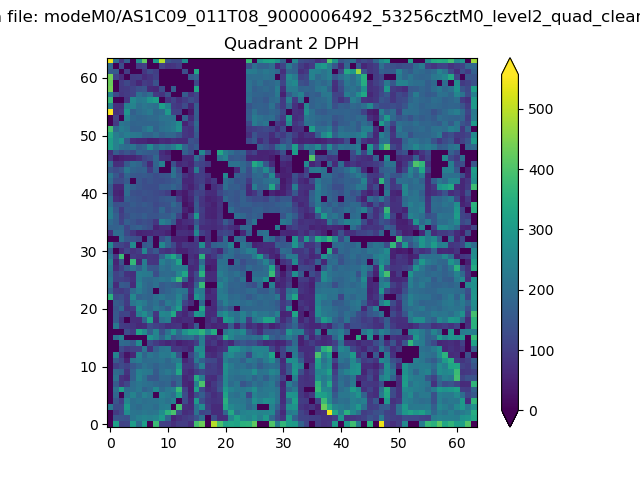
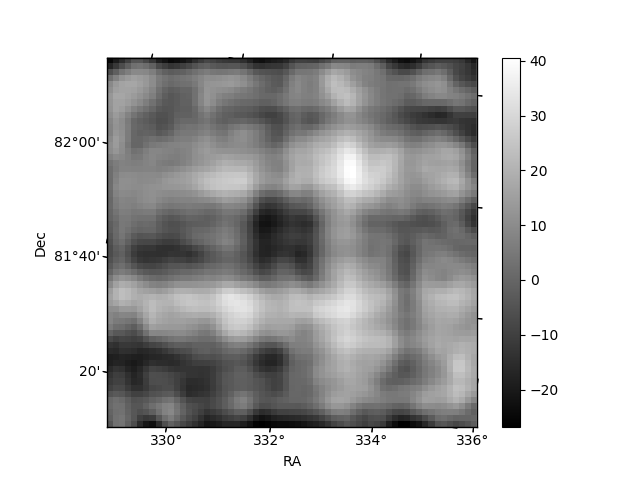
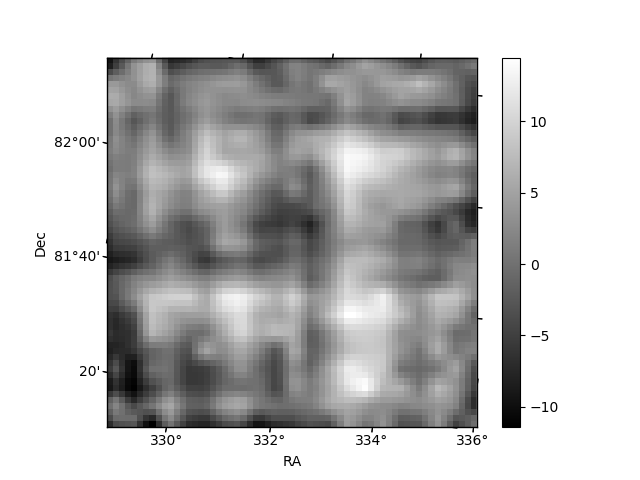
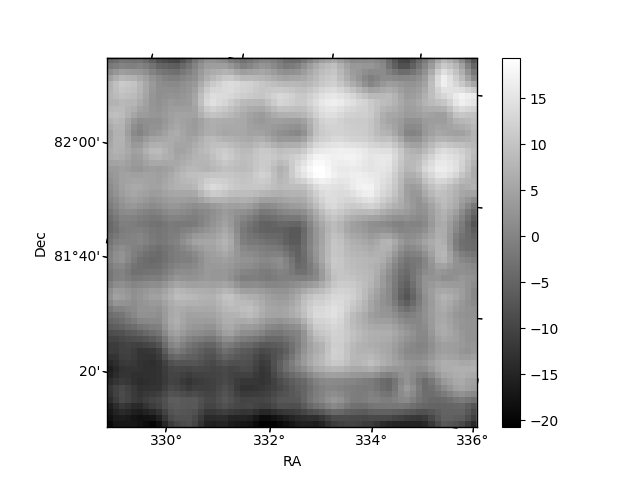
Histogram calculated using DETX and DETY for each event in the final _common_clean file
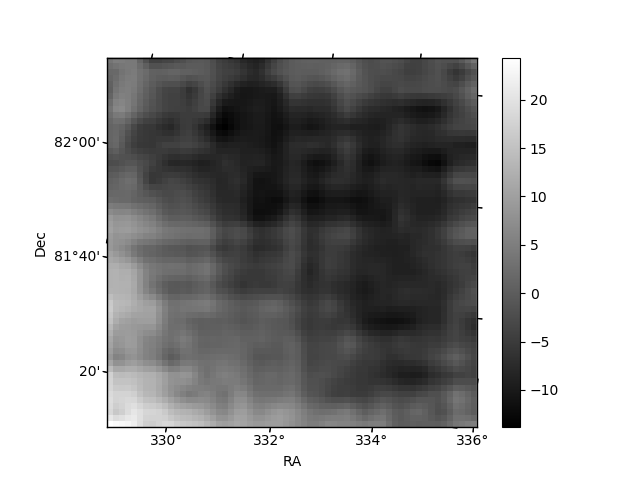
| Quadrant A | 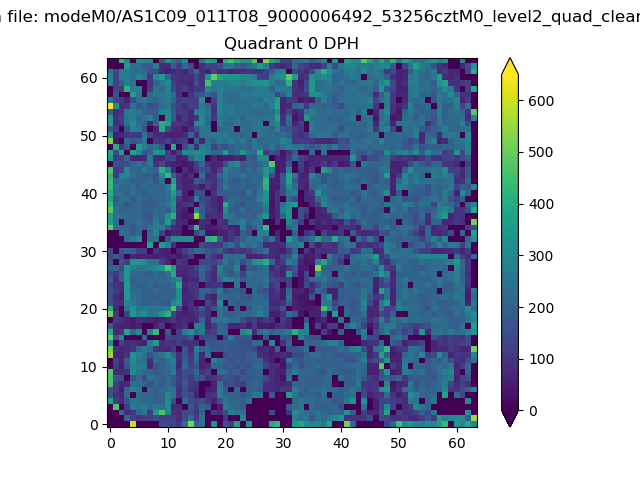 |
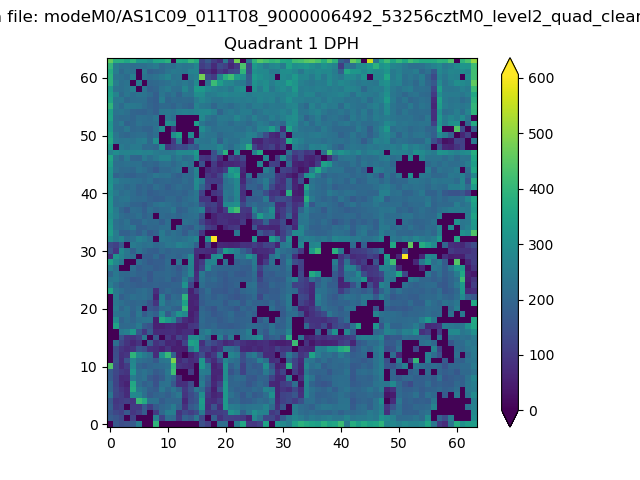 |
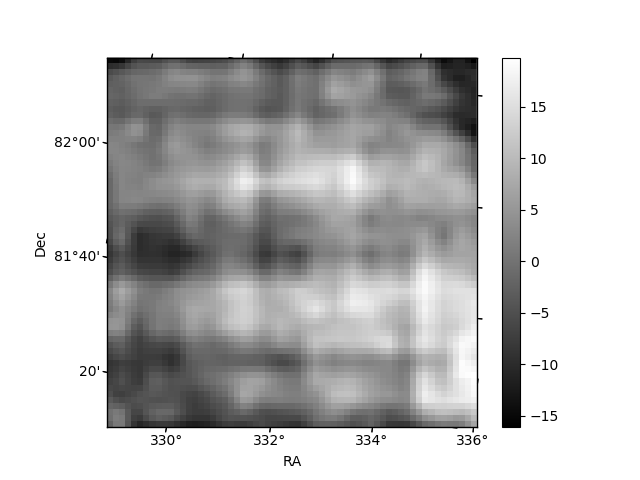
Quadrant B |
|---|---|---|---|
| Quadrant D | 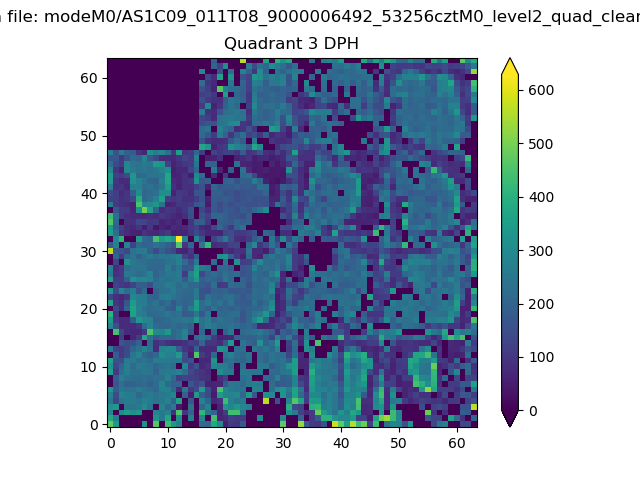 |
 |
Quadrant C |
| Plot type | Count rate plots | Images |
|---|---|---|
| Comparison with Poisson distribution Blue bars denote a histogram of data divided into 1 sec bins. Red curve is a Poisson curve with rate = median count rate of data. |
 |
 |
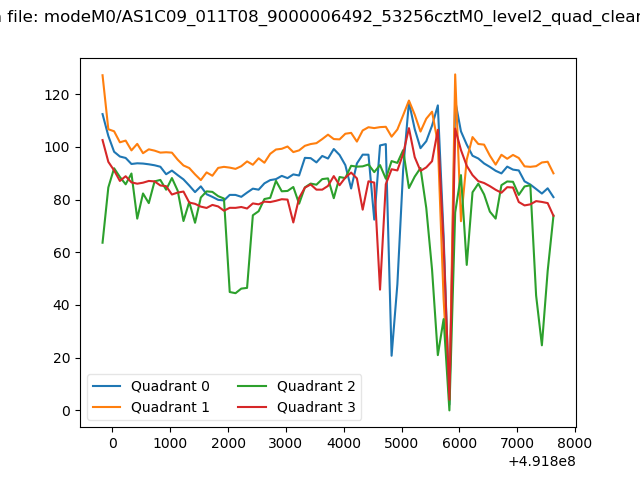
| Quadrant-wise count rates Data is divided into 100 sec bins |
 |
|
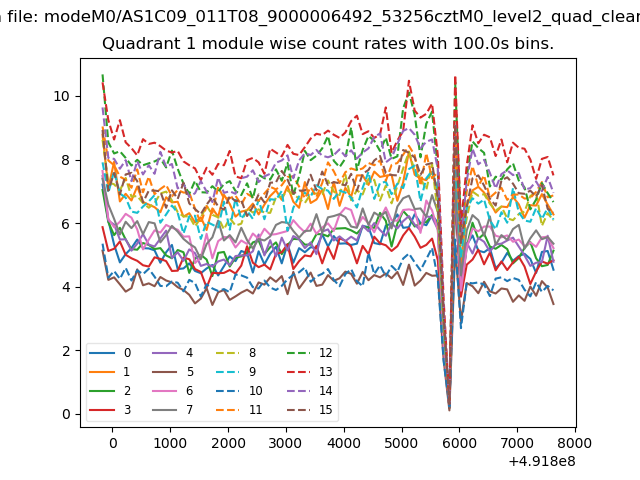
| Module-wise count rates for Quadrant A Data is divided into 100 sec bins |
 |
 |
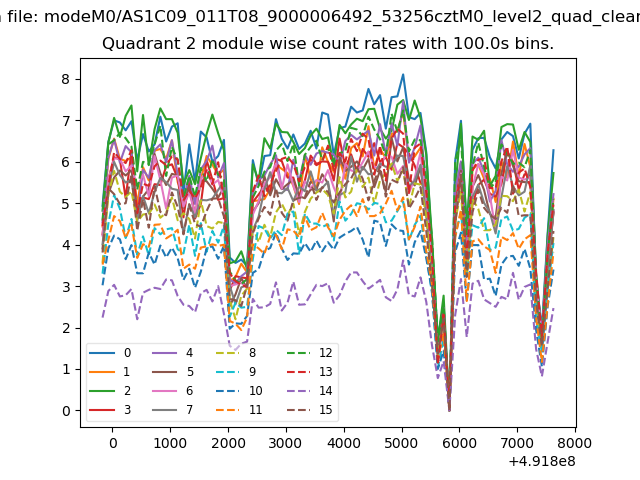
| Module-wise count rates for Quadrant B Data is divided into 100 sec bins |
 |
 |
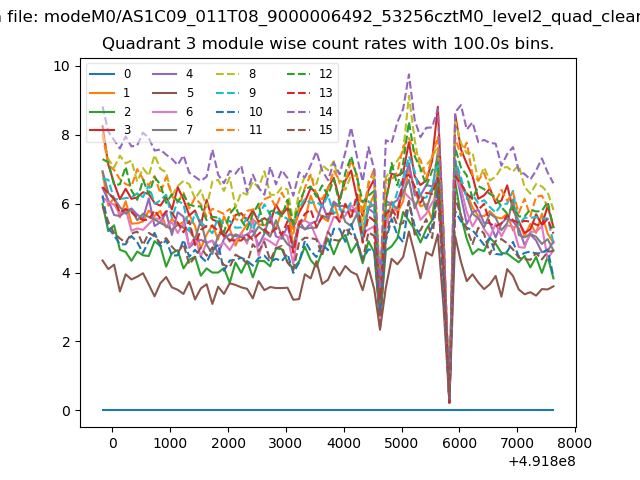
| Module-wise count rates for Quadrant C Data is divided into 100 sec bins |
 |
 |
| Module-wise count rates for Quadrant D Data is divided into 100 sec bins |
 |
 |
| Parameter | Plot |
|---|---|
| CZT HV Monitor | 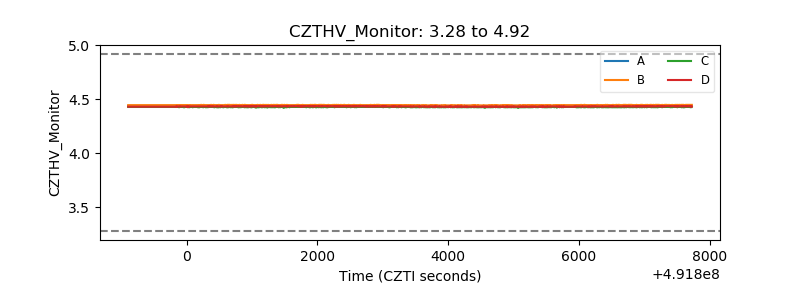 |
| D_VDD | 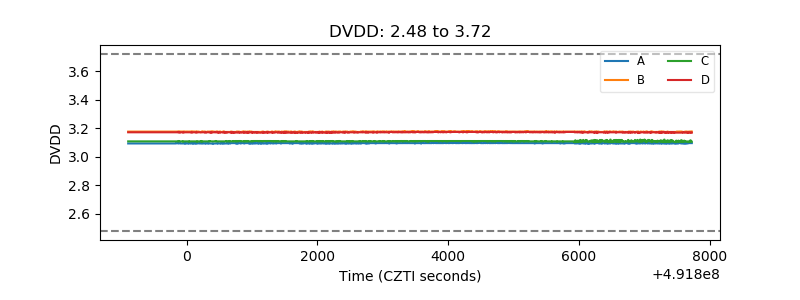 |
| Temperature 1 | 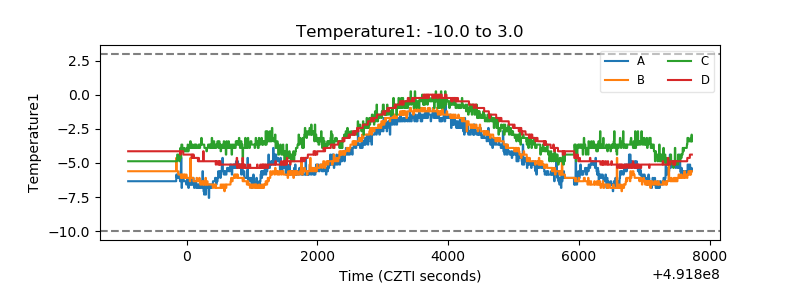 |
| Veto HV Monitor | 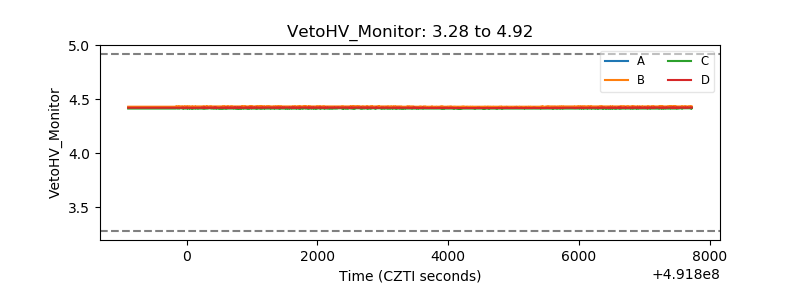 |
| Veto LLD | 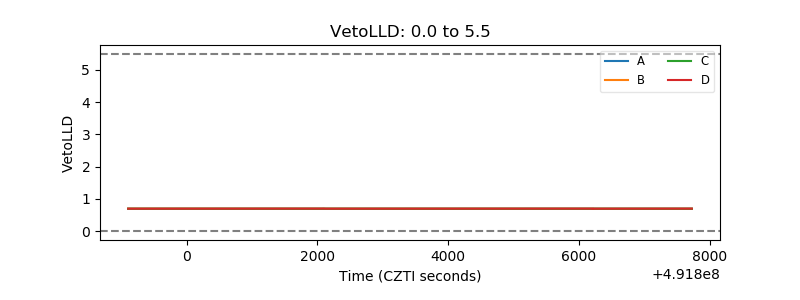 |
| Alpha Counter | 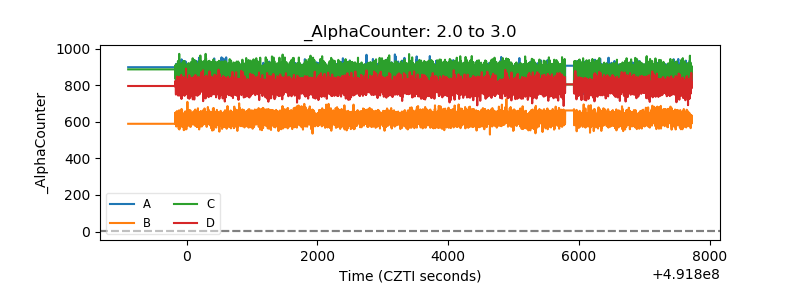 |
| _CPM_Rate | 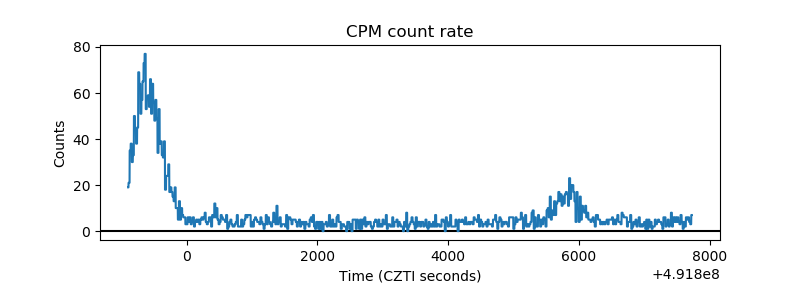 |
| CZT Counter | 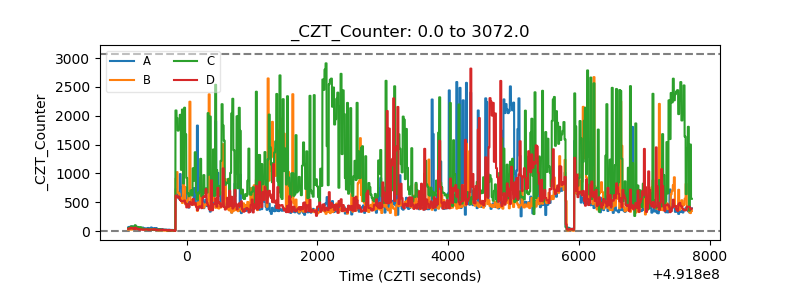 |
| +2.5 Volts monitor |  |
| +5 Volts monitor | 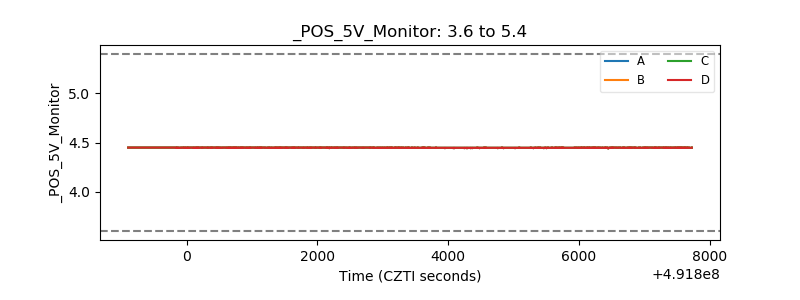 |
| _ROLL_ROT | 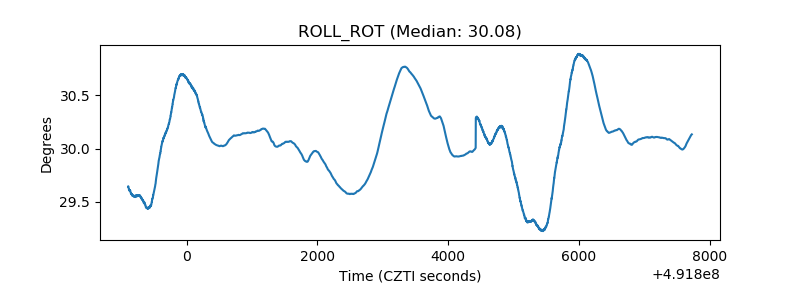 |
| _Roll_DEC | 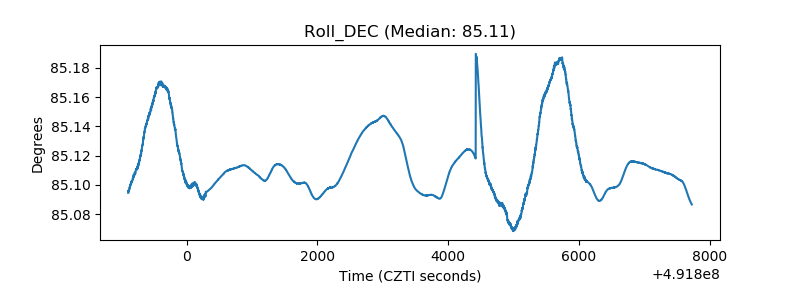 |
| _Roll_RA | 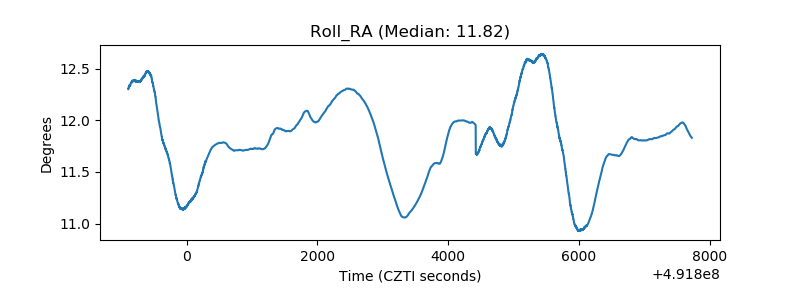 |
| Veto Counter | 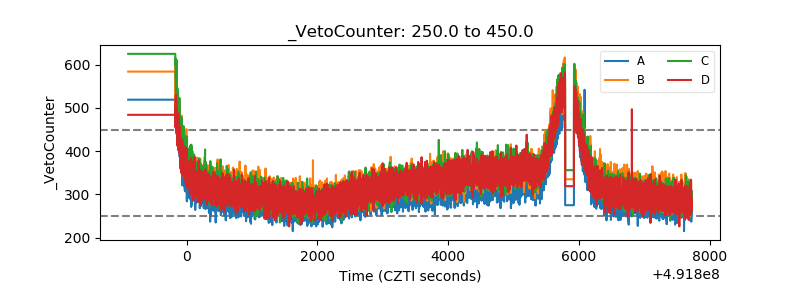 |