| Param | Original file | Final file |
|---|---|---|
| Filename | modeM0/AS1C09_011T08_9000006492_53257cztM0_level2.fits | modeM0/AS1C09_011T08_9000006492_53257cztM0_level2_quad_clean.evt |
| Size (bytes) | 656,524,800 | 99,360,000 |
| Size | 626.1 MB | 94.8 MB |
| Events in quadrant A | 4,212,855 | 670,619 |
| Events in quadrant B | 4,275,881 | 713,842 |
| Events in quadrant C | 9,940,825 | 505,864 |
| Events in quadrant D | 5,305,870 | 608,685 |
| Mode M0 | |||
|---|---|---|---|
| Quadrant | BADHDUFLAG | Total packets | Discarded packets |
| A | 0 | 17975 | 0 |
| B | 0 | 17920 | 0 |
| C | 0 | 34606 | 4 |
| D | 0 | 20944 | 0 |
| Mode SS | |||
|---|---|---|---|
| Quadrant | BADHDUFLAG | Total packets | Discarded packets |
| A | 0 | 146 | 0 |
| B | 0 | 146 | 0 |
| C | 0 | 146 | 0 |
| D | 0 | 146 | 0 |
| Quadrant | Total seconds | Saturated seconds | Saturation percentage |
|---|---|---|---|
| A | 7316 | 187 | 2.556042% |
| B | 7317 | 232 | 3.170698% |
| C | 7316 | 1979 | 27.050301% |
| D | 7316 | 221 | 3.020776% |
Noise dominated data is calculated using 1-second bins in cleaned event files. If a bin has >2000 counts, and if more than 50% of those come from <1% of pixels, then it is considered to be noise-dominated and hence unusable.
| Quadrant | # 1 sec bins | Bins with >0 counts | Bins with >2000 counts | High rate bins dominated by noise | Noise dominated (total time) | Noise dominated (detector-on time) | Marked lightcurve |
|---|---|---|---|---|---|---|---|
| A | 7316 | 7316 | 154 | 154 | 2.10% | 2.10% | 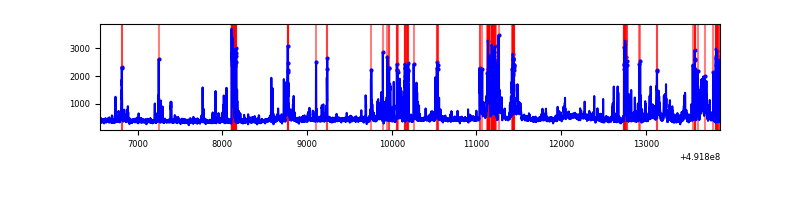 |
| B | 7317 | 7317 | 171 | 171 | 2.34% | 2.34% | 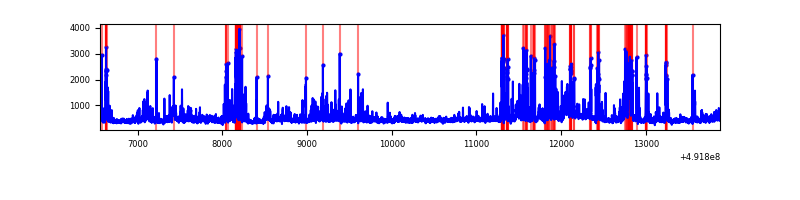 |
| C | 7316 | 7316 | 1809 | 1809 | 24.73% | 24.73% | 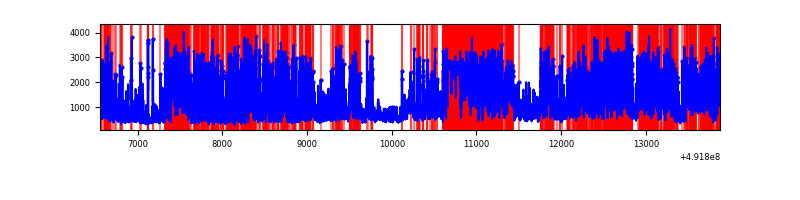 |
| D | 7316 | 7316 | 226 | 226 | 3.09% | 3.09% | 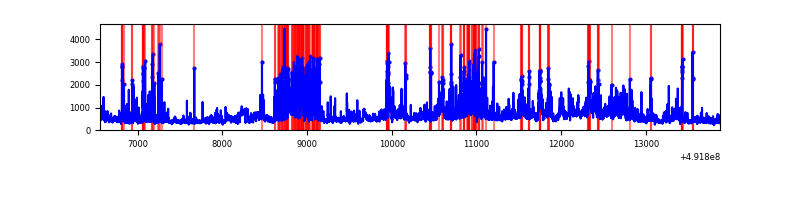 |
Top three noisy pixels from each quadrant. If the there are fewer than three noisy pixels in the level2.evt file, extra rows are filled as -1
| Pixel properties | Quadrant properties | ||||||
|---|---|---|---|---|---|---|---|
| Quadrant | DetID | PixID | Counts | Sigma | Mean | Median | Sigma |
| A | 7 | 206 | 608776 | 3338.34 | 739 | 722 | 182.1 |
| A | 0 | 8 | 125285 | 683.88 | 739 | 722 | 182.1 |
| A | 4 | 238 | 115971 | 632.74 | 739 | 722 | 182.1 |
| B | 2 | 249 | 471552 | 3005.65 | 734 | 710 | 156.7 |
| B | 4 | 81 | 338840 | 2158.48 | 734 | 710 | 156.7 |
| B | 5 | 185 | 219139 | 1394.36 | 734 | 710 | 156.7 |
| C | 15 | 224 | 4715332 | 26820.32 | 636 | 629 | 175.8 |
| C | 10 | 22 | 645342 | 3667.55 | 636 | 629 | 175.8 |
| C | 15 | 147 | 621129 | 3529.81 | 636 | 629 | 175.8 |
| D | 6 | 42 | 724175 | 3572.91 | 712 | 681 | 202.5 |
| D | 10 | 172 | 600121 | 2960.28 | 712 | 681 | 202.5 |
| D | 1 | 0 | 275134 | 1355.36 | 712 | 681 | 202.5 |
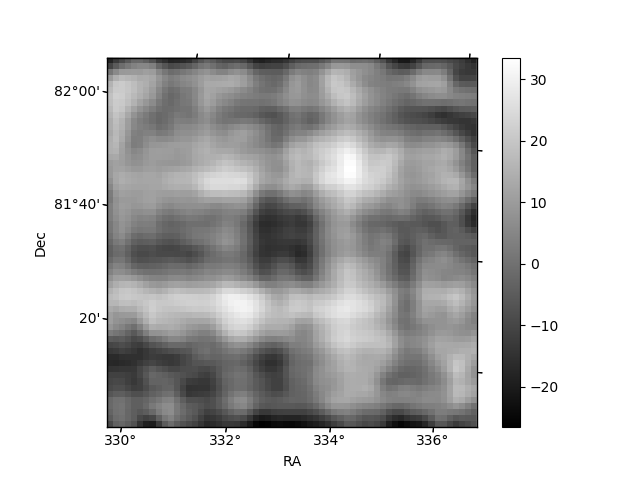
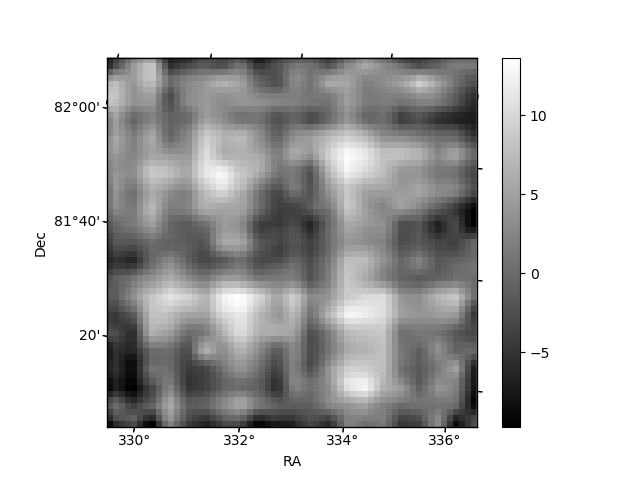
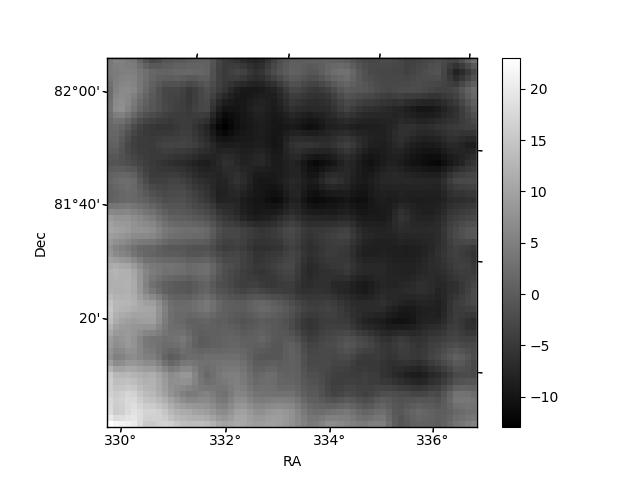
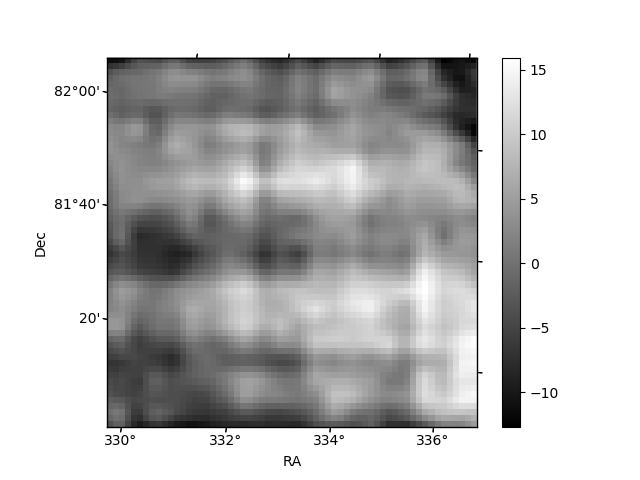
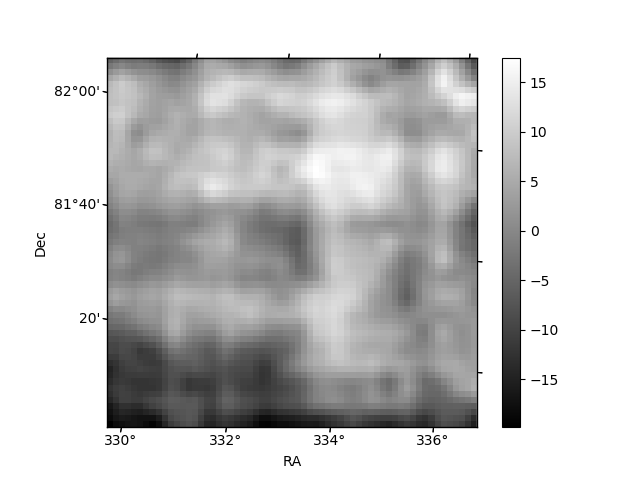
Histogram calculated using DETX and DETY for each event in the final _common_clean file
| Quadrant A | 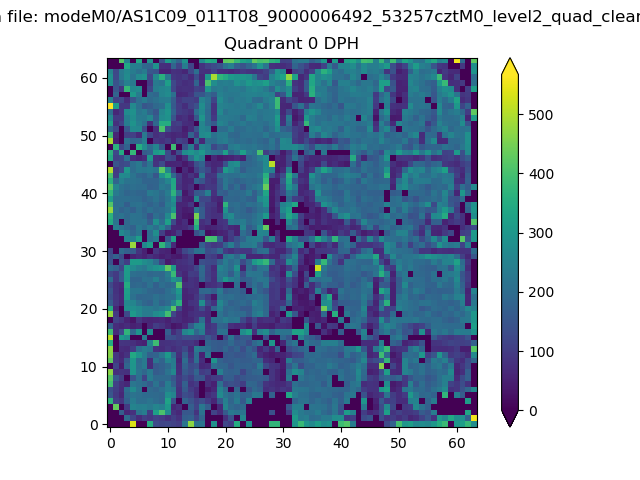 |
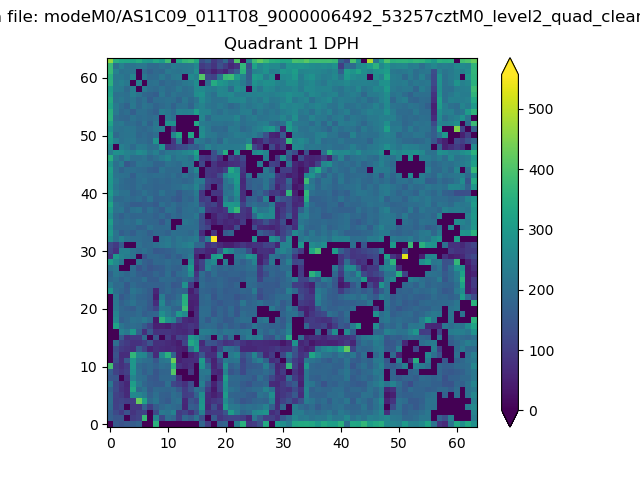 |
Quadrant B |
|---|---|---|---|
| Quadrant D | 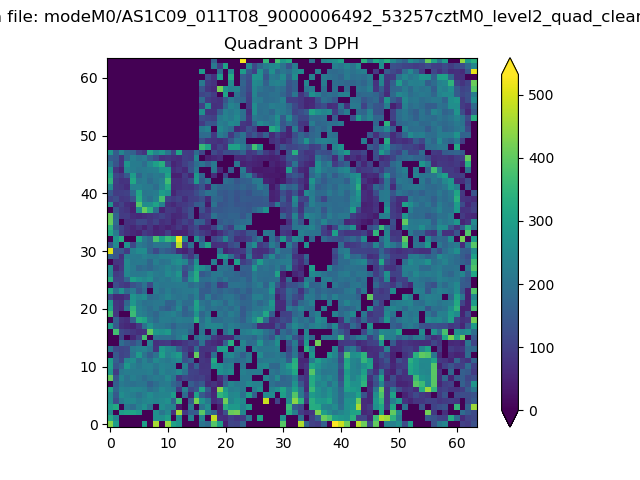 |
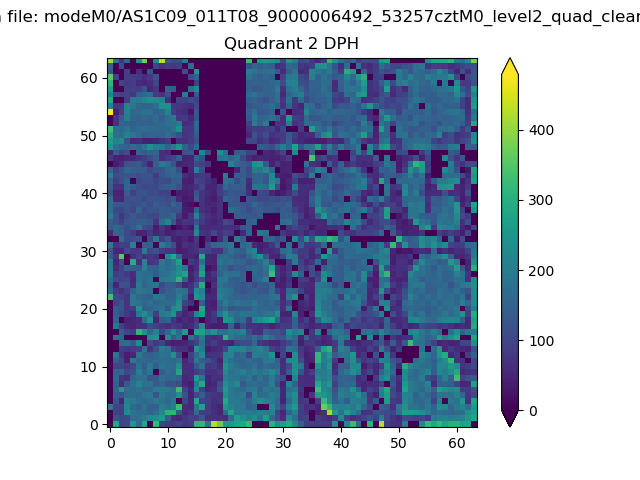 |
Quadrant C |
| Plot type | Count rate plots | Images |
|---|---|---|
| Comparison with Poisson distribution Blue bars denote a histogram of data divided into 1 sec bins. Red curve is a Poisson curve with rate = median count rate of data. |
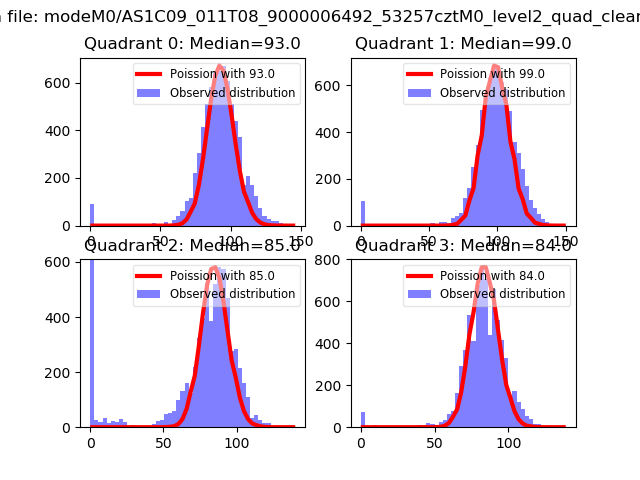 |
 |
| Quadrant-wise count rates Data is divided into 100 sec bins |
 |
|
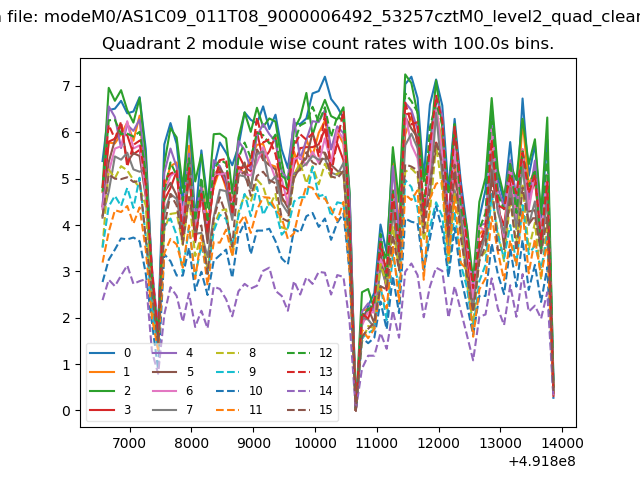
| Module-wise count rates for Quadrant A Data is divided into 100 sec bins |
 |
 |
| Module-wise count rates for Quadrant B Data is divided into 100 sec bins |
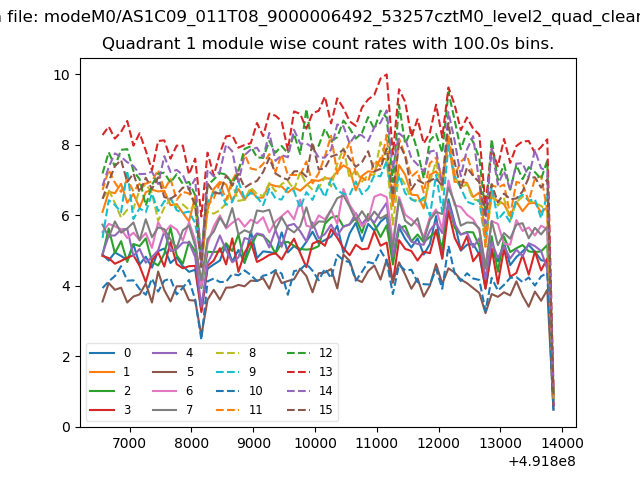 |
 |
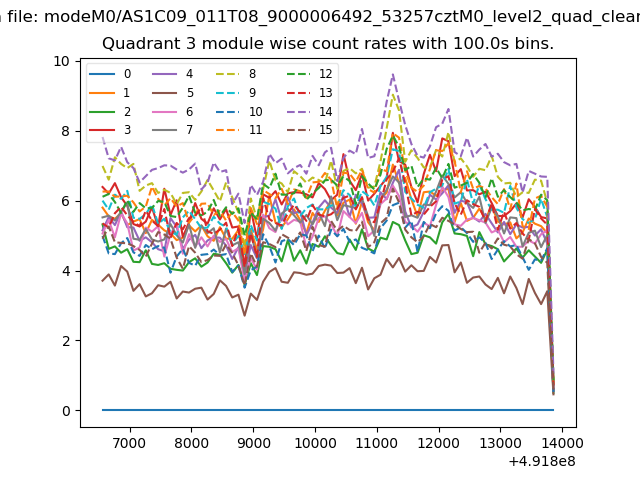
| Module-wise count rates for Quadrant C Data is divided into 100 sec bins |
 |
 |
| Module-wise count rates for Quadrant D Data is divided into 100 sec bins |
 |
 |
| Parameter | Plot |
|---|---|
| CZT HV Monitor | 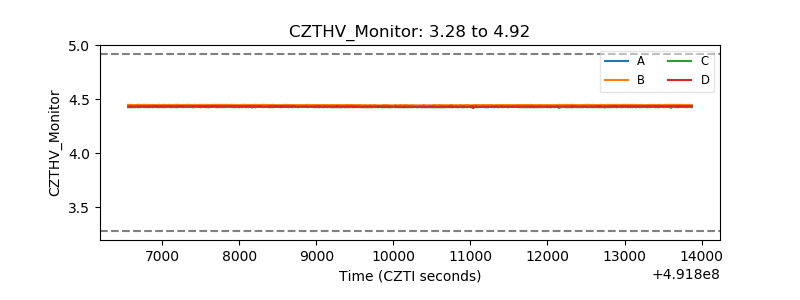 |
| D_VDD | 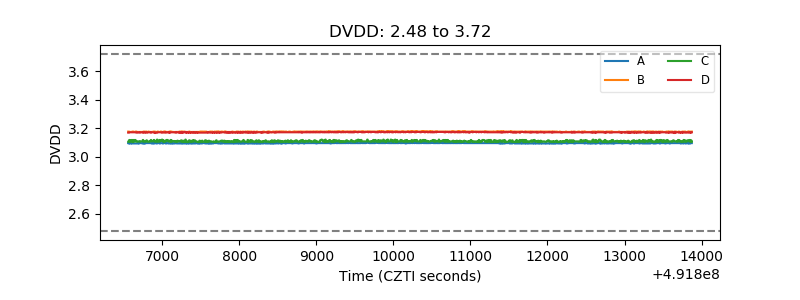 |
| Temperature 1 | 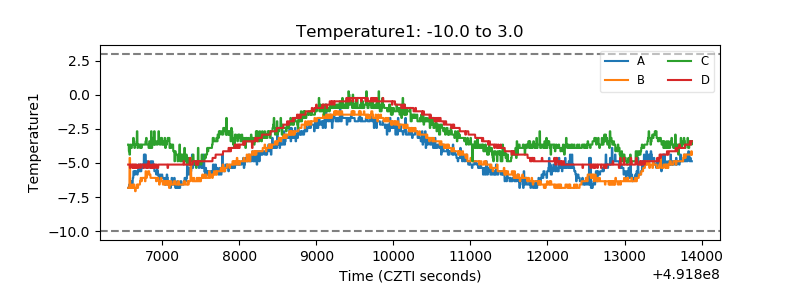 |
| Veto HV Monitor | 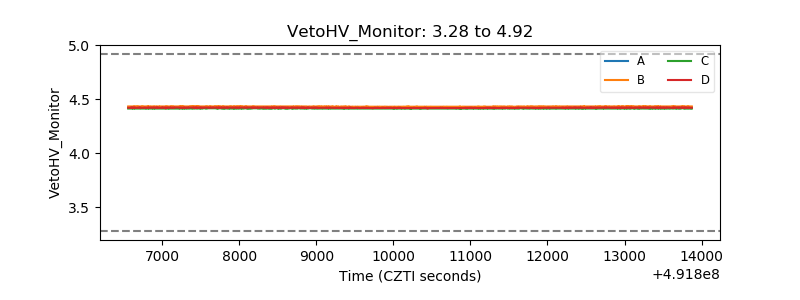 |
| Veto LLD | 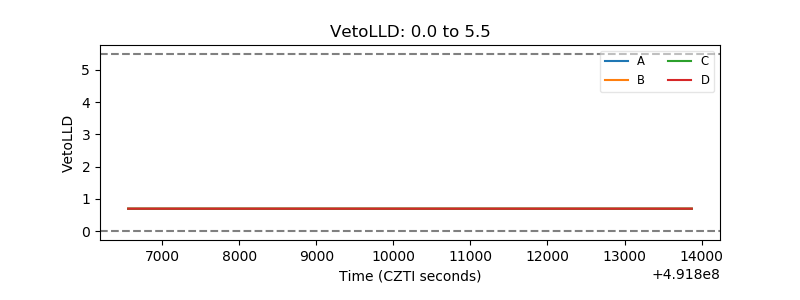 |
| Alpha Counter | 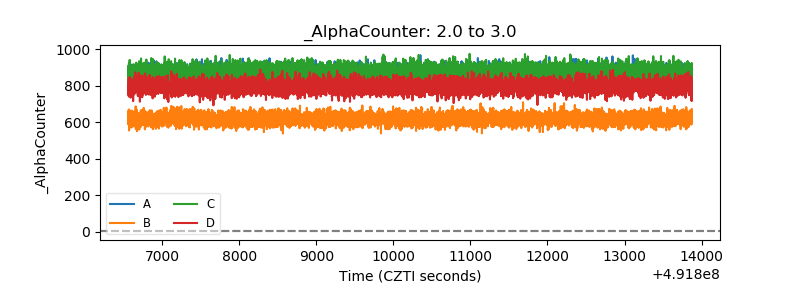 |
| _CPM_Rate | 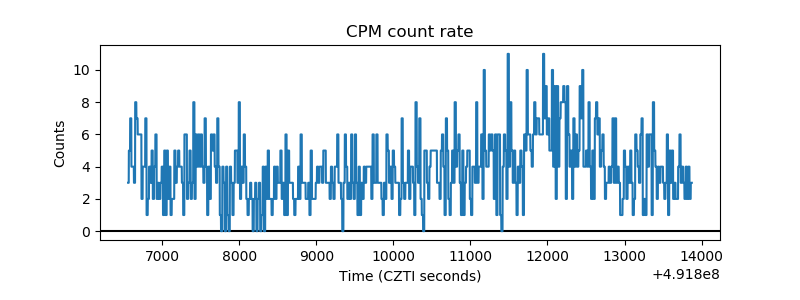 |
| CZT Counter | 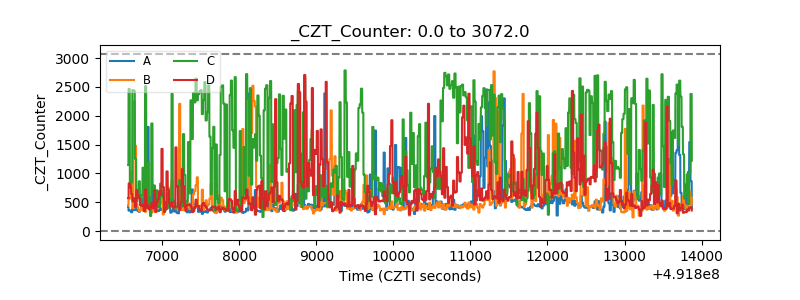 |
| +2.5 Volts monitor |  |
| +5 Volts monitor |  |
| _ROLL_ROT | 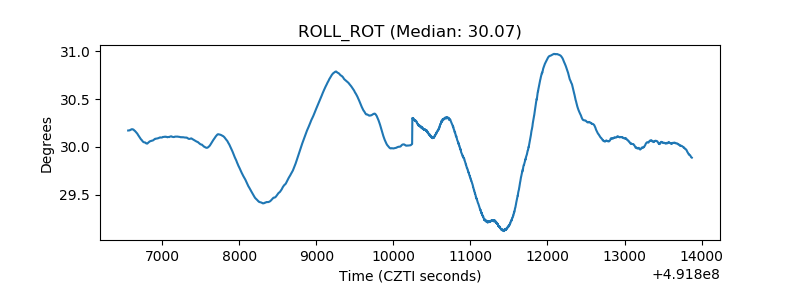 |
| _Roll_DEC | 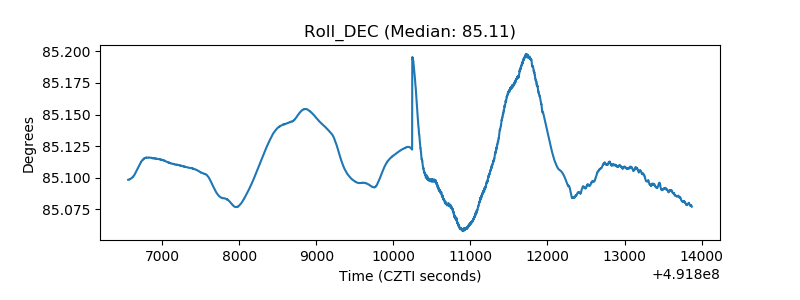 |
| _Roll_RA | 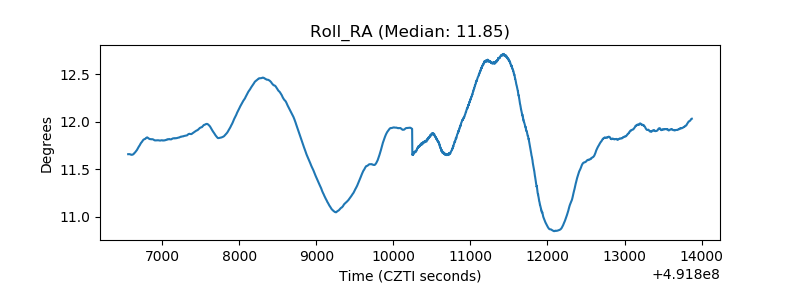 |
| Veto Counter | 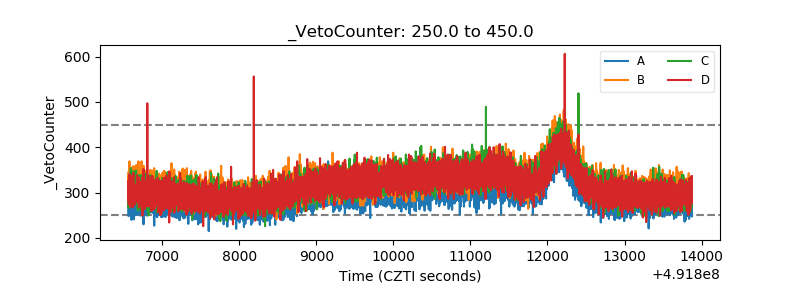 |