| Param | Original file | Final file |
|---|---|---|
| Filename | modeM0/AS1C09_011T08_9000006492_53258cztM0_level2.fits | modeM0/AS1C09_011T08_9000006492_53258cztM0_level2_quad_clean.evt |
| Size (bytes) | 641,960,640 | 101,125,440 |
| Size | 612.2 MB | 96.4 MB |
| Events in quadrant A | 4,405,001 | 676,856 |
| Events in quadrant B | 4,538,755 | 730,133 |
| Events in quadrant C | 9,667,405 | 526,575 |
| Events in quadrant D | 4,577,592 | 612,073 |
| Mode M0 | |||
|---|---|---|---|
| Quadrant | BADHDUFLAG | Total packets | Discarded packets |
| A | 0 | 18375 | 0 |
| B | 0 | 18741 | 0 |
| C | 0 | 33886 | 0 |
| D | 0 | 18948 | 1 |
| Mode SS | |||
|---|---|---|---|
| Quadrant | BADHDUFLAG | Total packets | Discarded packets |
| A | 0 | 148 | 0 |
| B | 0 | 148 | 0 |
| C | 0 | 148 | 0 |
| D | 0 | 148 | 0 |
| Quadrant | Total seconds | Saturated seconds | Saturation percentage |
|---|---|---|---|
| A | 7414 | 153 | 2.063663% |
| B | 7414 | 183 | 2.468303% |
| C | 7415 | 1817 | 24.504383% |
| D | 7414 | 183 | 2.468303% |
Noise dominated data is calculated using 1-second bins in cleaned event files. If a bin has >2000 counts, and if more than 50% of those come from <1% of pixels, then it is considered to be noise-dominated and hence unusable.
| Quadrant | # 1 sec bins | Bins with >0 counts | Bins with >2000 counts | High rate bins dominated by noise | Noise dominated (total time) | Noise dominated (detector-on time) | Marked lightcurve |
|---|---|---|---|---|---|---|---|
| A | 7414 | 7414 | 133 | 133 | 1.79% | 1.79% | 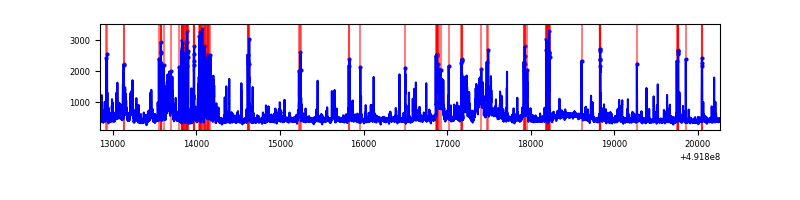 |
| B | 7414 | 7414 | 97 | 97 | 1.31% | 1.31% | 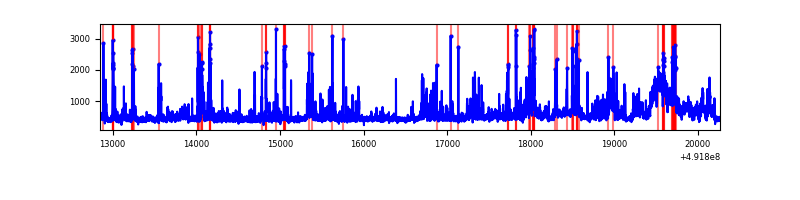 |
| C | 7415 | 7415 | 1656 | 1656 | 22.33% | 22.33% | 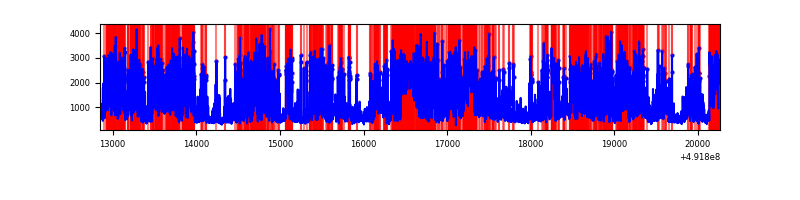 |
| D | 7414 | 7414 | 167 | 167 | 2.25% | 2.25% | 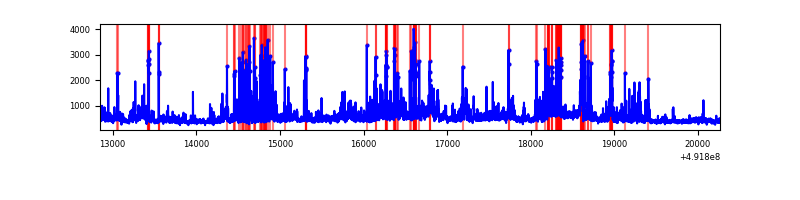 |
Top three noisy pixels from each quadrant. If the there are fewer than three noisy pixels in the level2.evt file, extra rows are filled as -1
| Pixel properties | Quadrant properties | ||||||
|---|---|---|---|---|---|---|---|
| Quadrant | DetID | PixID | Counts | Sigma | Mean | Median | Sigma |
| A | 7 | 206 | 706173 | 3753.38 | 756 | 737 | 187.9 |
| A | 0 | 8 | 196876 | 1043.59 | 756 | 737 | 187.9 |
| A | 4 | 249 | 179309 | 950.12 | 756 | 737 | 187.9 |
| B | 10 | 254 | 514816 | 3175.58 | 752 | 724 | 161.9 |
| B | 2 | 249 | 339019 | 2089.67 | 752 | 724 | 161.9 |
| B | 4 | 81 | 233677 | 1438.96 | 752 | 724 | 161.9 |
| C | 15 | 224 | 4518248 | 24737.83 | 664 | 659 | 182.6 |
| C | 10 | 22 | 807558 | 4418.49 | 664 | 659 | 182.6 |
| C | 15 | 147 | 417950 | 2285.04 | 664 | 659 | 182.6 |
| D | 6 | 42 | 455669 | 2215.27 | 727 | 696 | 205.4 |
| D | 12 | 1 | 317521 | 1542.62 | 727 | 696 | 205.4 |
| D | 1 | 0 | 198872 | 964.92 | 727 | 696 | 205.4 |
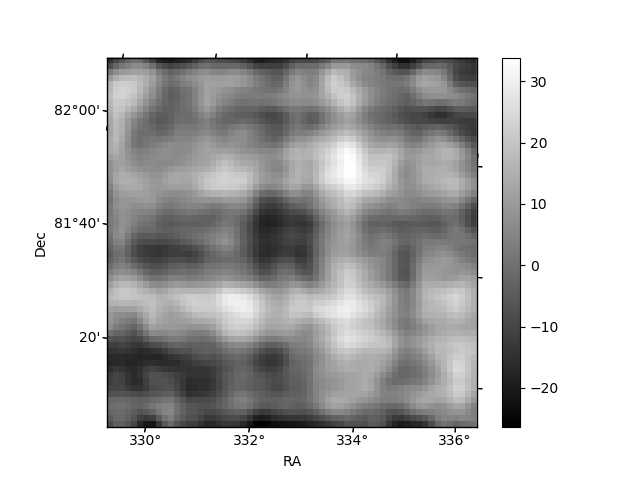
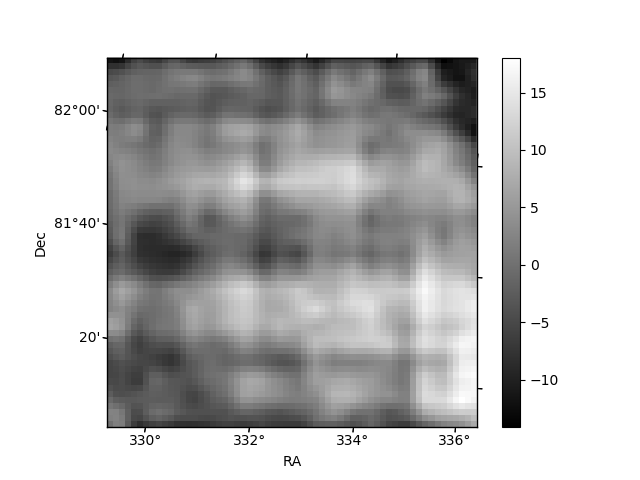
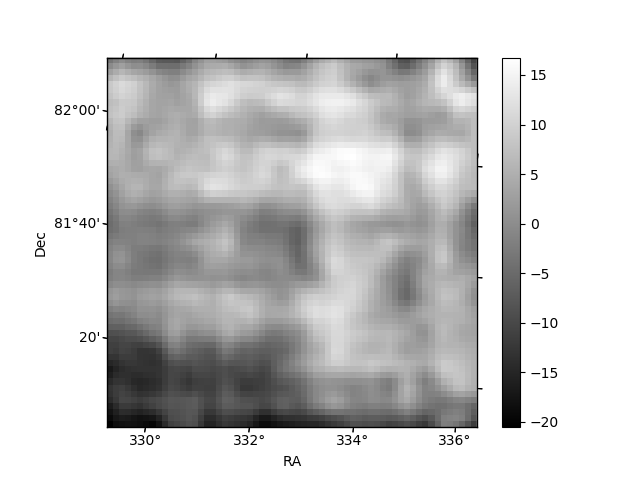
Histogram calculated using DETX and DETY for each event in the final _common_clean file
| Quadrant A | 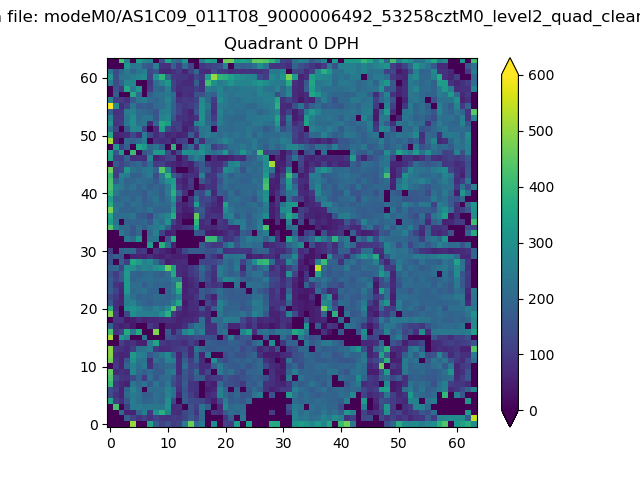 |
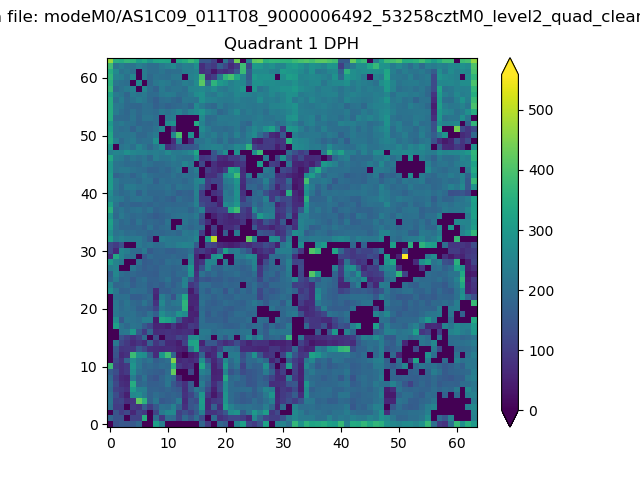 |
Quadrant B |
|---|---|---|---|
| Quadrant D | 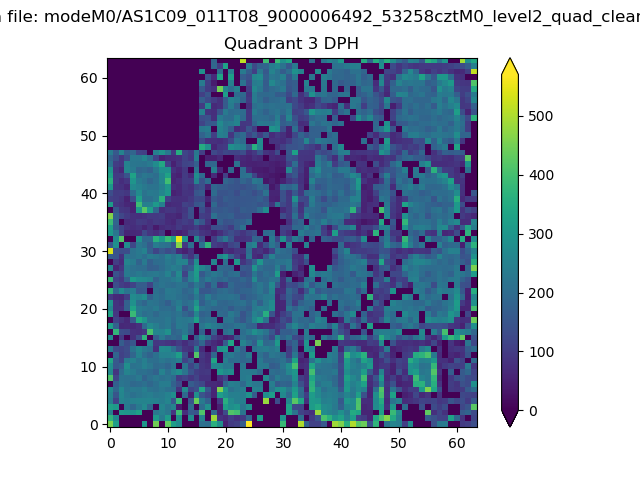 |
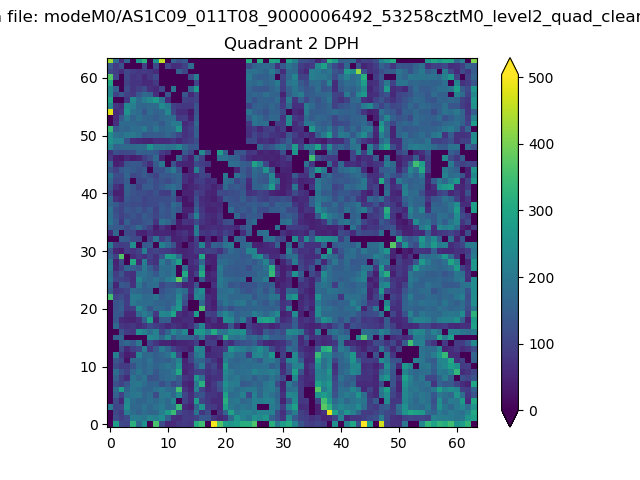 |
Quadrant C |
| Plot type | Count rate plots | Images |
|---|---|---|
| Comparison with Poisson distribution Blue bars denote a histogram of data divided into 1 sec bins. Red curve is a Poisson curve with rate = median count rate of data. |
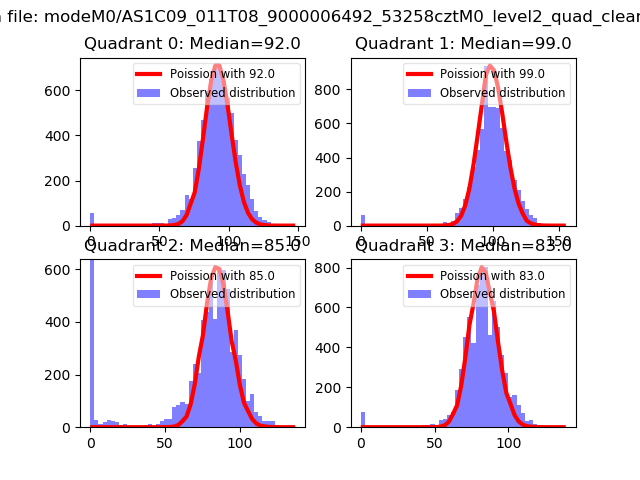 |
 |
| Quadrant-wise count rates Data is divided into 100 sec bins |
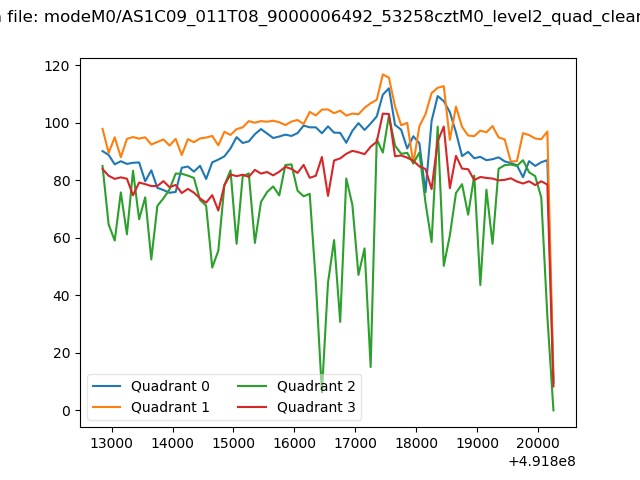 |
|
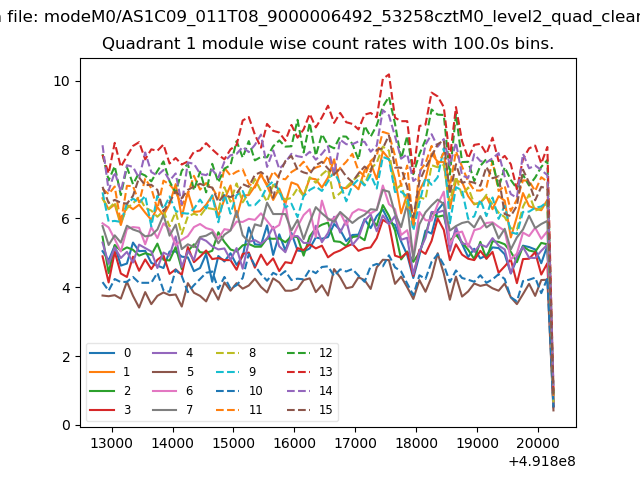
| Module-wise count rates for Quadrant A Data is divided into 100 sec bins |
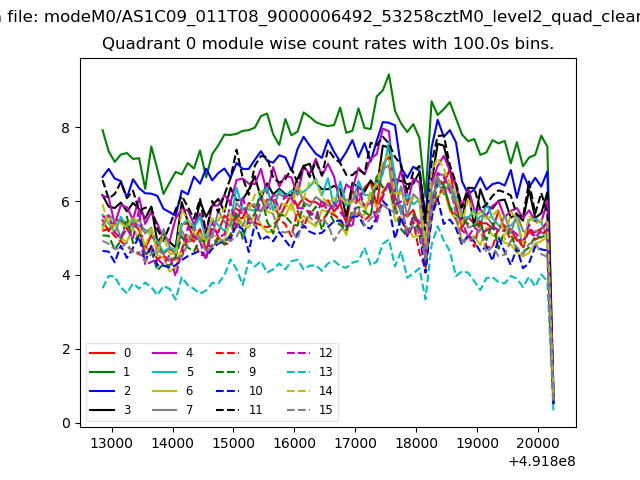 |
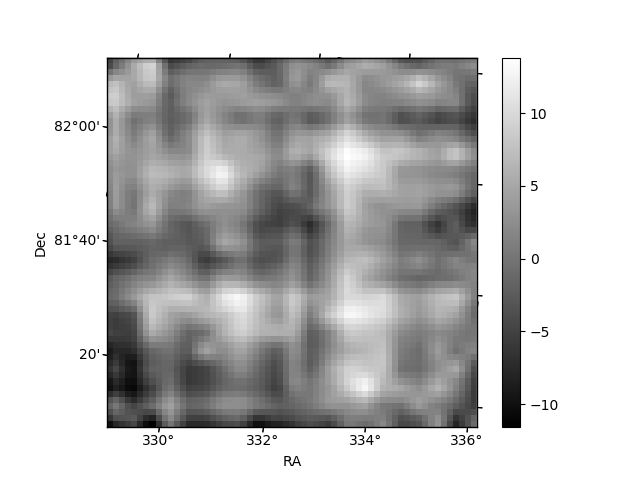 |
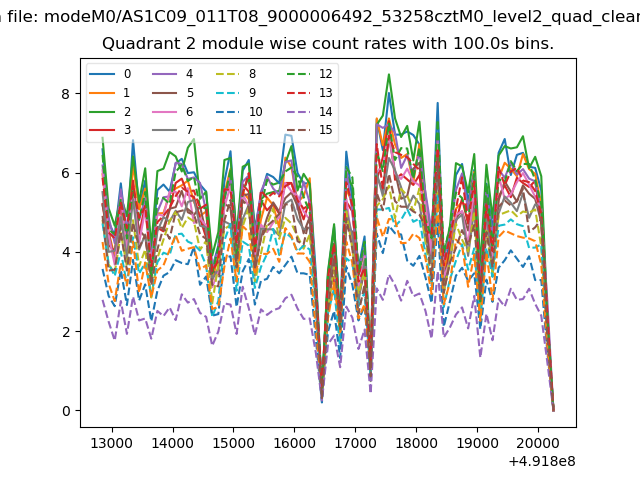
| Module-wise count rates for Quadrant B Data is divided into 100 sec bins |
 |
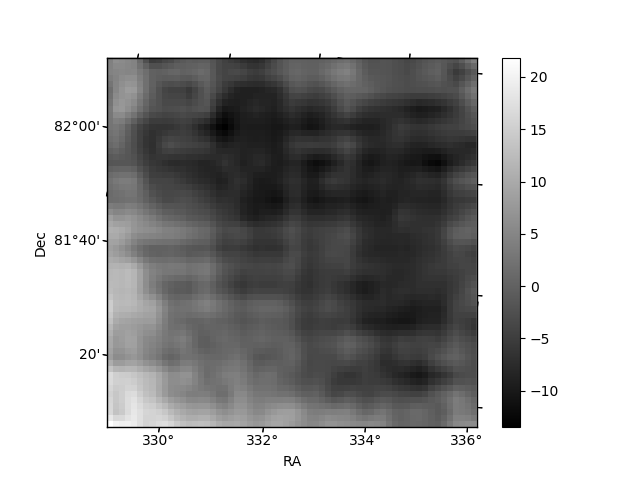 |
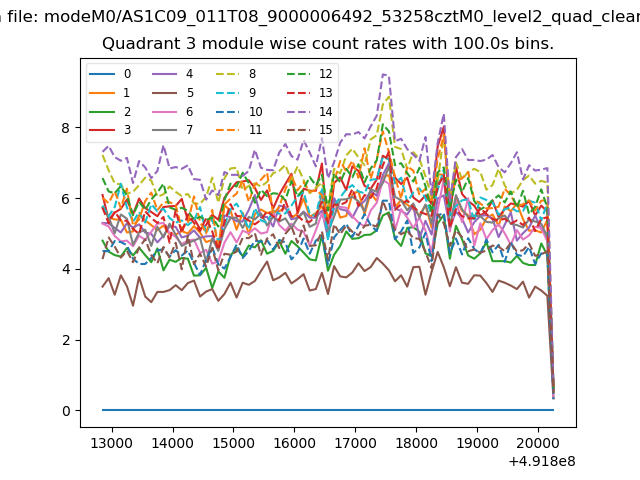
| Module-wise count rates for Quadrant C Data is divided into 100 sec bins |
 |
 |
| Module-wise count rates for Quadrant D Data is divided into 100 sec bins |
 |
 |
| Parameter | Plot |
|---|---|
| CZT HV Monitor | 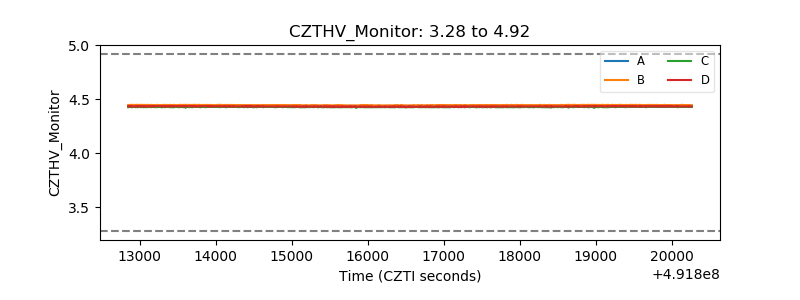 |
| D_VDD | 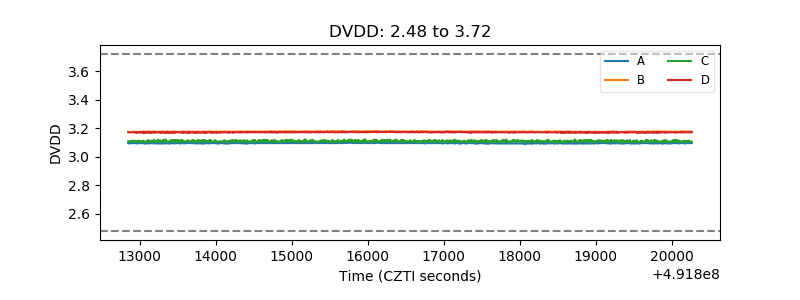 |
| Temperature 1 | 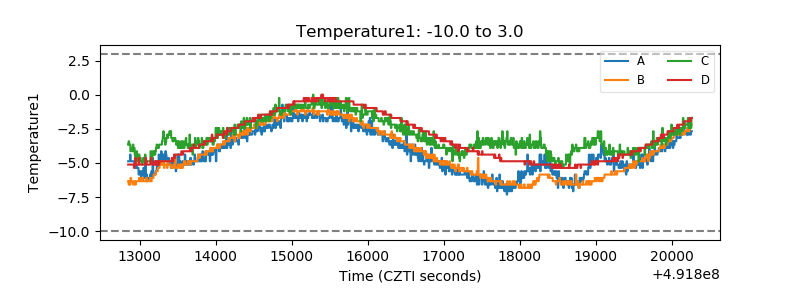 |
| Veto HV Monitor | 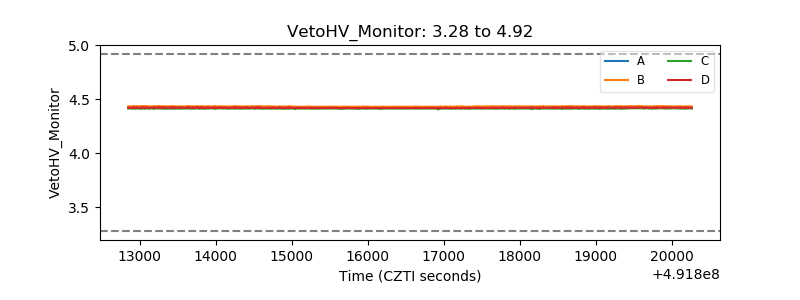 |
| Veto LLD | 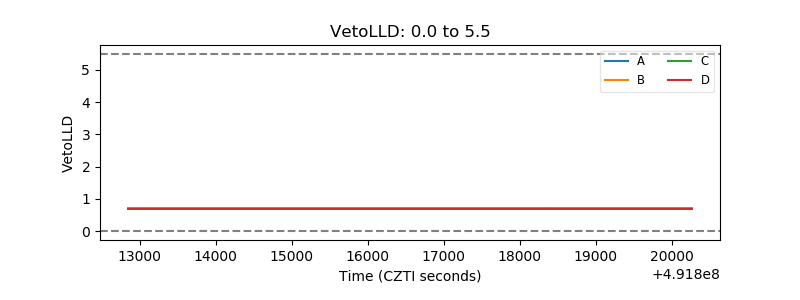 |
| Alpha Counter | 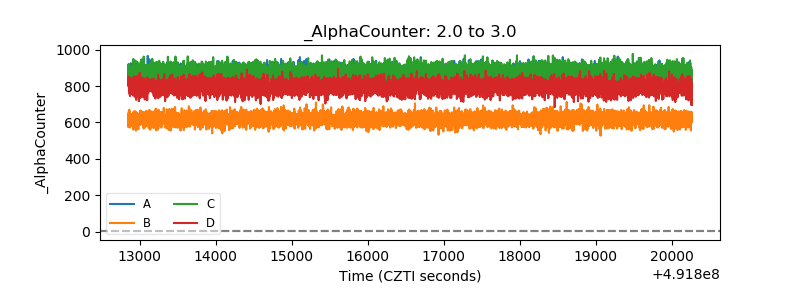 |
| _CPM_Rate | 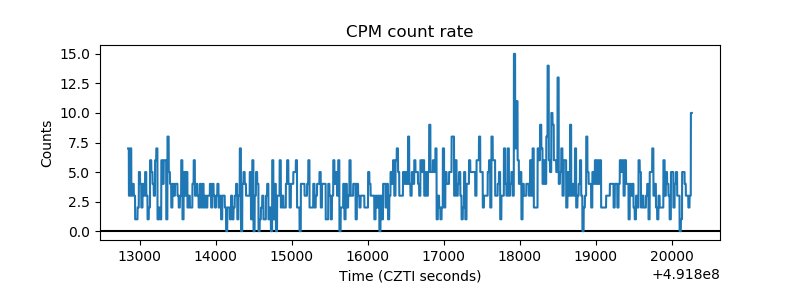 |
| CZT Counter | 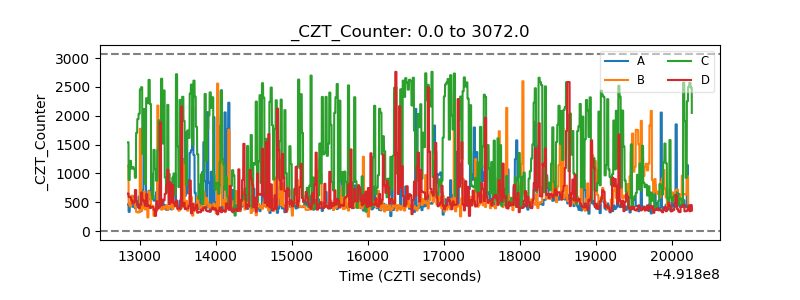 |
| +2.5 Volts monitor | 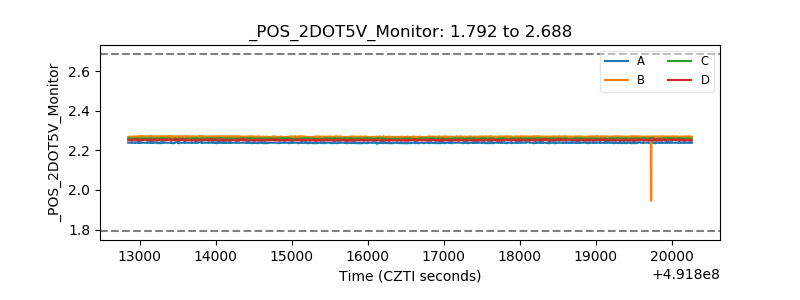 |
| +5 Volts monitor | 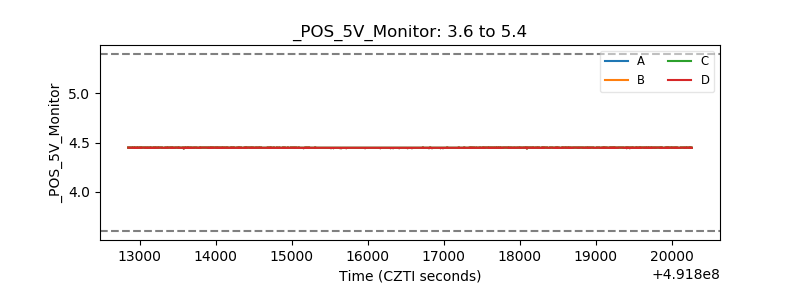 |
| _ROLL_ROT | 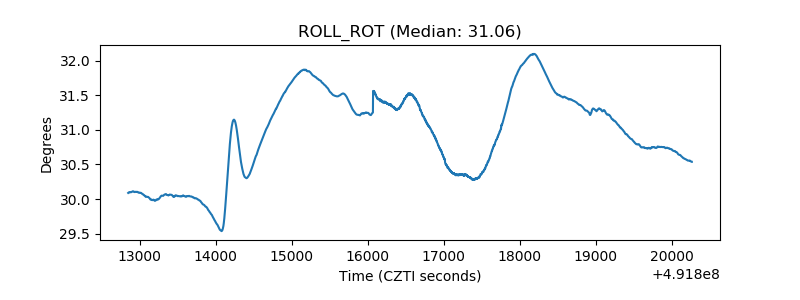 |
| _Roll_DEC | 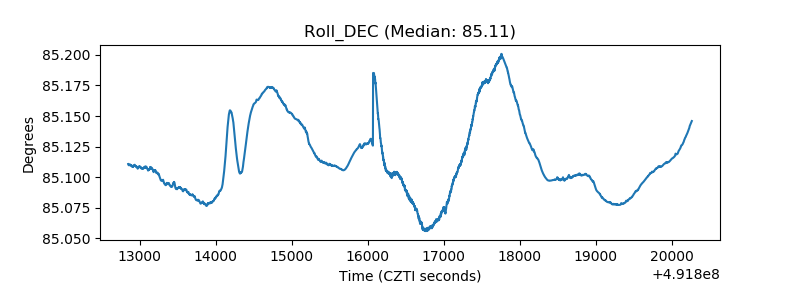 |
| _Roll_RA | 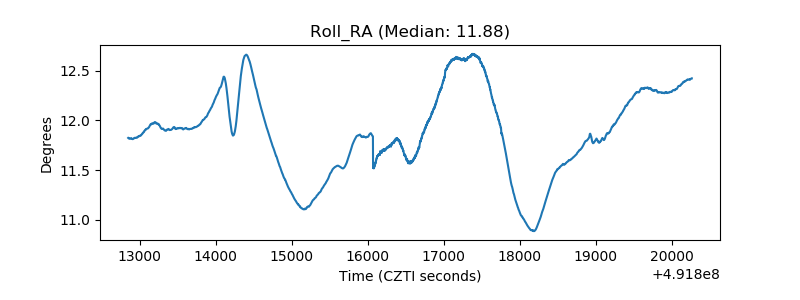 |
| Veto Counter | 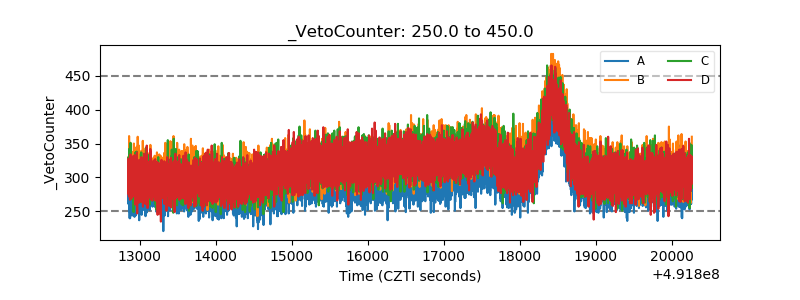 |