| Param | Original file | Final file |
|---|---|---|
| Filename | modeM0/AS1C09_011T08_9000006492_53261cztM0_level2.fits | modeM0/AS1C09_011T08_9000006492_53261cztM0_level2_quad_clean.evt |
| Size (bytes) | 1,658,600,640 | 245,620,800 |
| Size | 1.5 GB | 234.2 MB |
| Events in quadrant A | 12,633,902 | 1,646,489 |
| Events in quadrant B | 11,357,863 | 1,792,952 |
| Events in quadrant C | 23,196,420 | 1,216,532 |
| Events in quadrant D | 12,757,053 | 1,485,970 |
| Mode M0 | |||
|---|---|---|---|
| Quadrant | BADHDUFLAG | Total packets | Discarded packets |
| A | 0 | 50682 | 3 |
| B | 0 | 47091 | 3 |
| C | 0 | 81837 | 3 |
| D | 0 | 51229 | 3 |
| Mode M9 | |||
|---|---|---|---|
| Quadrant | BADHDUFLAG | Total packets | Discarded packets |
| A | 0 | 11 | 0 |
| B | 0 | 11 | 0 |
| C | 0 | 11 | 0 |
| D | 0 | 11 | 0 |
| Mode SS | |||
|---|---|---|---|
| Quadrant | BADHDUFLAG | Total packets | Discarded packets |
| A | 0 | 380 | 0 |
| B | 0 | 380 | 0 |
| C | 0 | 380 | 0 |
| D | 0 | 380 | 0 |
| Quadrant | Total seconds | Saturated seconds | Saturation percentage |
|---|---|---|---|
| A | 18779 | 1134 | 6.038660% |
| B | 18780 | 923 | 4.914803% |
| C | 18780 | 4593 | 24.456869% |
| D | 18780 | 1091 | 5.809372% |
Noise dominated data is calculated using 1-second bins in cleaned event files. If a bin has >2000 counts, and if more than 50% of those come from <1% of pixels, then it is considered to be noise-dominated and hence unusable.
| Quadrant | # 1 sec bins | Bins with >0 counts | Bins with >2000 counts | High rate bins dominated by noise | Noise dominated (total time) | Noise dominated (detector-on time) | Marked lightcurve |
|---|---|---|---|---|---|---|---|
| A | 19869 | 18781 | 771 | 771 | 3.88% | 4.11% | 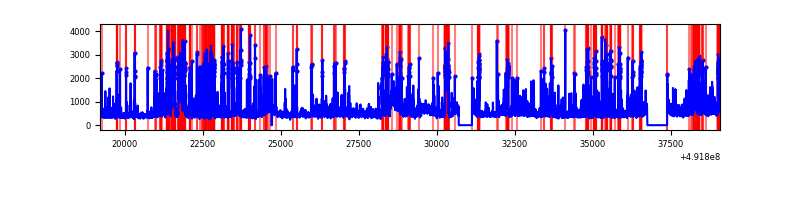 |
| B | 19870 | 18783 | 444 | 444 | 2.23% | 2.36% | 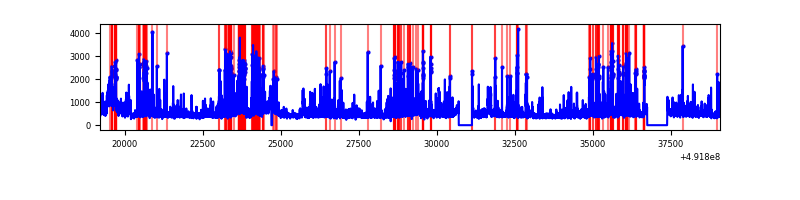 |
| C | 19870 | 18781 | 4258 | 4258 | 21.43% | 22.67% | 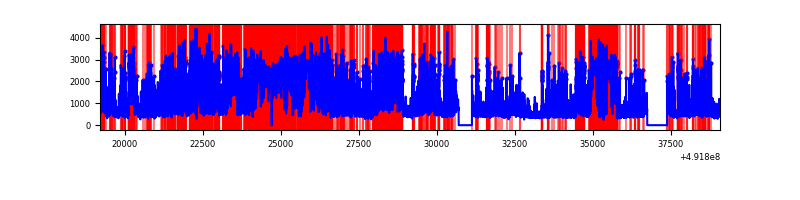 |
| D | 19870 | 18782 | 878 | 878 | 4.42% | 4.67% | 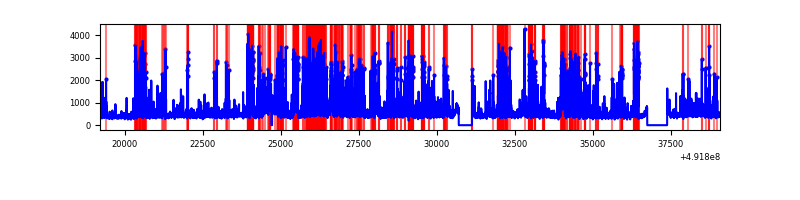 |
Top three noisy pixels from each quadrant. If the there are fewer than three noisy pixels in the level2.evt file, extra rows are filled as -1
| Pixel properties | Quadrant properties | ||||||
|---|---|---|---|---|---|---|---|
| Quadrant | DetID | PixID | Counts | Sigma | Mean | Median | Sigma |
| A | 3 | 62 | 1331542 | 2779.64 | 1949 | 1904 | 478.3 |
| A | 0 | 8 | 956094 | 1994.76 | 1949 | 1904 | 478.3 |
| A | 7 | 206 | 755950 | 1576.35 | 1949 | 1904 | 478.3 |
| B | 2 | 249 | 1138787 | 2783.05 | 1934 | 1867 | 408.5 |
| B | 4 | 81 | 630830 | 1539.63 | 1934 | 1867 | 408.5 |
| B | 10 | 254 | 516295 | 1259.26 | 1934 | 1867 | 408.5 |
| C | 15 | 224 | 5113076 | 10854.24 | 1700 | 1678 | 470.9 |
| C | 1 | 241 | 3969940 | 8426.75 | 1700 | 1678 | 470.9 |
| C | 10 | 22 | 2150046 | 4562.14 | 1700 | 1678 | 470.9 |
| D | 12 | 3 | 1734703 | 3223.85 | 1891 | 1807 | 537.5 |
| D | 12 | 1 | 885561 | 1644.12 | 1891 | 1807 | 537.5 |
| D | 1 | 0 | 689448 | 1279.28 | 1891 | 1807 | 537.5 |
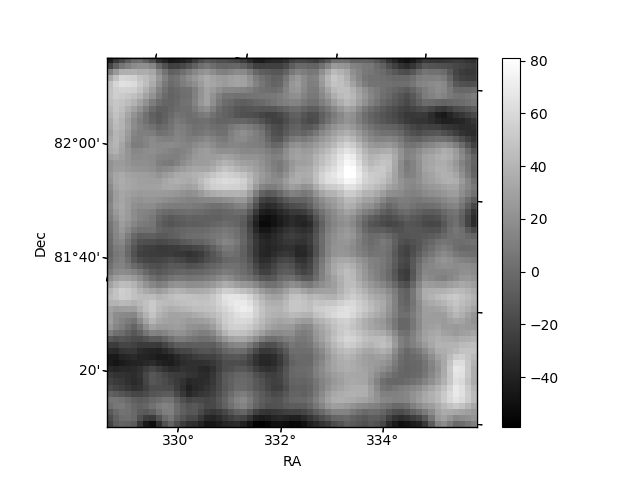
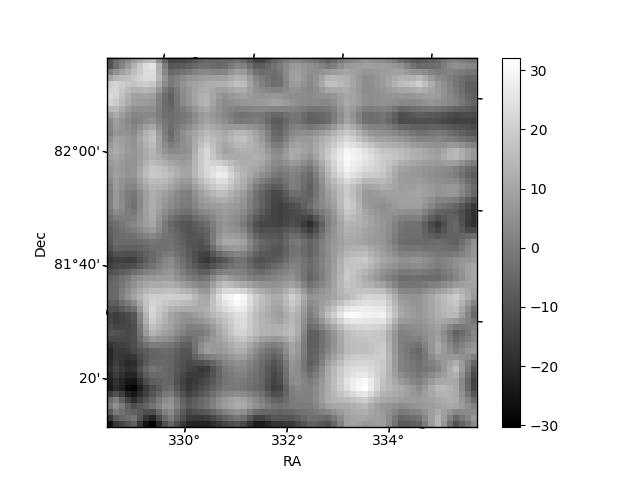
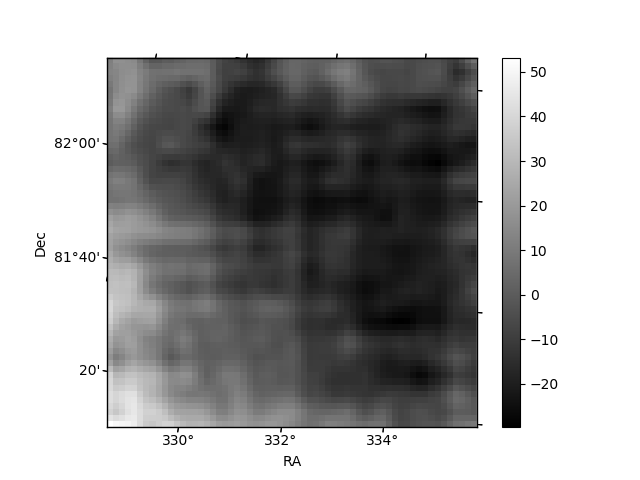
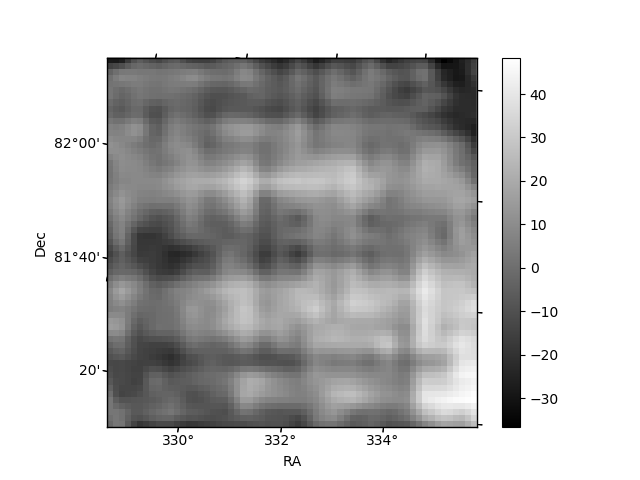
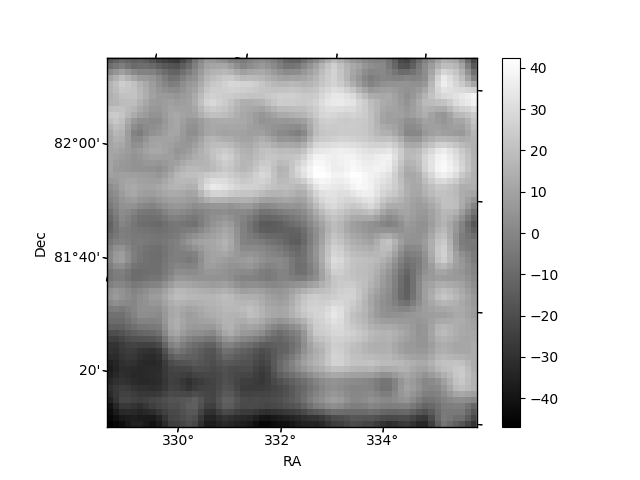
Histogram calculated using DETX and DETY for each event in the final _common_clean file
| Quadrant A | 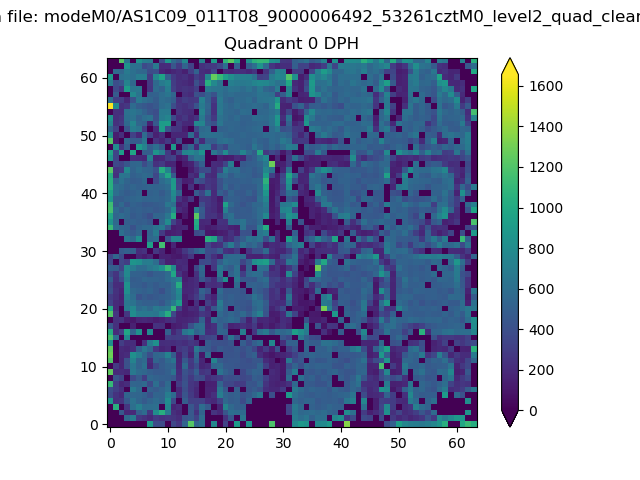 |
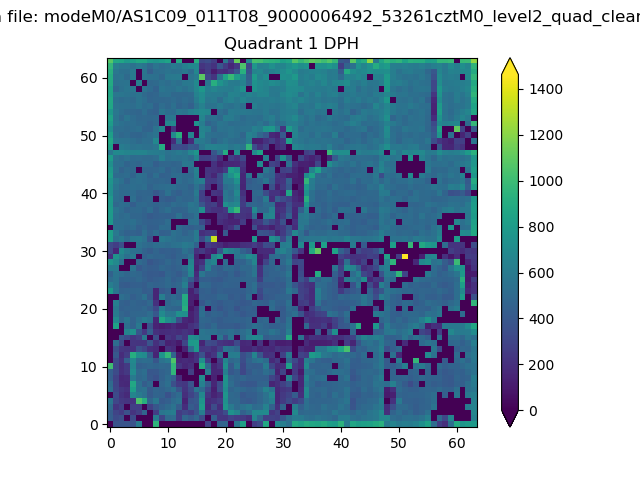 |
Quadrant B |
|---|---|---|---|
| Quadrant D |  |
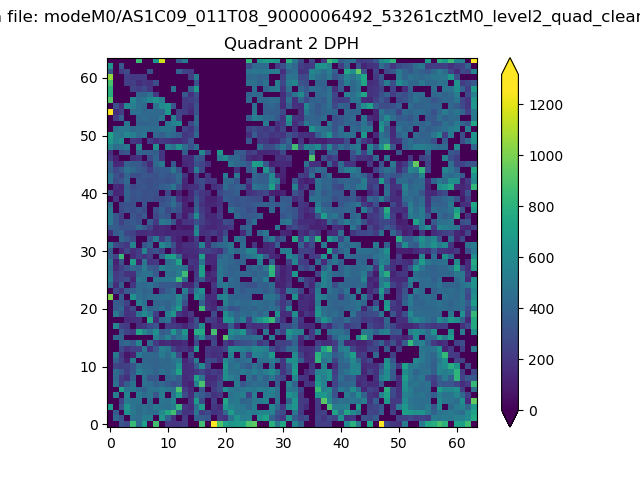 |
Quadrant C |
| Plot type | Count rate plots | Images |
|---|---|---|
| Comparison with Poisson distribution Blue bars denote a histogram of data divided into 1 sec bins. Red curve is a Poisson curve with rate = median count rate of data. |
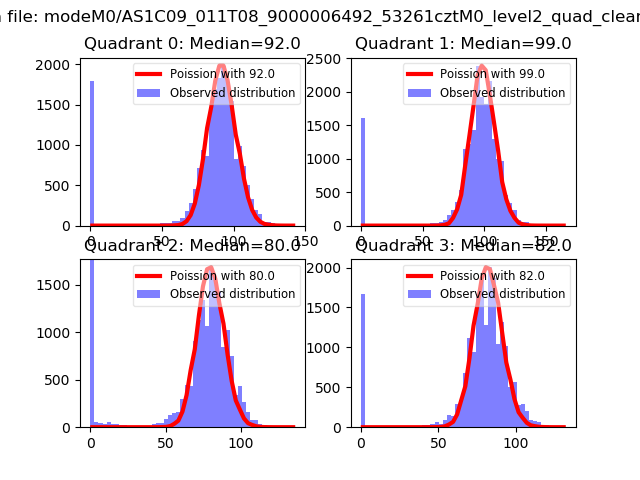 |
 |
| Quadrant-wise count rates Data is divided into 100 sec bins |
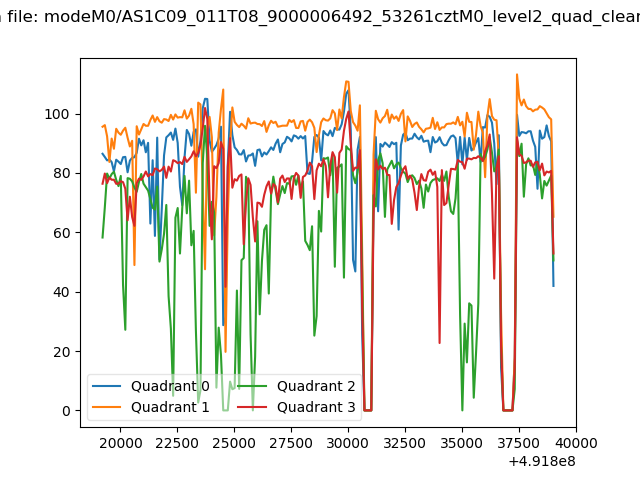 |
|
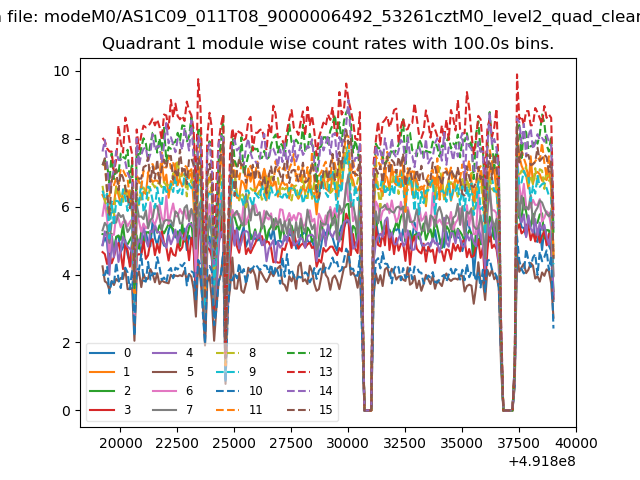
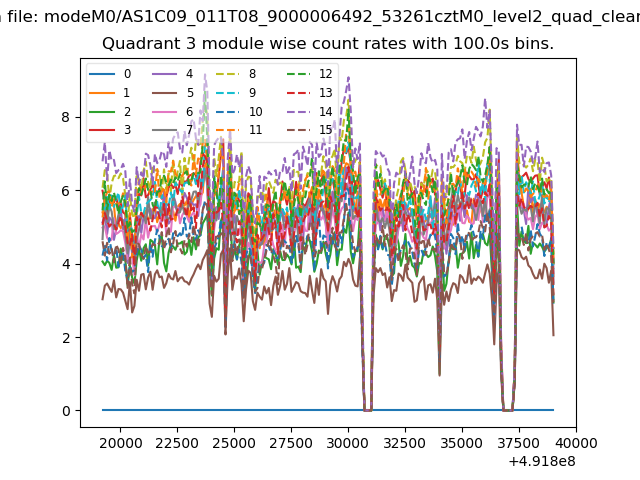
| Module-wise count rates for Quadrant A Data is divided into 100 sec bins |
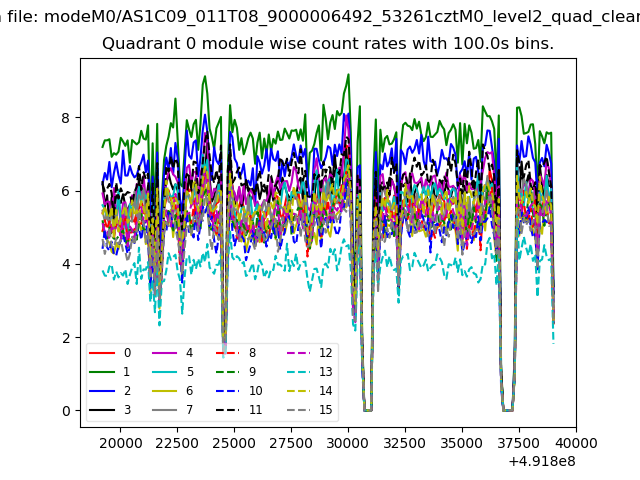 |
 |
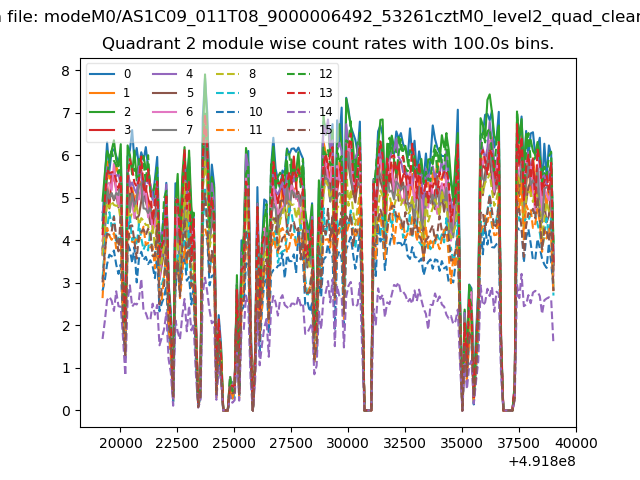
| Module-wise count rates for Quadrant B Data is divided into 100 sec bins |
 |
 |
| Module-wise count rates for Quadrant C Data is divided into 100 sec bins |
 |
 |
| Module-wise count rates for Quadrant D Data is divided into 100 sec bins |
 |
 |
| Parameter | Plot |
|---|---|
| CZT HV Monitor | 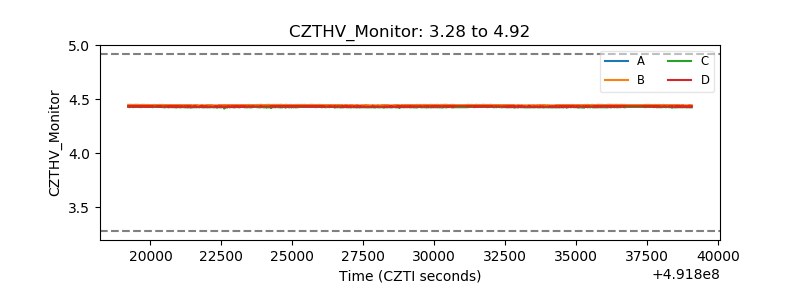 |
| D_VDD | 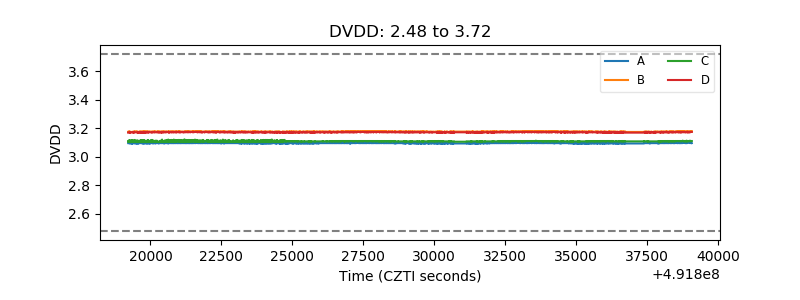 |
| Temperature 1 | 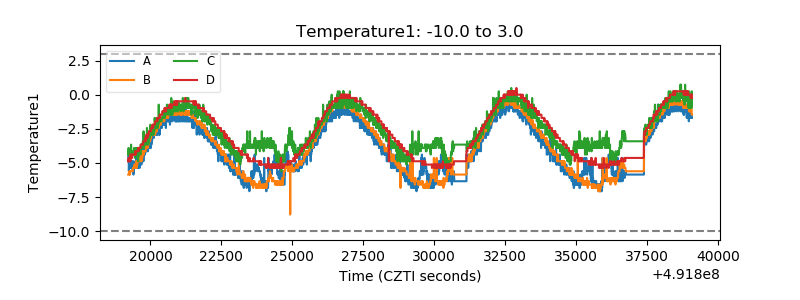 |
| Veto HV Monitor | 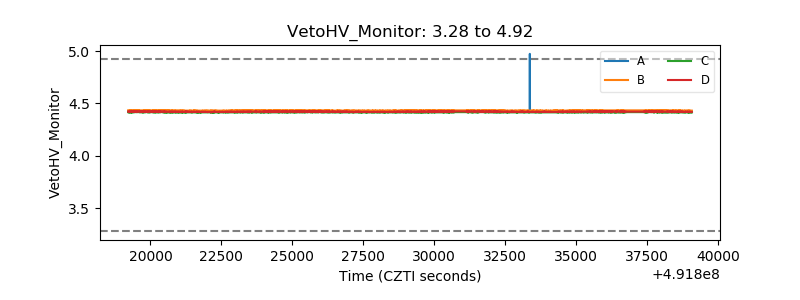 |
| Veto LLD | 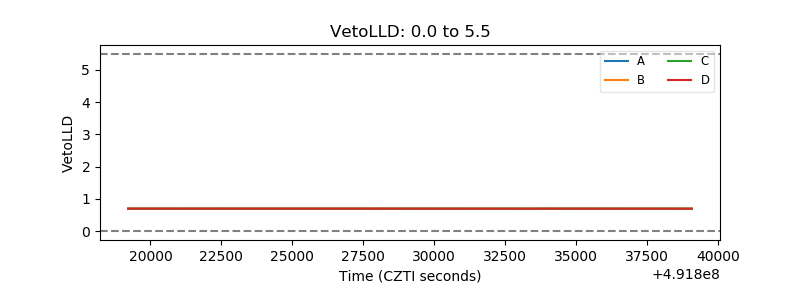 |
| Alpha Counter | 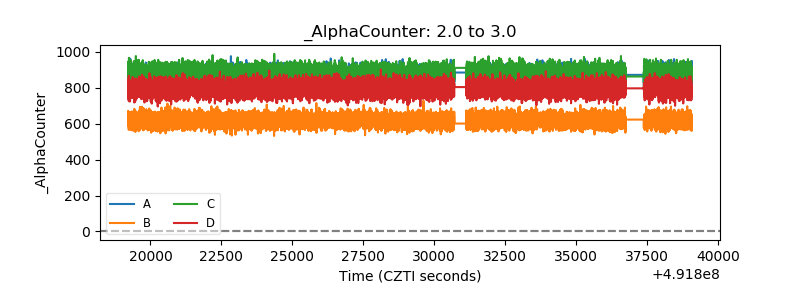 |
| _CPM_Rate | 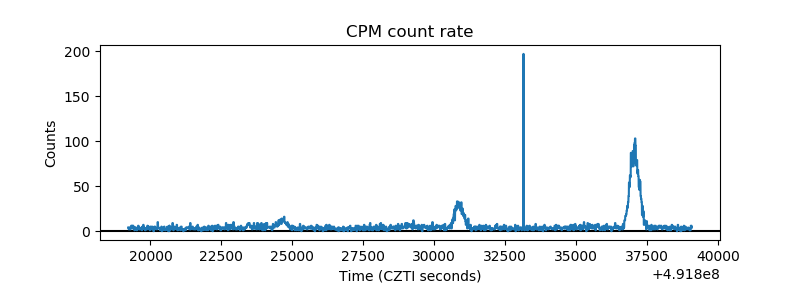 |
| CZT Counter | 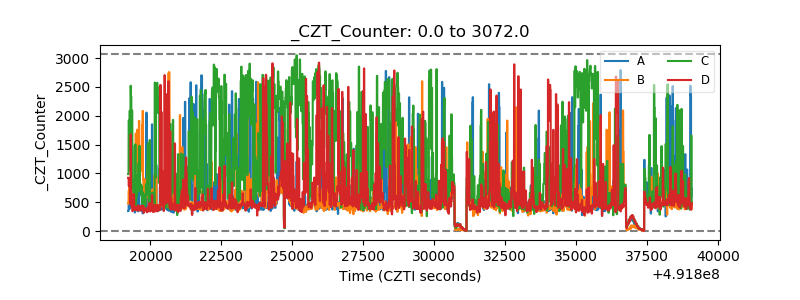 |
| +2.5 Volts monitor |  |
| +5 Volts monitor |  |
| _ROLL_ROT | 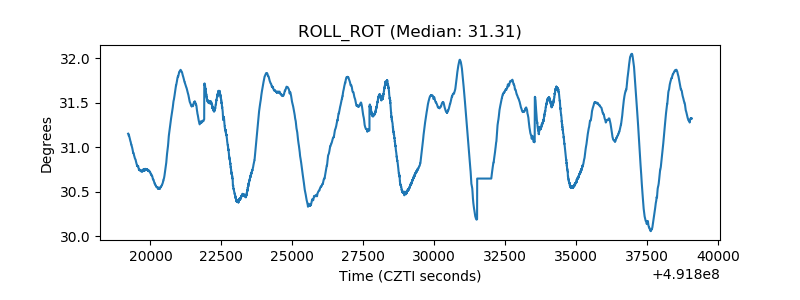 |
| _Roll_DEC | 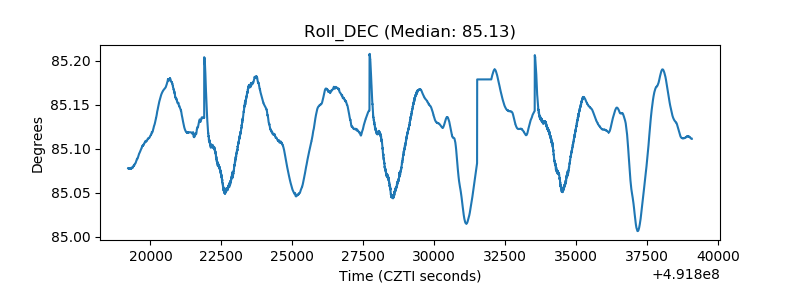 |
| _Roll_RA | 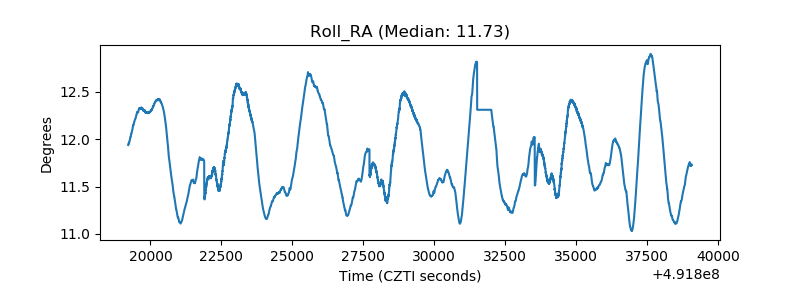 |
| Veto Counter | 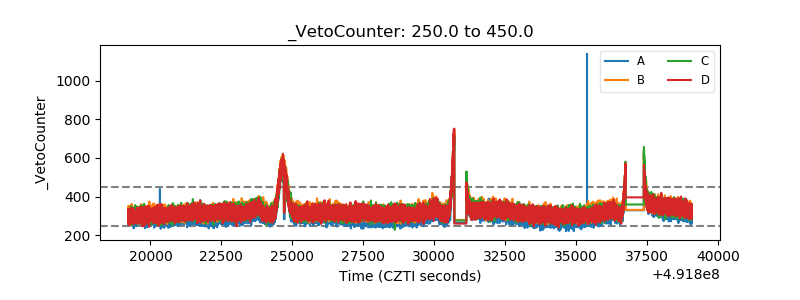 |