| Param | Original file | Final file |
|---|---|---|
| Filename | modeM0/AS1C09_011T08_9000006492_53262cztM0_level2.fits | modeM0/AS1C09_011T08_9000006492_53262cztM0_level2_quad_clean.evt |
| Size (bytes) | 562,852,800 | 90,800,640 |
| Size | 536.8 MB | 86.6 MB |
| Events in quadrant A | 6,107,183 | 582,090 |
| Events in quadrant B | 3,899,710 | 645,498 |
| Events in quadrant C | 6,612,446 | 512,287 |
| Events in quadrant D | 3,708,164 | 553,168 |
| Mode M0 | |||
|---|---|---|---|
| Quadrant | BADHDUFLAG | Total packets | Discarded packets |
| A | 0 | 22726 | 2 |
| B | 0 | 16198 | 1 |
| C | 0 | 24205 | 1 |
| D | 0 | 15630 | 1 |
| Mode M9 | |||
|---|---|---|---|
| Quadrant | BADHDUFLAG | Total packets | Discarded packets |
| A | 0 | 8 | 0 |
| B | 0 | 8 | 0 |
| C | 0 | 8 | 0 |
| D | 0 | 8 | 0 |
| Mode SS | |||
|---|---|---|---|
| Quadrant | BADHDUFLAG | Total packets | Discarded packets |
| A | 0 | 132 | 0 |
| B | 0 | 132 | 0 |
| C | 0 | 132 | 0 |
| D | 0 | 132 | 0 |
| Quadrant | Total seconds | Saturated seconds | Saturation percentage |
|---|---|---|---|
| A | 6540 | 605 | 9.250765% |
| B | 6540 | 300 | 4.587156% |
| C | 6541 | 1030 | 15.746828% |
| D | 6541 | 151 | 2.308516% |
Noise dominated data is calculated using 1-second bins in cleaned event files. If a bin has >2000 counts, and if more than 50% of those come from <1% of pixels, then it is considered to be noise-dominated and hence unusable.
| Quadrant | # 1 sec bins | Bins with >0 counts | Bins with >2000 counts | High rate bins dominated by noise | Noise dominated (total time) | Noise dominated (detector-on time) | Marked lightcurve |
|---|---|---|---|---|---|---|---|
| A | 7370 | 6540 | 511 | 511 | 6.93% | 7.81% | 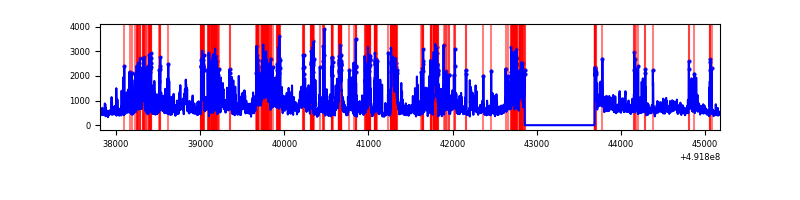 |
| B | 7370 | 6541 | 204 | 204 | 2.77% | 3.12% | 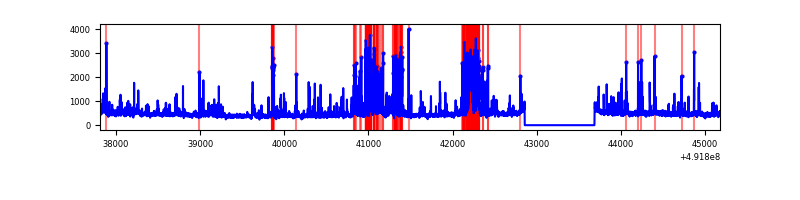 |
| C | 7371 | 6541 | 898 | 898 | 12.18% | 13.73% | 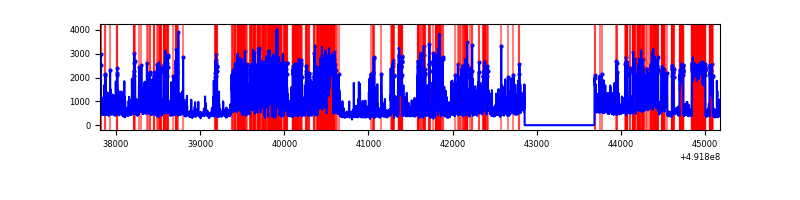 |
| D | 7371 | 6541 | 125 | 125 | 1.70% | 1.91% |  |
Top three noisy pixels from each quadrant. If the there are fewer than three noisy pixels in the level2.evt file, extra rows are filled as -1
| Pixel properties | Quadrant properties | ||||||
|---|---|---|---|---|---|---|---|
| Quadrant | DetID | PixID | Counts | Sigma | Mean | Median | Sigma |
| A | 7 | 206 | 1030039 | 6191.69 | 670 | 654 | 166.3 |
| A | 3 | 14 | 955132 | 5741.13 | 670 | 654 | 166.3 |
| A | 3 | 62 | 461321 | 2770.89 | 670 | 654 | 166.3 |
| B | 2 | 249 | 640661 | 4451.68 | 676 | 651 | 143.8 |
| B | 4 | 171 | 133339 | 922.93 | 676 | 651 | 143.8 |
| B | 4 | 81 | 114521 | 792.04 | 676 | 651 | 143.8 |
| C | 15 | 224 | 1495383 | 8739.17 | 627 | 623 | 171.0 |
| C | 15 | 198 | 1470485 | 8593.6 | 627 | 623 | 171.0 |
| C | 13 | 3 | 420734 | 2456.19 | 627 | 623 | 171.0 |
| D | 12 | 3 | 187275 | 972.72 | 672 | 645 | 191.9 |
| D | 3 | 12 | 186316 | 967.72 | 672 | 645 | 191.9 |
| D | 10 | 117 | 137612 | 713.88 | 672 | 645 | 191.9 |
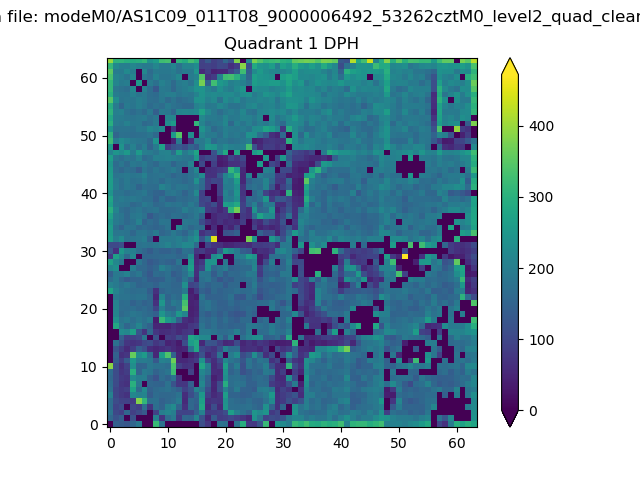
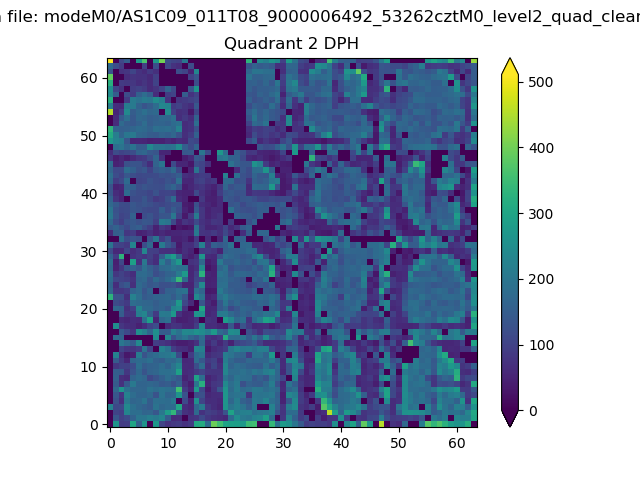
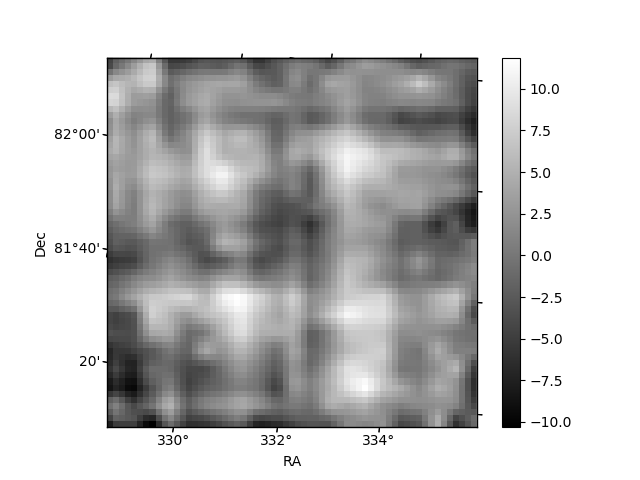
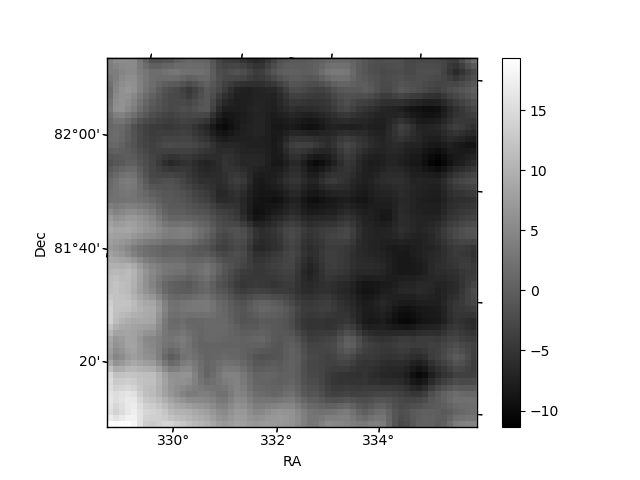
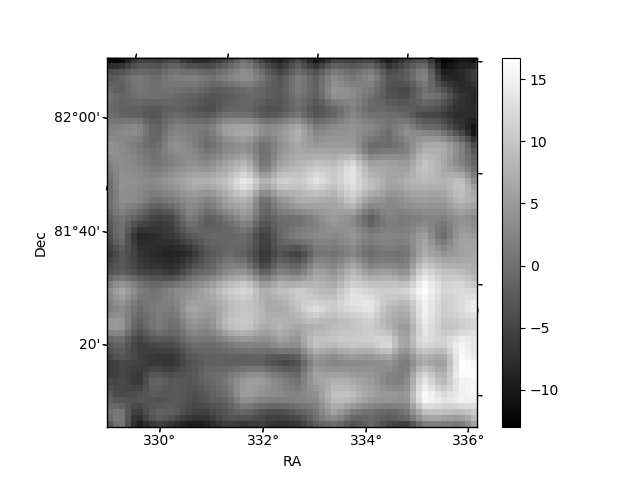
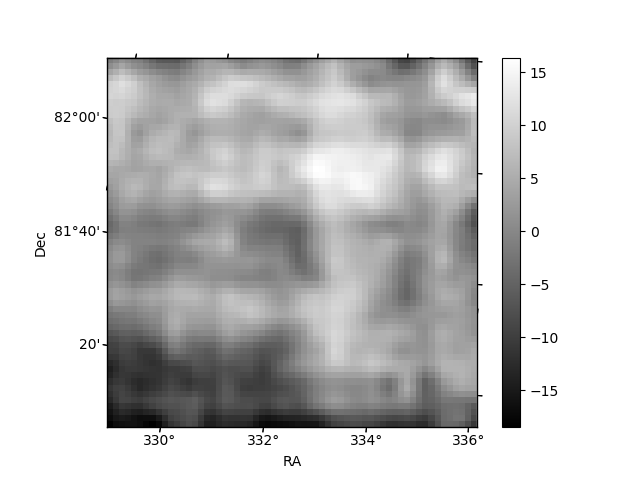
Histogram calculated using DETX and DETY for each event in the final _common_clean file
| Quadrant A | 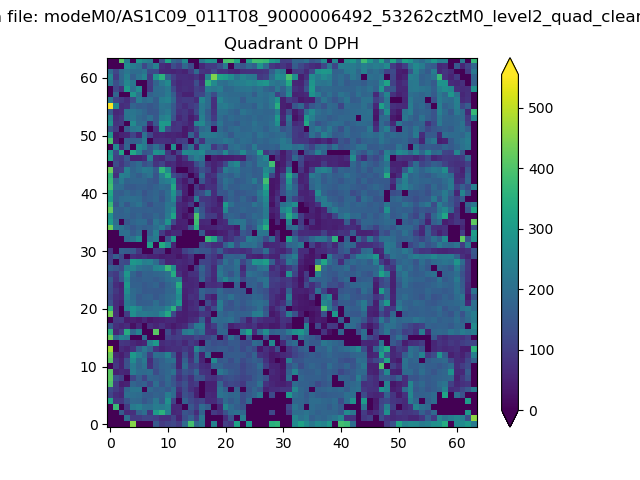 |
 |
Quadrant B |
|---|---|---|---|
| Quadrant D | 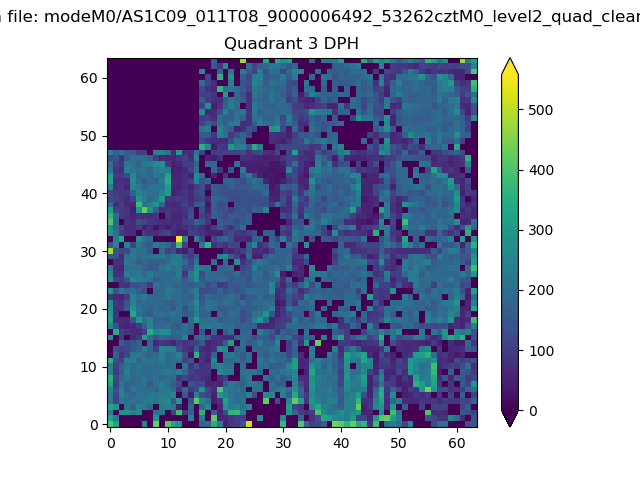 |
 |
Quadrant C |
| Plot type | Count rate plots | Images |
|---|---|---|
| Comparison with Poisson distribution Blue bars denote a histogram of data divided into 1 sec bins. Red curve is a Poisson curve with rate = median count rate of data. |
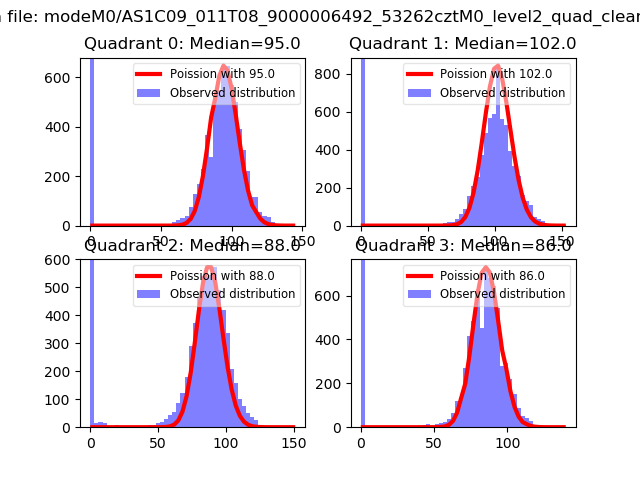 |
 |
| Quadrant-wise count rates Data is divided into 100 sec bins |
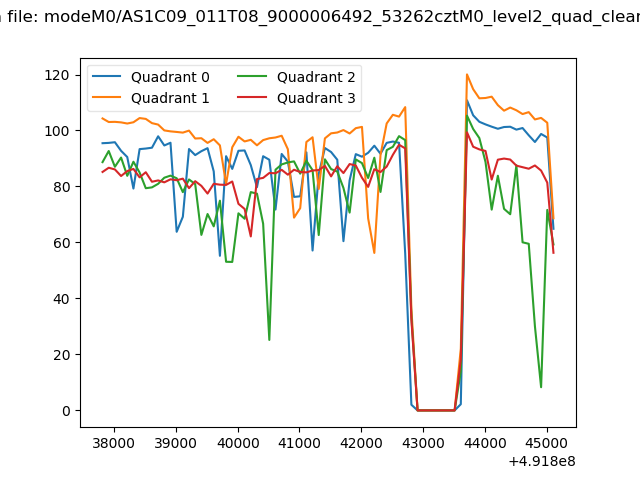 |
|
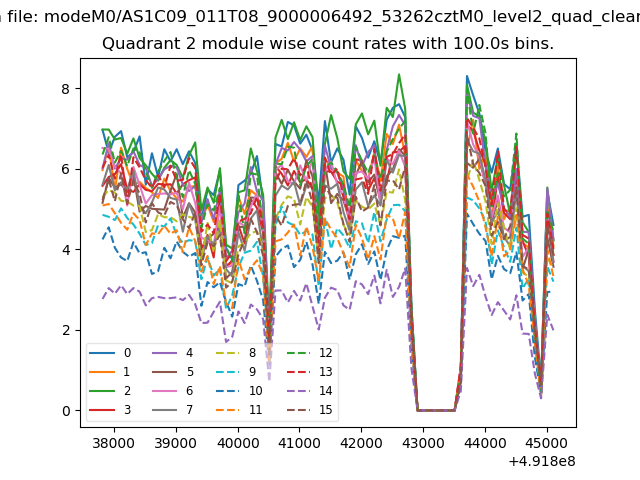
| Module-wise count rates for Quadrant A Data is divided into 100 sec bins |
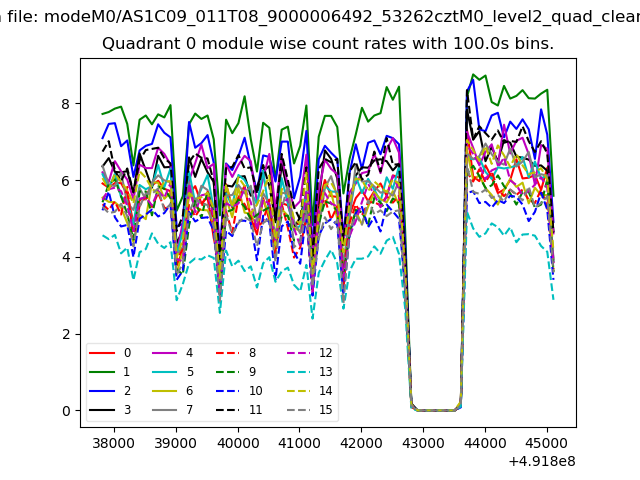 |
 |
| Module-wise count rates for Quadrant B Data is divided into 100 sec bins |
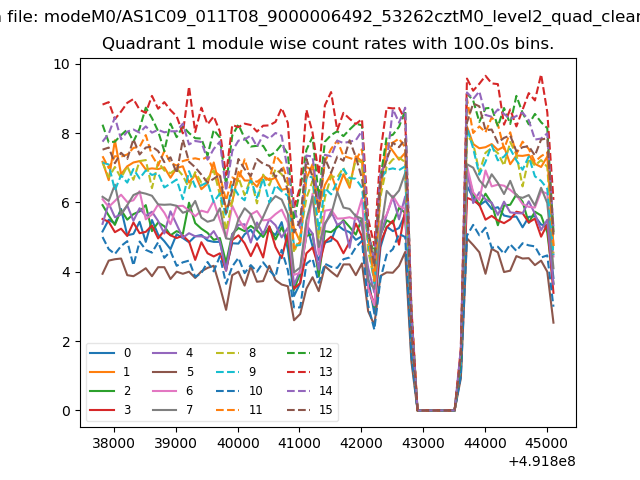 |
 |
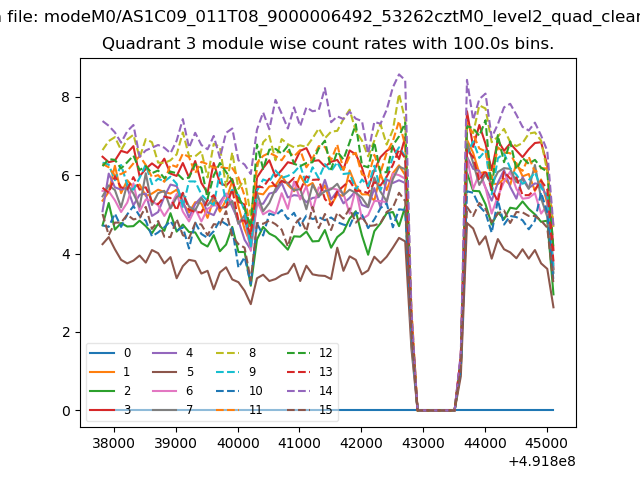
| Module-wise count rates for Quadrant C Data is divided into 100 sec bins |
 |
 |
| Module-wise count rates for Quadrant D Data is divided into 100 sec bins |
 |
 |
| Parameter | Plot |
|---|---|
| CZT HV Monitor |  |
| D_VDD | 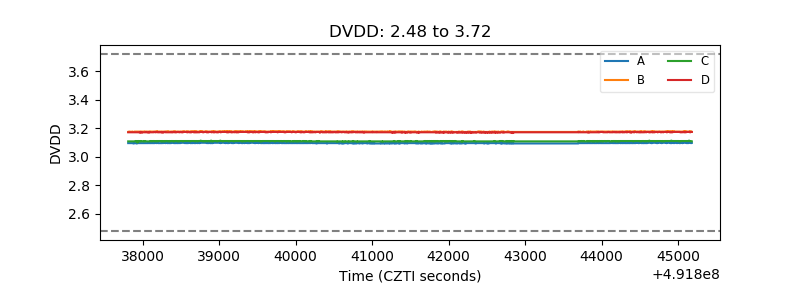 |
| Temperature 1 | 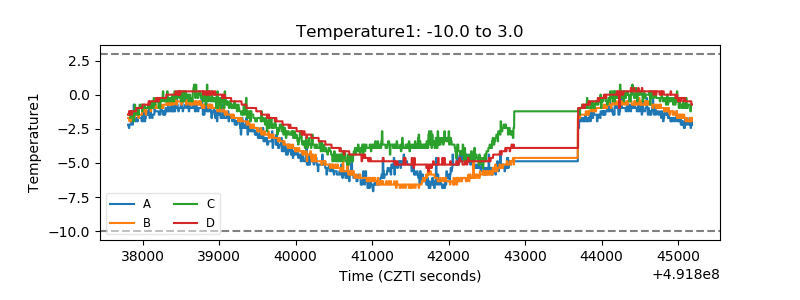 |
| Veto HV Monitor | 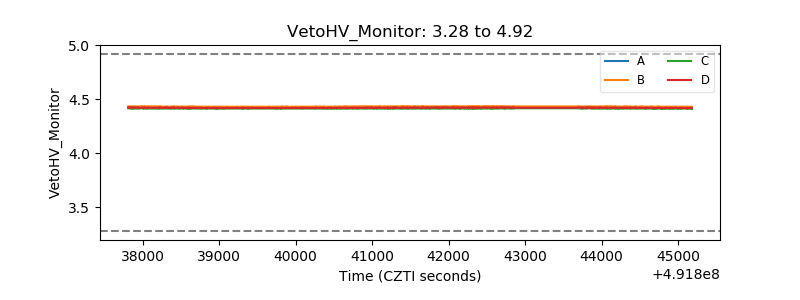 |
| Veto LLD | 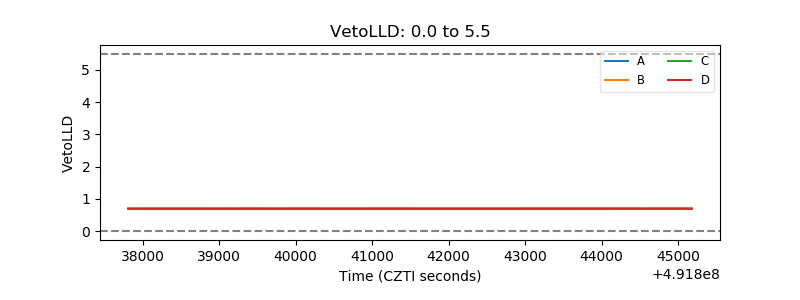 |
| Alpha Counter |  |
| _CPM_Rate | 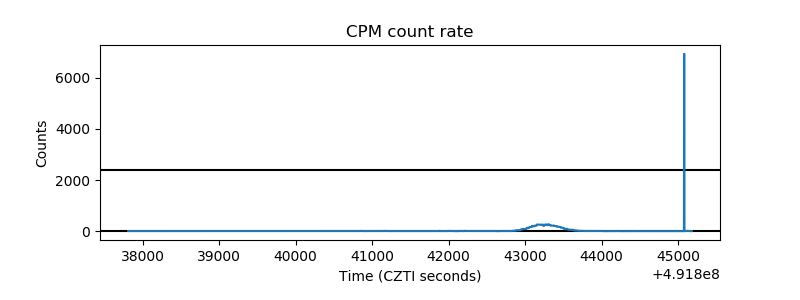 |
| CZT Counter | 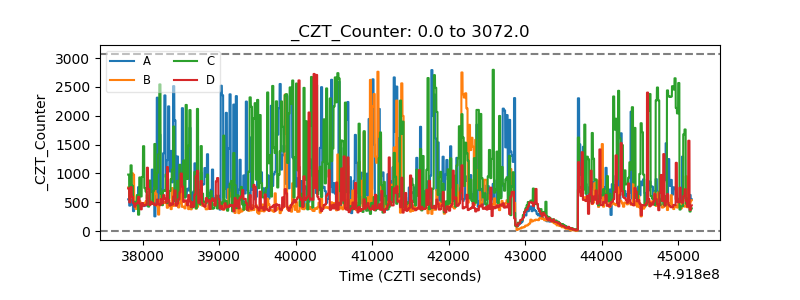 |
| +2.5 Volts monitor | 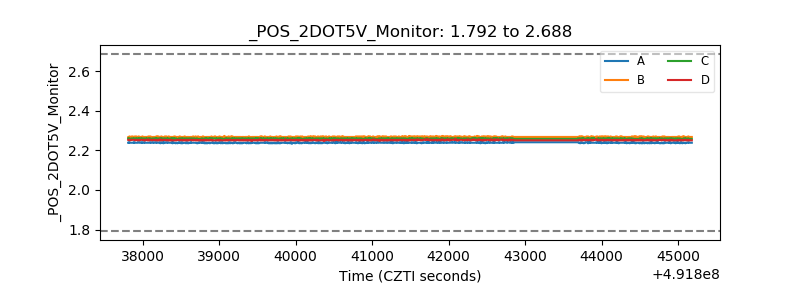 |
| +5 Volts monitor | 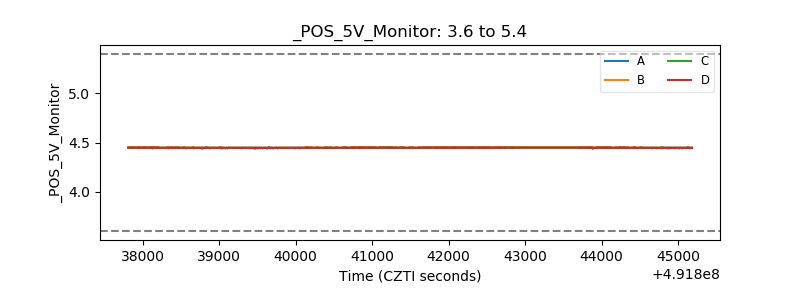 |
| _ROLL_ROT | 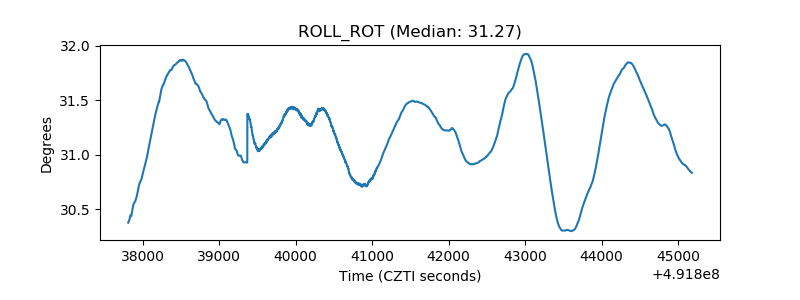 |
| _Roll_DEC | 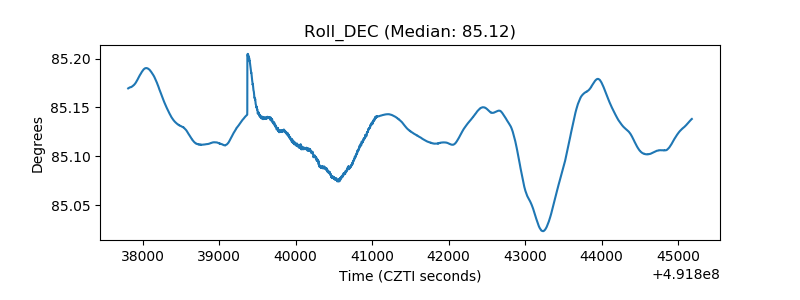 |
| _Roll_RA | 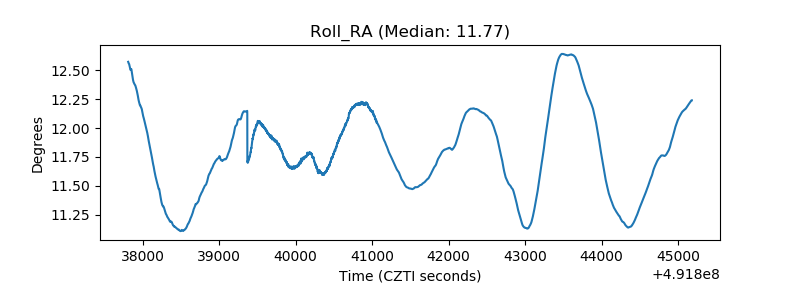 |
| Veto Counter | 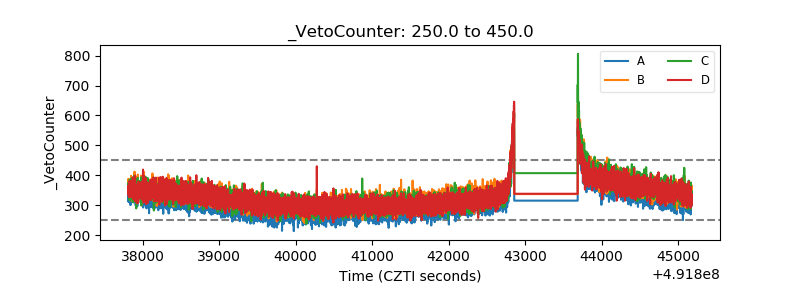 |