| Param | Original file | Final file |
|---|---|---|
| Filename | modeM0/AS1C09_011T08_9000006492_53264cztM0_level2.fits | modeM0/AS1C09_011T08_9000006492_53264cztM0_level2_quad_clean.evt |
| Size (bytes) | 581,932,800 | 93,182,400 |
| Size | 555.0 MB | 88.9 MB |
| Events in quadrant A | 4,840,005 | 623,639 |
| Events in quadrant B | 3,639,735 | 691,633 |
| Events in quadrant C | 7,922,473 | 477,150 |
| Events in quadrant D | 4,618,632 | 561,543 |
| Mode M0 | |||
|---|---|---|---|
| Quadrant | BADHDUFLAG | Total packets | Discarded packets |
| A | 0 | 19067 | 2 |
| B | 0 | 15480 | 2 |
| C | 0 | 28340 | 5 |
| D | 0 | 18364 | 2 |
| Mode M9 | |||
|---|---|---|---|
| Quadrant | BADHDUFLAG | Total packets | Discarded packets |
| A | 0 | 10 | 0 |
| B | 0 | 10 | 0 |
| C | 0 | 10 | 0 |
| D | 0 | 10 | 0 |
| Mode SS | |||
|---|---|---|---|
| Quadrant | BADHDUFLAG | Total packets | Discarded packets |
| A | 0 | 136 | 0 |
| B | 0 | 136 | 0 |
| C | 0 | 136 | 0 |
| D | 0 | 136 | 0 |
| Quadrant | Total seconds | Saturated seconds | Saturation percentage |
|---|---|---|---|
| A | 6703 | 401 | 5.982396% |
| B | 6704 | 121 | 1.804893% |
| C | 6703 | 1674 | 24.973892% |
| D | 6703 | 389 | 5.803372% |
Noise dominated data is calculated using 1-second bins in cleaned event files. If a bin has >2000 counts, and if more than 50% of those come from <1% of pixels, then it is considered to be noise-dominated and hence unusable.
| Quadrant | # 1 sec bins | Bins with >0 counts | Bins with >2000 counts | High rate bins dominated by noise | Noise dominated (total time) | Noise dominated (detector-on time) | Marked lightcurve |
|---|---|---|---|---|---|---|---|
| A | 7708 | 6703 | 355 | 355 | 4.61% | 5.30% | 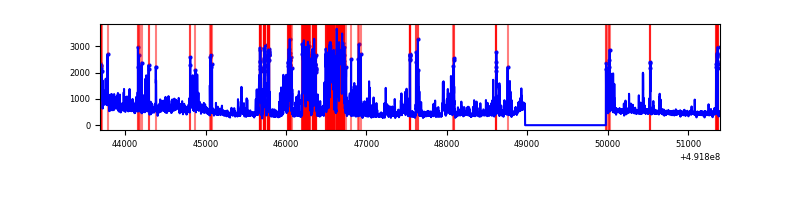 |
| B | 7709 | 6704 | 58 | 58 | 0.75% | 0.87% | 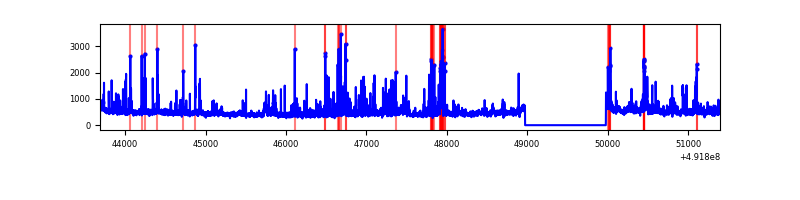 |
| C | 7708 | 6703 | 1467 | 1467 | 19.03% | 21.89% | 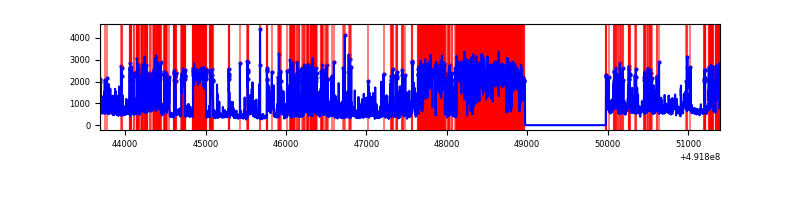 |
| D | 7708 | 6703 | 343 | 343 | 4.45% | 5.12% | 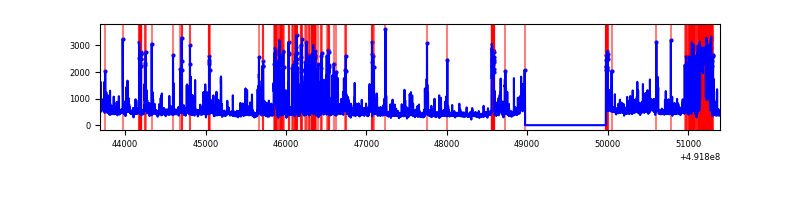 |
Top three noisy pixels from each quadrant. If the there are fewer than three noisy pixels in the level2.evt file, extra rows are filled as -1
| Pixel properties | Quadrant properties | ||||||
|---|---|---|---|---|---|---|---|
| Quadrant | DetID | PixID | Counts | Sigma | Mean | Median | Sigma |
| A | 3 | 62 | 1044119 | 5918.74 | 706 | 689 | 176.3 |
| A | 7 | 206 | 248230 | 1404.15 | 706 | 689 | 176.3 |
| A | 3 | 14 | 245081 | 1386.29 | 706 | 689 | 176.3 |
| B | 2 | 249 | 196805 | 1300.1 | 709 | 686 | 150.8 |
| B | 4 | 171 | 123393 | 813.44 | 709 | 686 | 150.8 |
| B | 0 | 213 | 99432 | 654.6 | 709 | 686 | 150.8 |
| C | 9 | 38 | 2252210 | 13193.93 | 626 | 620 | 170.7 |
| C | 15 | 224 | 1084218 | 6349.7 | 626 | 620 | 170.7 |
| C | 15 | 198 | 1008245 | 5904.51 | 626 | 620 | 170.7 |
| D | 10 | 172 | 630906 | 3227.96 | 686 | 656 | 195.2 |
| D | 3 | 12 | 504981 | 2583.01 | 686 | 656 | 195.2 |
| D | 12 | 3 | 200520 | 1023.65 | 686 | 656 | 195.2 |
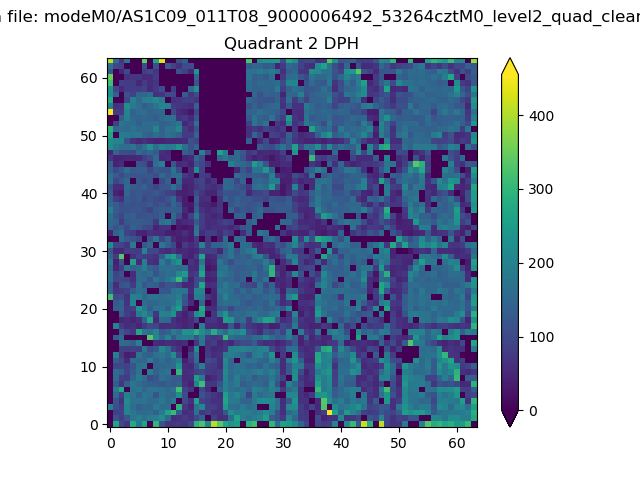
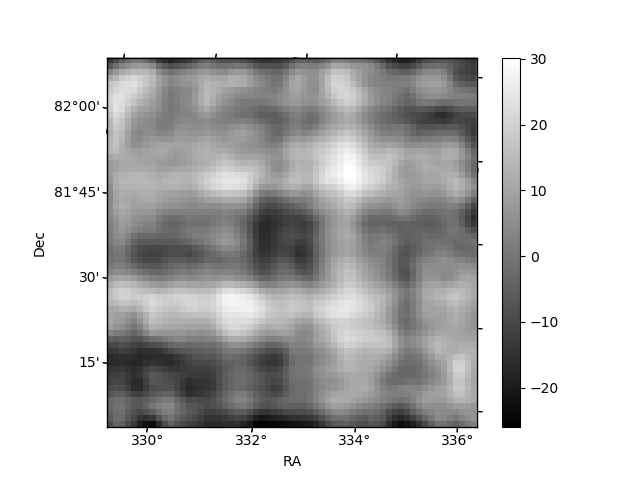
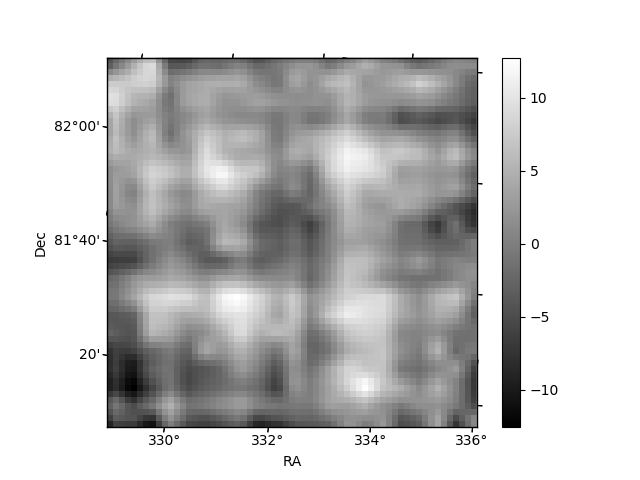
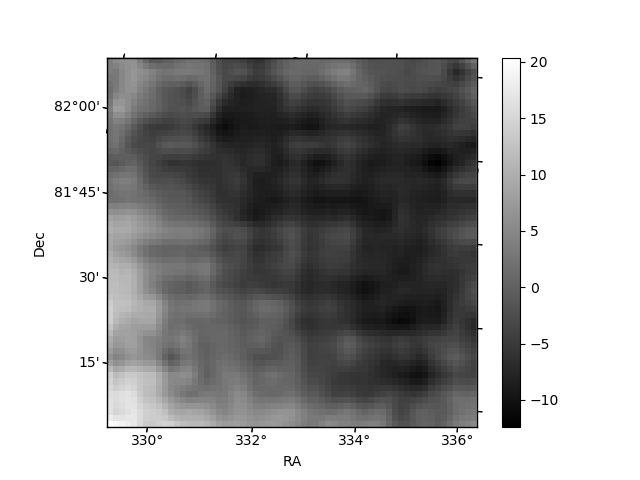
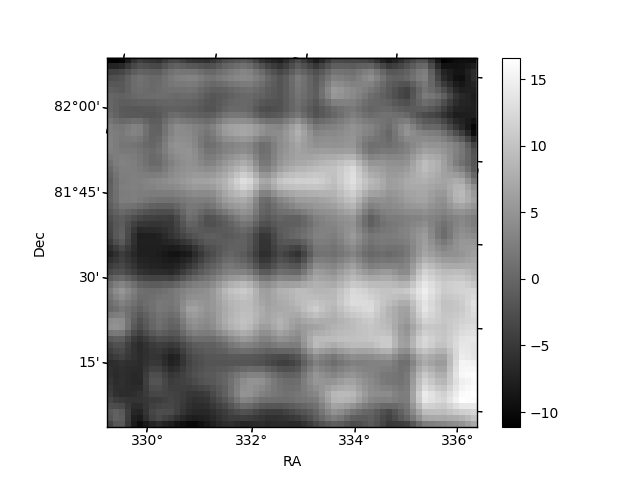
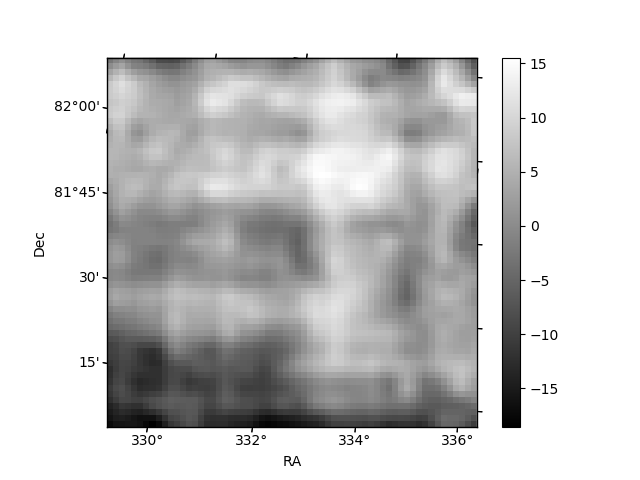
Histogram calculated using DETX and DETY for each event in the final _common_clean file
| Quadrant A | 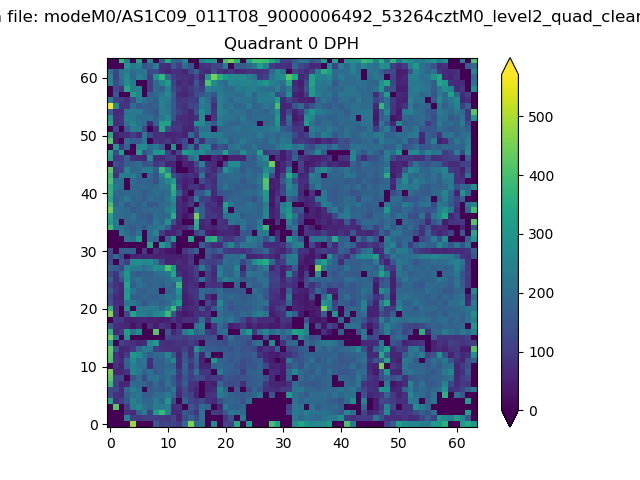 |
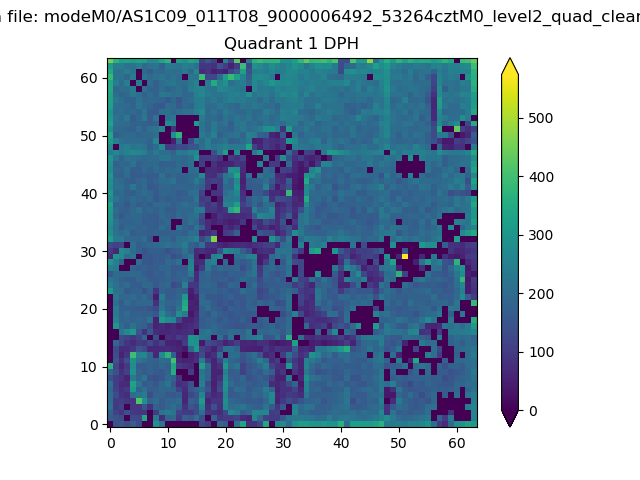 |
Quadrant B |
|---|---|---|---|
| Quadrant D | 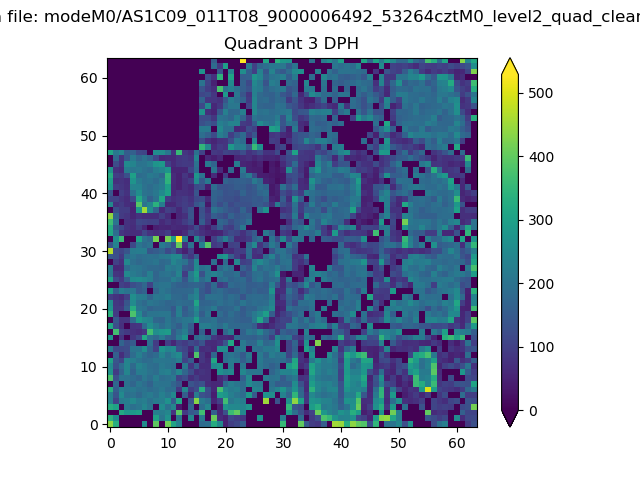 |
 |
Quadrant C |
| Plot type | Count rate plots | Images |
|---|---|---|
| Comparison with Poisson distribution Blue bars denote a histogram of data divided into 1 sec bins. Red curve is a Poisson curve with rate = median count rate of data. |
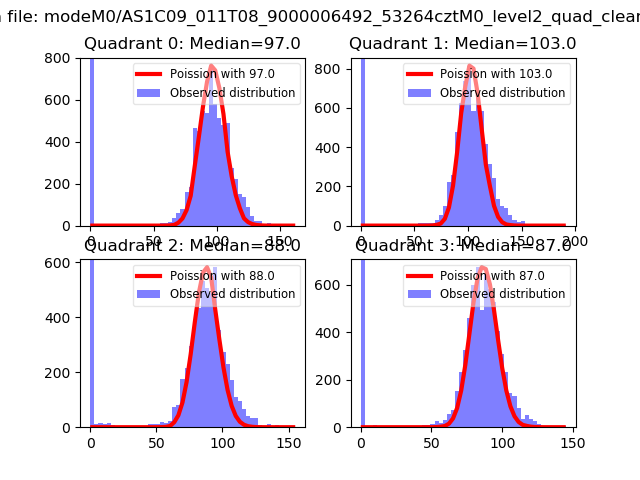 |
 |
| Quadrant-wise count rates Data is divided into 100 sec bins |
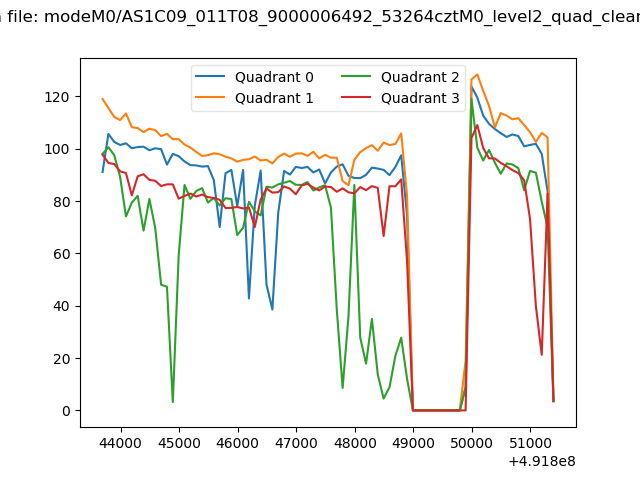 |
|
| Module-wise count rates for Quadrant A Data is divided into 100 sec bins |
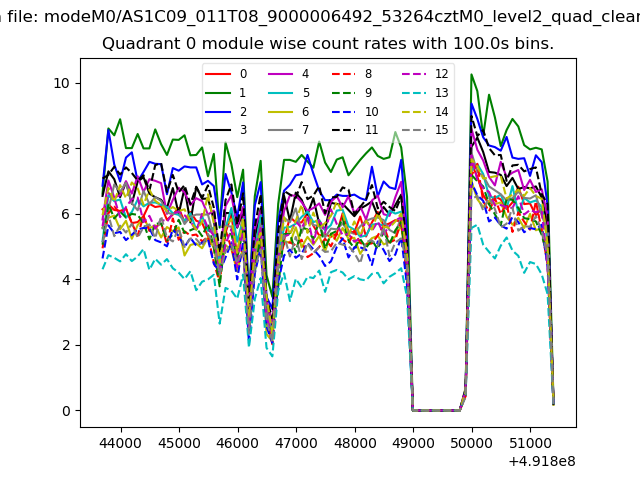 |
 |
| Module-wise count rates for Quadrant B Data is divided into 100 sec bins |
 |
 |
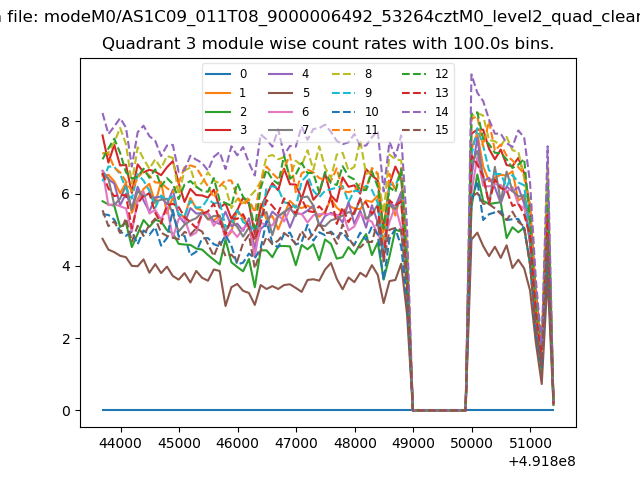
| Module-wise count rates for Quadrant C Data is divided into 100 sec bins |
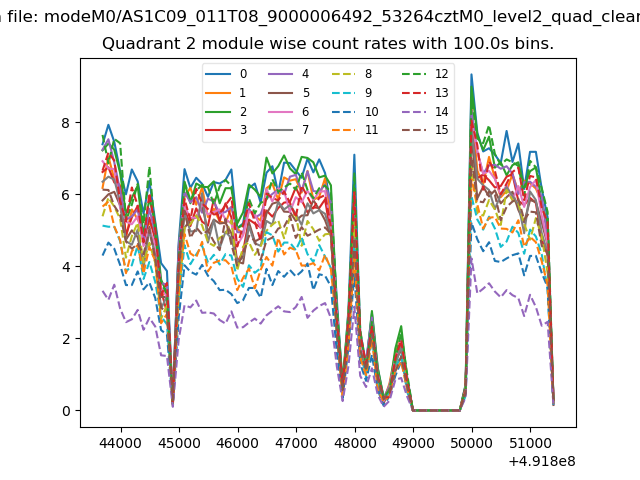 |
 |
| Module-wise count rates for Quadrant D Data is divided into 100 sec bins |
 |
 |
| Parameter | Plot |
|---|---|
| CZT HV Monitor | 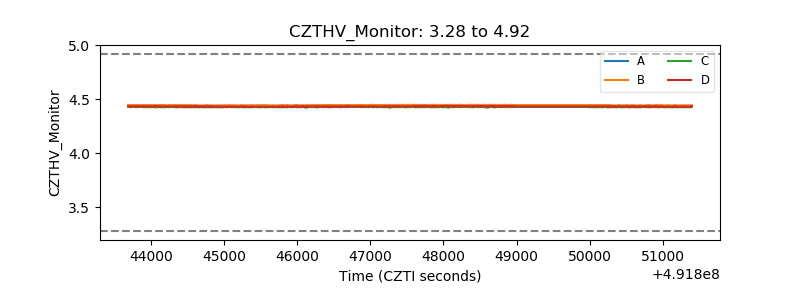 |
| D_VDD | 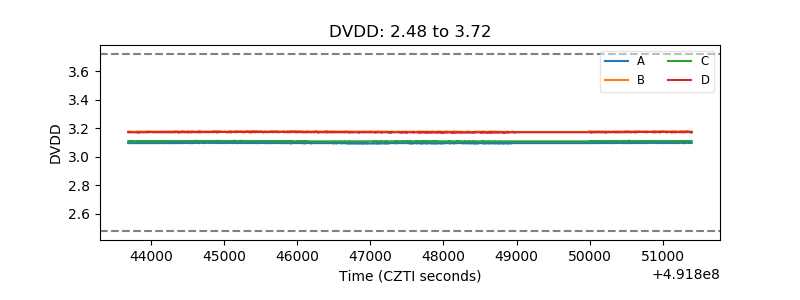 |
| Temperature 1 | 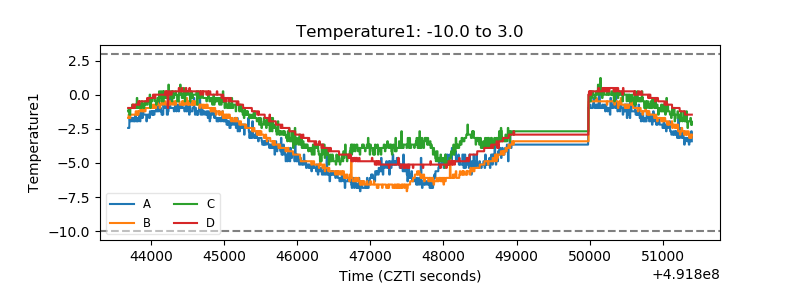 |
| Veto HV Monitor | 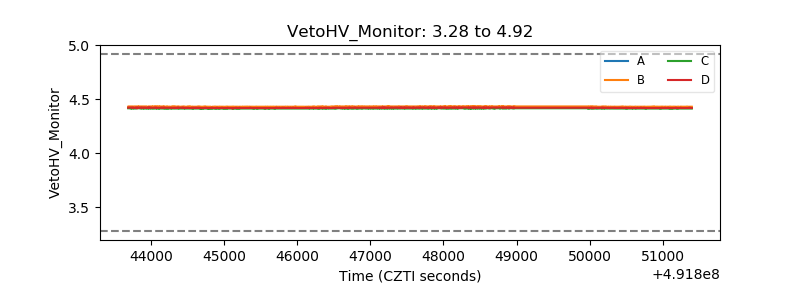 |
| Veto LLD | 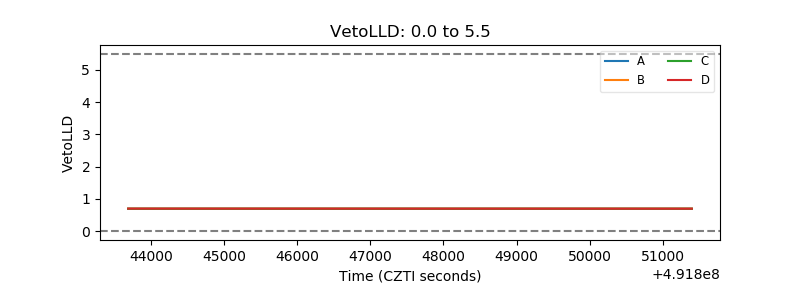 |
| Alpha Counter | 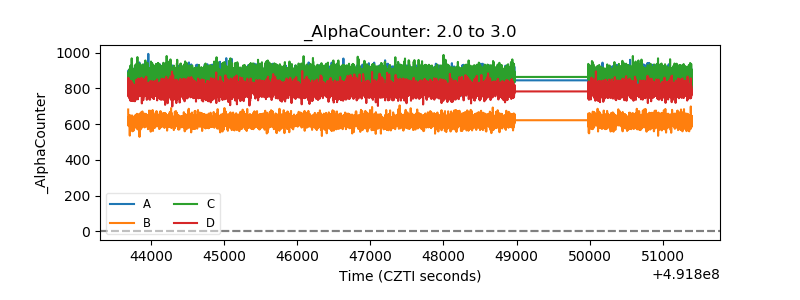 |
| _CPM_Rate | 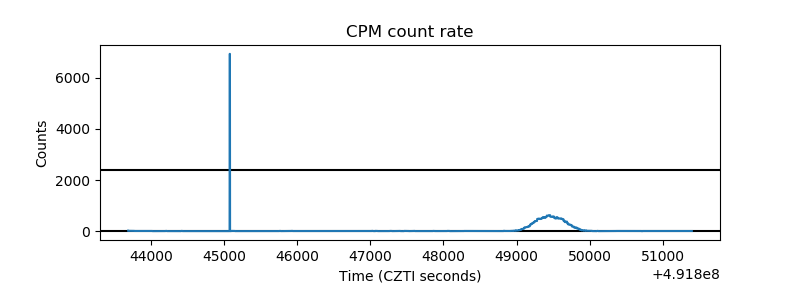 |
| CZT Counter | 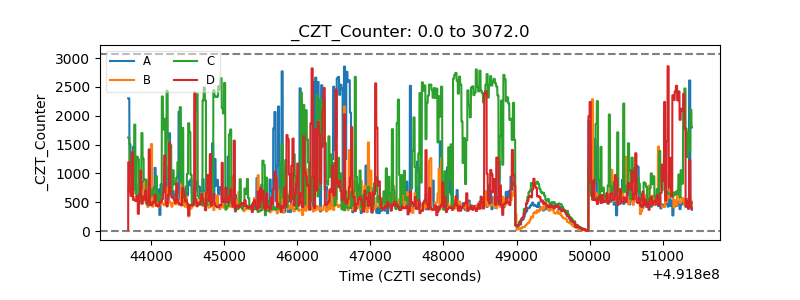 |
| +2.5 Volts monitor |  |
| +5 Volts monitor |  |
| _ROLL_ROT | 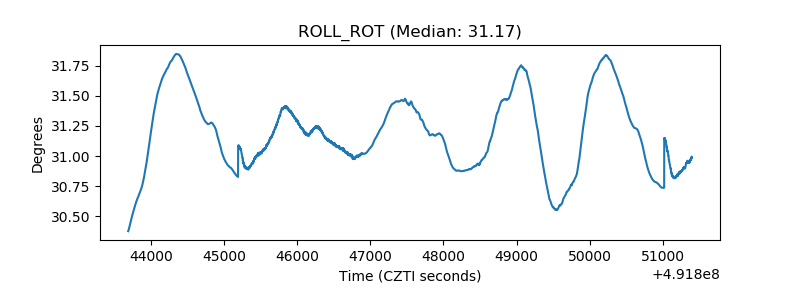 |
| _Roll_DEC | 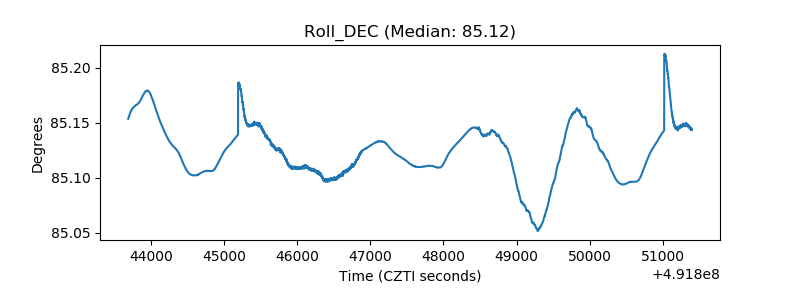 |
| _Roll_RA | 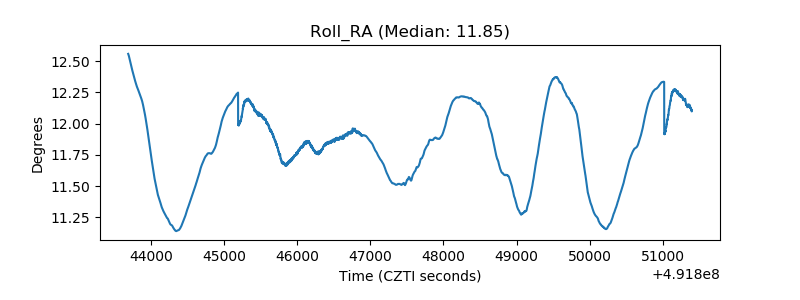 |
| Veto Counter | 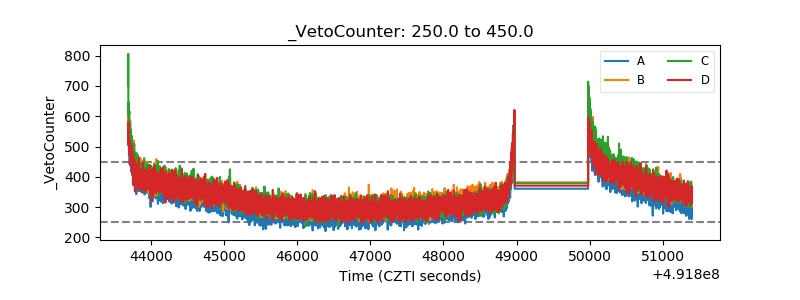 |