| Param | Original file | Final file |
|---|---|---|
| Filename | modeM0/AS1C09_011T08_9000006492_53265cztM0_level2.fits | modeM0/AS1C09_011T08_9000006492_53265cztM0_level2_quad_clean.evt |
| Size (bytes) | 699,330,240 | 79,130,880 |
| Size | 666.9 MB | 75.5 MB |
| Events in quadrant A | 5,353,674 | 533,283 |
| Events in quadrant B | 5,143,229 | 591,458 |
| Events in quadrant C | 10,337,907 | 348,110 |
| Events in quadrant D | 4,589,828 | 505,761 |
| Mode M0 | |||
|---|---|---|---|
| Quadrant | BADHDUFLAG | Total packets | Discarded packets |
| A | 0 | 19915 | 1 |
| B | 0 | 19450 | 1 |
| C | 0 | 34886 | 1 |
| D | 0 | 17800 | 1 |
| Mode M9 | |||
|---|---|---|---|
| Quadrant | BADHDUFLAG | Total packets | Discarded packets |
| A | 0 | 12 | 0 |
| B | 0 | 12 | 0 |
| C | 0 | 12 | 0 |
| D | 0 | 12 | 0 |
| Mode SS | |||
|---|---|---|---|
| Quadrant | BADHDUFLAG | Total packets | Discarded packets |
| A | 0 | 120 | 0 |
| B | 0 | 120 | 0 |
| C | 0 | 120 | 0 |
| D | 0 | 120 | 0 |
| Quadrant | Total seconds | Saturated seconds | Saturation percentage |
|---|---|---|---|
| A | 5974 | 707 | 11.834617% |
| B | 5974 | 547 | 9.156344% |
| C | 5974 | 2600 | 43.521928% |
| D | 5974 | 411 | 6.879813% |
Noise dominated data is calculated using 1-second bins in cleaned event files. If a bin has >2000 counts, and if more than 50% of those come from <1% of pixels, then it is considered to be noise-dominated and hence unusable.
| Quadrant | # 1 sec bins | Bins with >0 counts | Bins with >2000 counts | High rate bins dominated by noise | Noise dominated (total time) | Noise dominated (detector-on time) | Marked lightcurve |
|---|---|---|---|---|---|---|---|
| A | 7114 | 5974 | 691 | 691 | 9.71% | 11.57% | 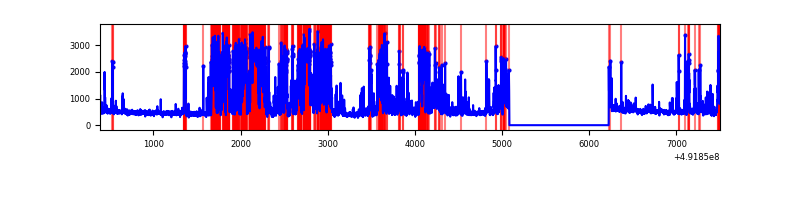 |
| B | 7114 | 5975 | 442 | 442 | 6.21% | 7.40% | 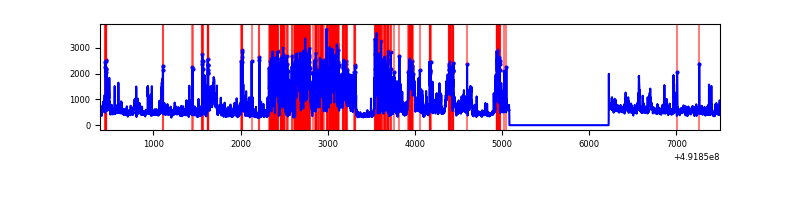 |
| C | 7114 | 5975 | 2556 | 2556 | 35.93% | 42.78% | 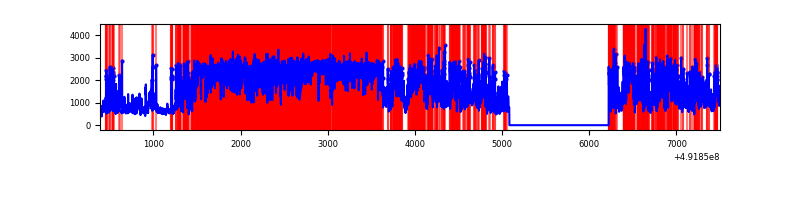 |
| D | 7113 | 5974 | 381 | 381 | 5.36% | 6.38% | 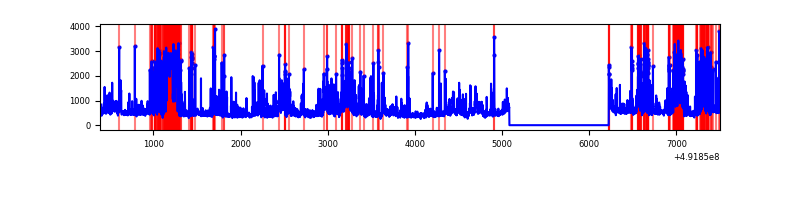 |
Top three noisy pixels from each quadrant. If the there are fewer than three noisy pixels in the level2.evt file, extra rows are filled as -1
| Pixel properties | Quadrant properties | ||||||
|---|---|---|---|---|---|---|---|
| Quadrant | DetID | PixID | Counts | Sigma | Mean | Median | Sigma |
| A | 3 | 62 | 2115428 | 13981.09 | 602 | 586 | 151.3 |
| A | 7 | 206 | 336731 | 2222.23 | 602 | 586 | 151.3 |
| A | 3 | 27 | 229283 | 1511.9 | 602 | 586 | 151.3 |
| B | 4 | 81 | 1147290 | 8788.28 | 610 | 589 | 130.5 |
| B | 2 | 249 | 545909 | 4179.31 | 610 | 589 | 130.5 |
| B | 10 | 254 | 334115 | 2556.13 | 610 | 589 | 130.5 |
| C | 9 | 38 | 5343428 | 36959.85 | 523 | 517 | 144.6 |
| C | 10 | 22 | 1061400 | 7338.71 | 523 | 517 | 144.6 |
| C | 15 | 224 | 815914 | 5640.55 | 523 | 517 | 144.6 |
| D | 10 | 172 | 817492 | 4787.17 | 598 | 571 | 170.6 |
| D | 13 | 170 | 527980 | 3090.63 | 598 | 571 | 170.6 |
| D | 12 | 3 | 313062 | 1831.2 | 598 | 571 | 170.6 |
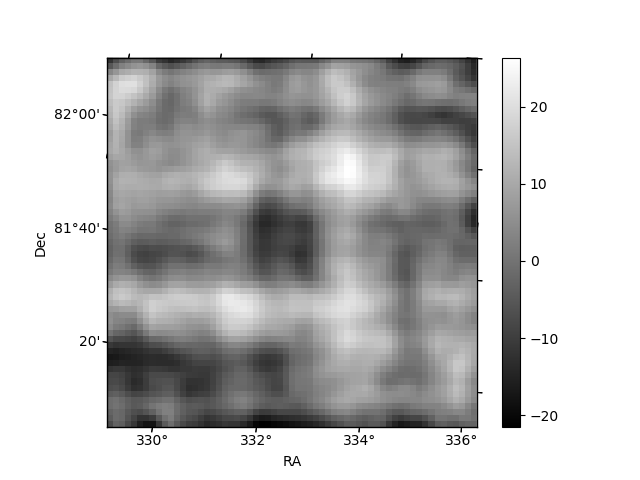
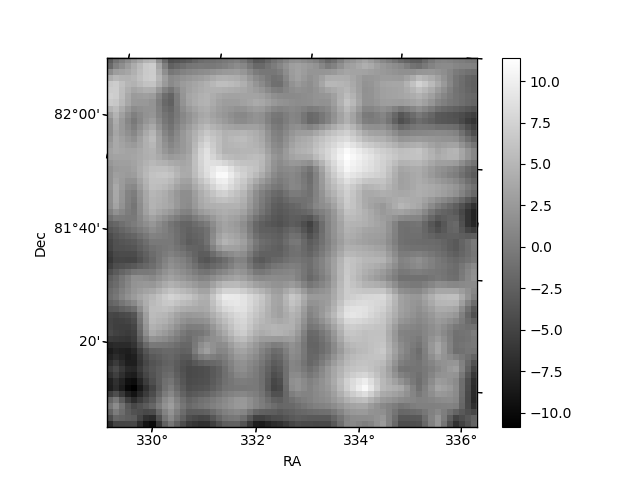
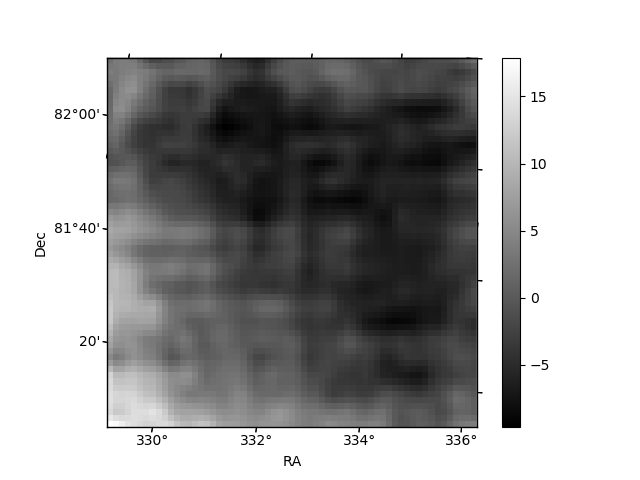
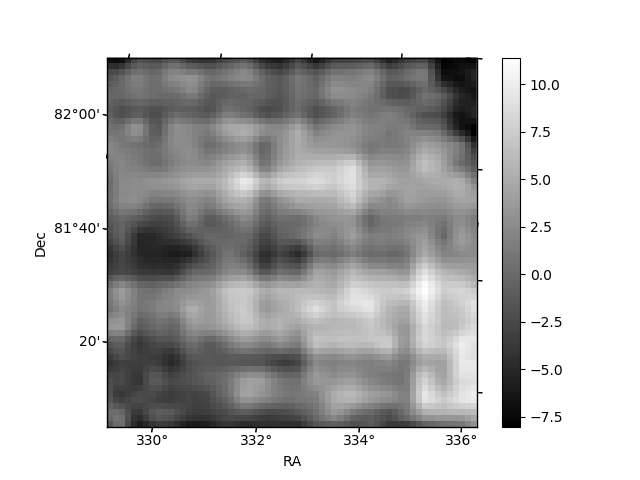
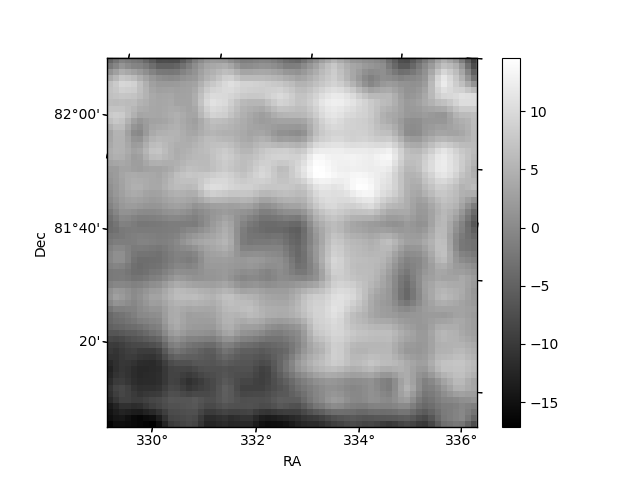
Histogram calculated using DETX and DETY for each event in the final _common_clean file
| Quadrant A | 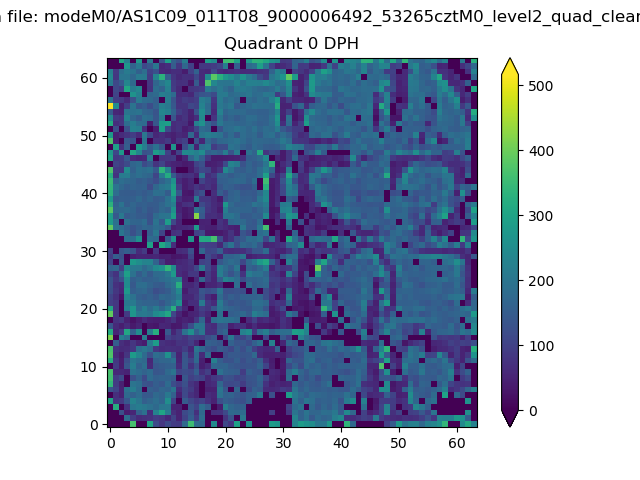 |
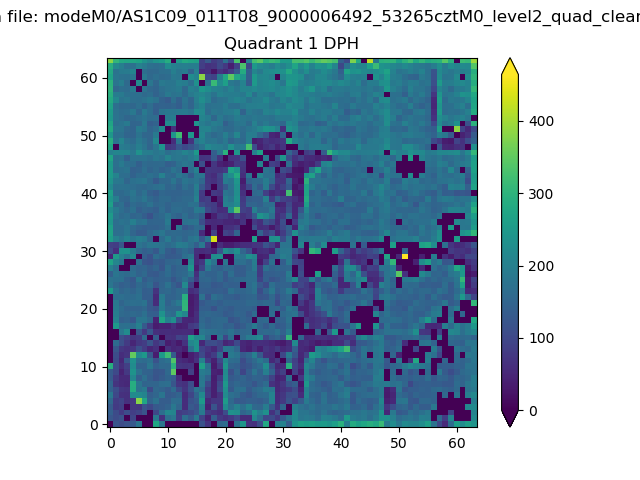 |
Quadrant B |
|---|---|---|---|
| Quadrant D | 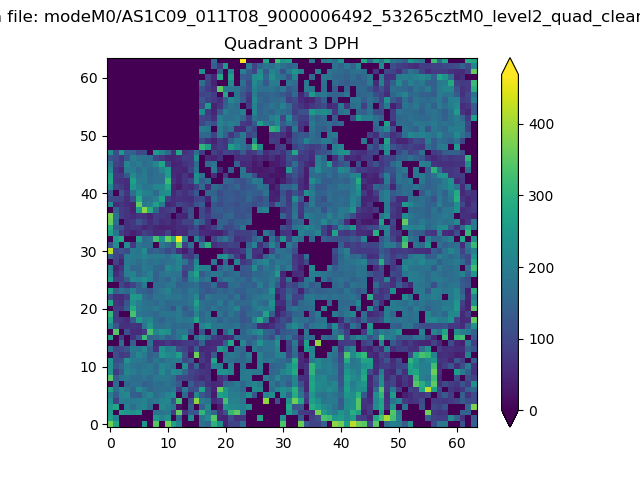 |
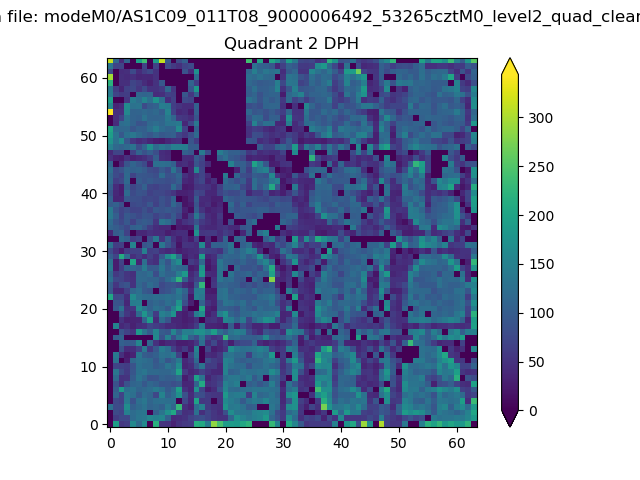 |
Quadrant C |
| Plot type | Count rate plots | Images |
|---|---|---|
| Comparison with Poisson distribution Blue bars denote a histogram of data divided into 1 sec bins. Red curve is a Poisson curve with rate = median count rate of data. |
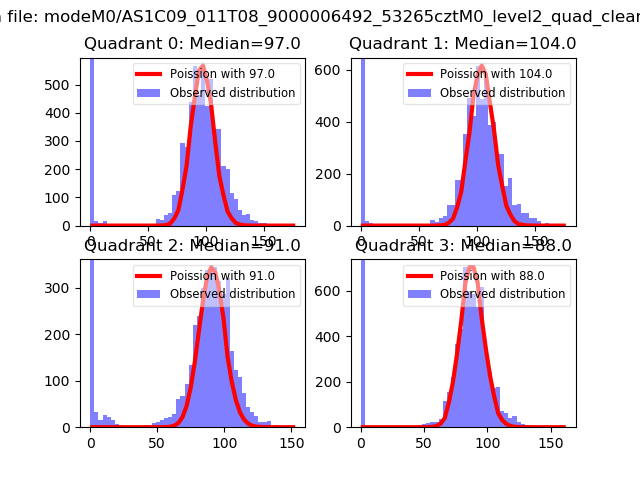 |
 |
| Quadrant-wise count rates Data is divided into 100 sec bins |
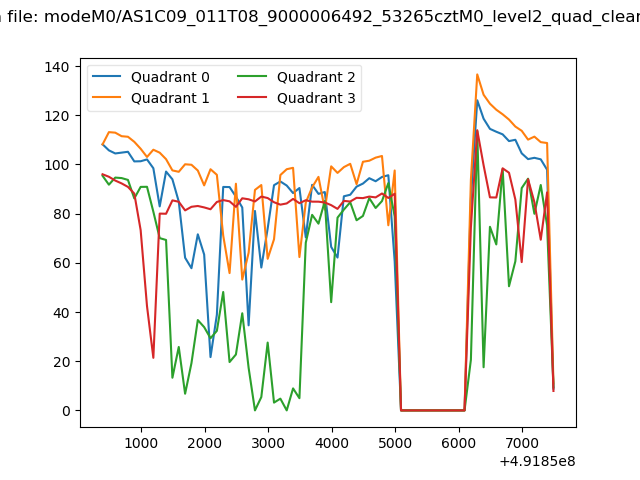 |
|
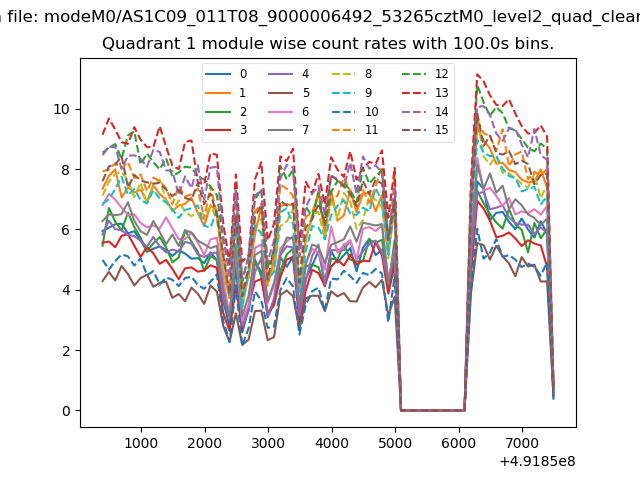
| Module-wise count rates for Quadrant A Data is divided into 100 sec bins |
 |
 |
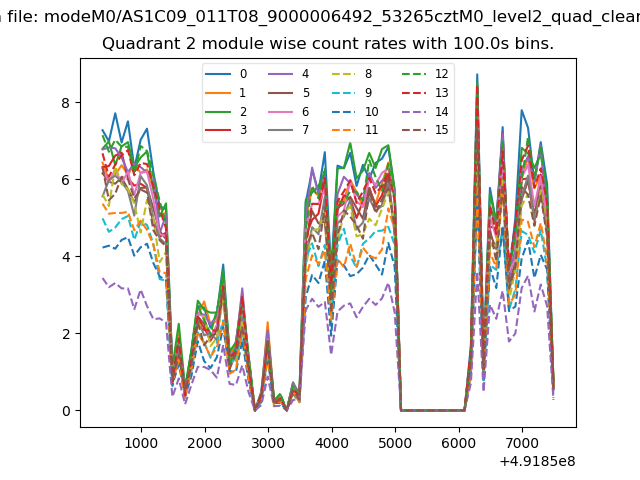
| Module-wise count rates for Quadrant B Data is divided into 100 sec bins |
 |
 |
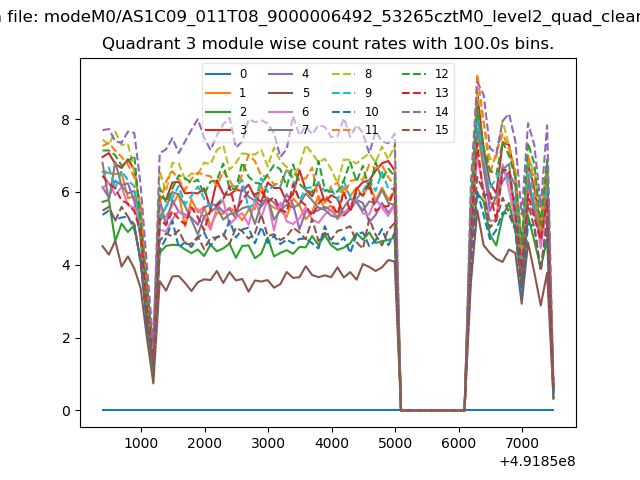
| Module-wise count rates for Quadrant C Data is divided into 100 sec bins |
 |
 |
| Module-wise count rates for Quadrant D Data is divided into 100 sec bins |
 |
 |
| Parameter | Plot |
|---|---|
| CZT HV Monitor | 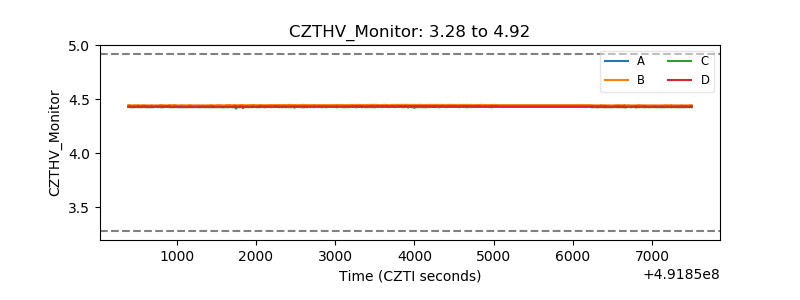 |
| D_VDD | 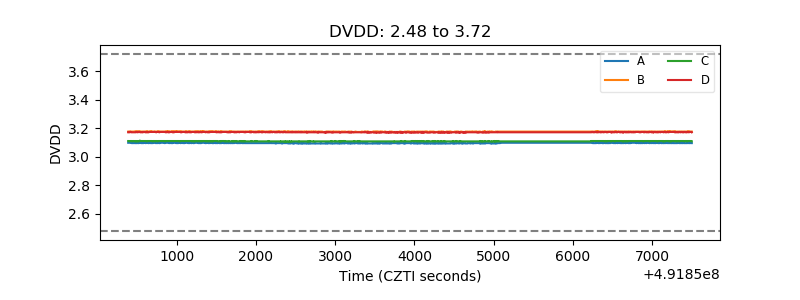 |
| Temperature 1 | 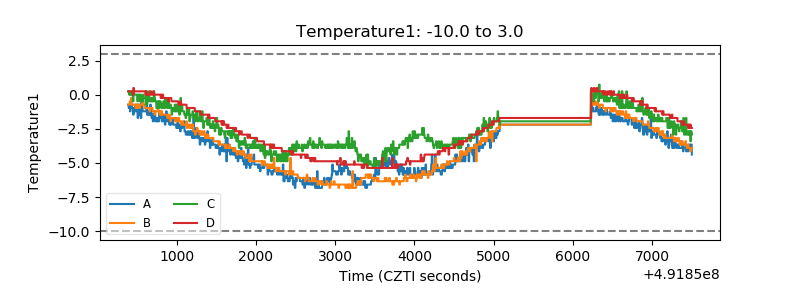 |
| Veto HV Monitor | 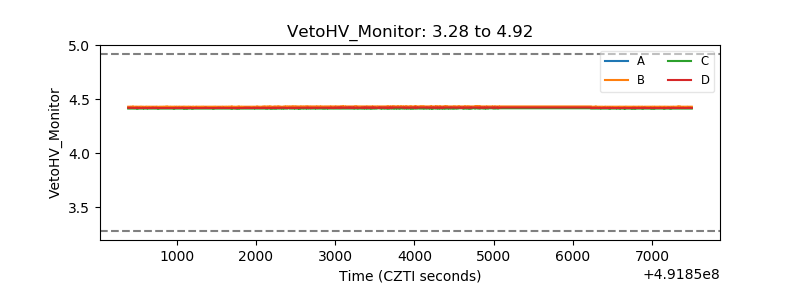 |
| Veto LLD | 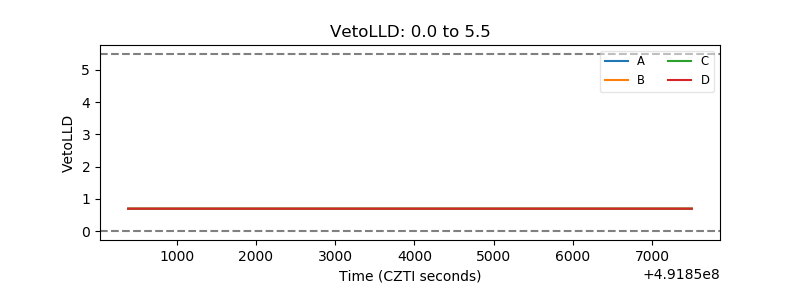 |
| Alpha Counter | 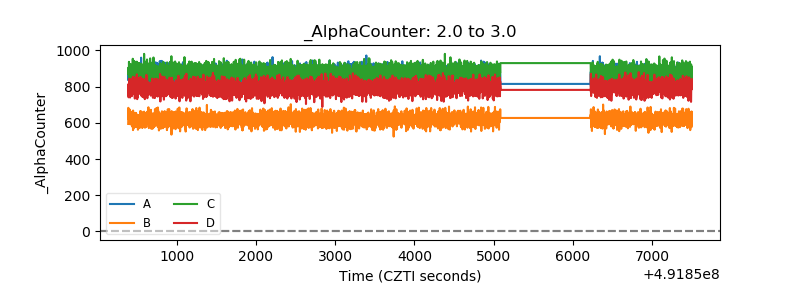 |
| _CPM_Rate | 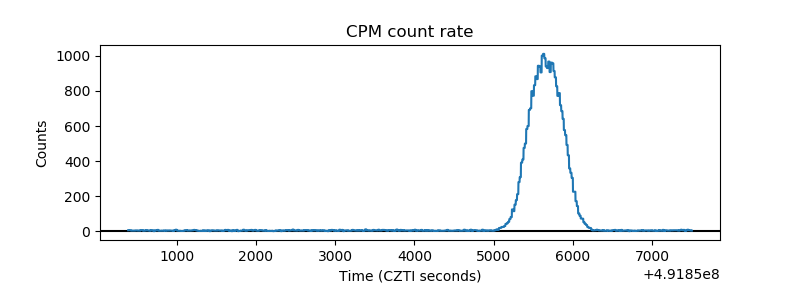 |
| CZT Counter | 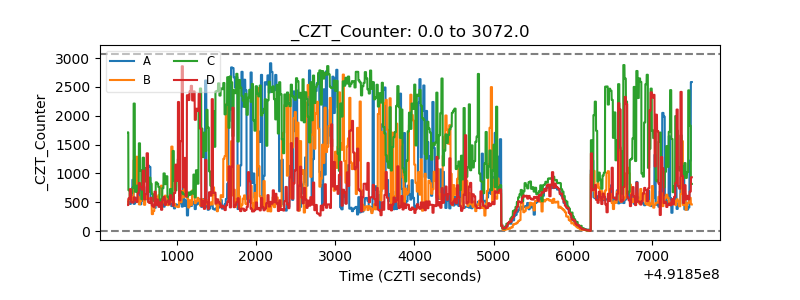 |
| +2.5 Volts monitor |  |
| +5 Volts monitor | 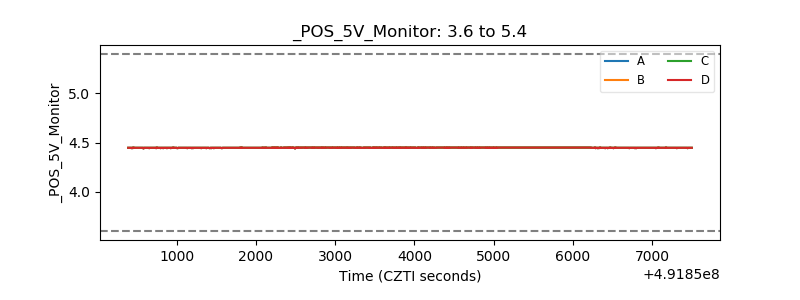 |
| _ROLL_ROT | 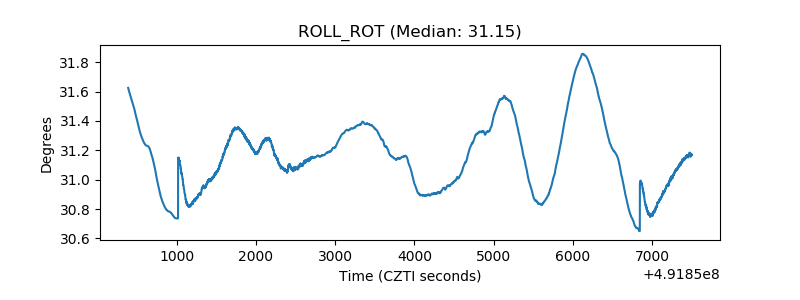 |
| _Roll_DEC | 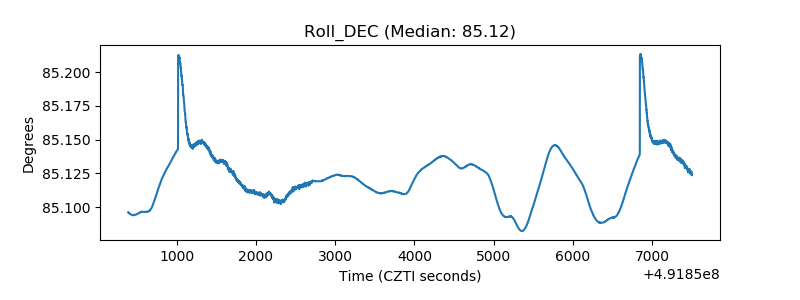 |
| _Roll_RA | 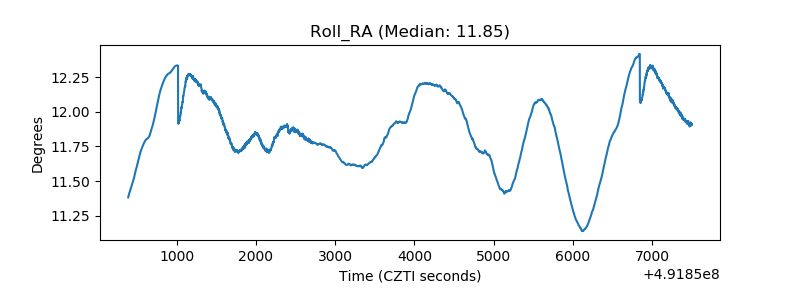 |
| Veto Counter | 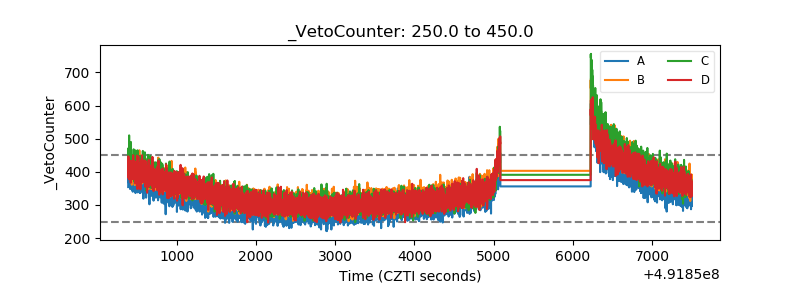 |