| Param | Original file | Final file |
|---|---|---|
| Filename | modeM0/AS1C09_011T08_9000006492_53266cztM0_level2.fits | modeM0/AS1C09_011T08_9000006492_53266cztM0_level2_quad_clean.evt |
| Size (bytes) | 593,095,680 | 92,246,400 |
| Size | 565.6 MB | 88.0 MB |
| Events in quadrant A | 5,743,456 | 578,462 |
| Events in quadrant B | 4,101,092 | 672,604 |
| Events in quadrant C | 6,945,056 | 549,689 |
| Events in quadrant D | 4,676,583 | 552,574 |
| Mode M0 | |||
|---|---|---|---|
| Quadrant | BADHDUFLAG | Total packets | Discarded packets |
| A | 0 | 21339 | 2 |
| B | 0 | 16574 | 2 |
| C | 0 | 25033 | 2 |
| D | 0 | 18356 | 2 |
| Mode M9 | |||
|---|---|---|---|
| Quadrant | BADHDUFLAG | Total packets | Discarded packets |
| A | 0 | 16 | 0 |
| B | 0 | 17 | 0 |
| C | 0 | 17 | 0 |
| D | 0 | 17 | 0 |
| Mode SS | |||
|---|---|---|---|
| Quadrant | BADHDUFLAG | Total packets | Discarded packets |
| A | 0 | 126 | 0 |
| B | 0 | 126 | 0 |
| C | 0 | 126 | 0 |
| D | 0 | 126 | 0 |
| Quadrant | Total seconds | Saturated seconds | Saturation percentage |
|---|---|---|---|
| A | 6307 | 738 | 11.701284% |
| B | 6307 | 266 | 4.217536% |
| C | 6307 | 824 | 13.064849% |
| D | 6307 | 472 | 7.483748% |
Noise dominated data is calculated using 1-second bins in cleaned event files. If a bin has >2000 counts, and if more than 50% of those come from <1% of pixels, then it is considered to be noise-dominated and hence unusable.
| Quadrant | # 1 sec bins | Bins with >0 counts | Bins with >2000 counts | High rate bins dominated by noise | Noise dominated (total time) | Noise dominated (detector-on time) | Marked lightcurve |
|---|---|---|---|---|---|---|---|
| A | 7472 | 6307 | 720 | 720 | 9.64% | 11.42% | 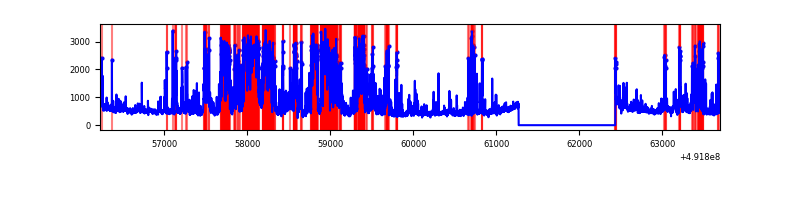 |
| B | 7472 | 6307 | 169 | 169 | 2.26% | 2.68% | 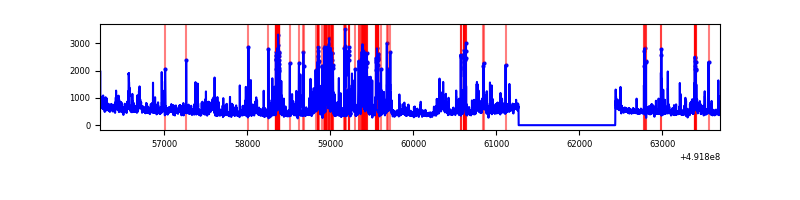 |
| C | 7472 | 6307 | 718 | 718 | 9.61% | 11.38% | 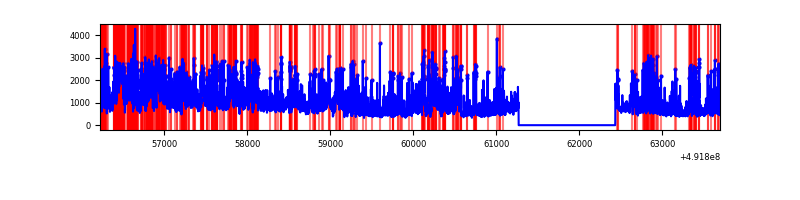 |
| D | 7472 | 6307 | 383 | 383 | 5.13% | 6.07% | 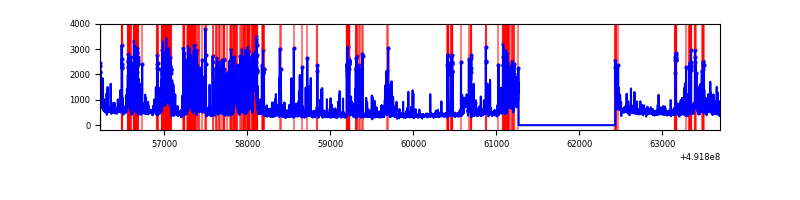 |
Top three noisy pixels from each quadrant. If the there are fewer than three noisy pixels in the level2.evt file, extra rows are filled as -1
| Pixel properties | Quadrant properties | ||||||
|---|---|---|---|---|---|---|---|
| Quadrant | DetID | PixID | Counts | Sigma | Mean | Median | Sigma |
| A | 3 | 62 | 2256053 | 13745.3 | 655 | 638 | 164.1 |
| A | 3 | 27 | 486806 | 2962.88 | 655 | 638 | 164.1 |
| A | 7 | 206 | 156987 | 952.84 | 655 | 638 | 164.1 |
| B | 2 | 249 | 437036 | 3042.31 | 675 | 653 | 143.4 |
| B | 0 | 213 | 228473 | 1588.28 | 675 | 653 | 143.4 |
| B | 4 | 81 | 219646 | 1526.74 | 675 | 653 | 143.4 |
| C | 9 | 38 | 1641248 | 9280.12 | 638 | 631 | 176.8 |
| C | 15 | 224 | 731845 | 4136.1 | 638 | 631 | 176.8 |
| C | 10 | 22 | 573791 | 3242.07 | 638 | 631 | 176.8 |
| D | 13 | 170 | 1073202 | 5887.54 | 648 | 620 | 182.2 |
| D | 12 | 3 | 146900 | 802.95 | 648 | 620 | 182.2 |
| D | 2 | 249 | 145532 | 795.44 | 648 | 620 | 182.2 |
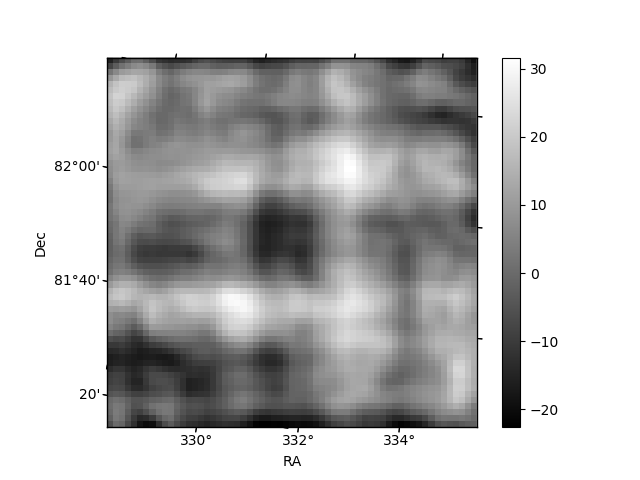
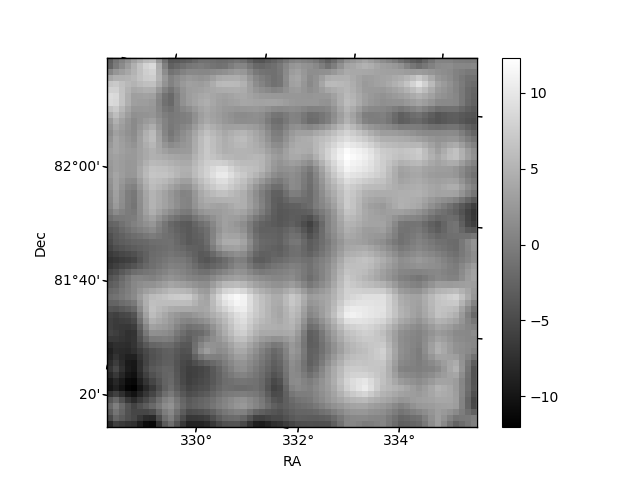
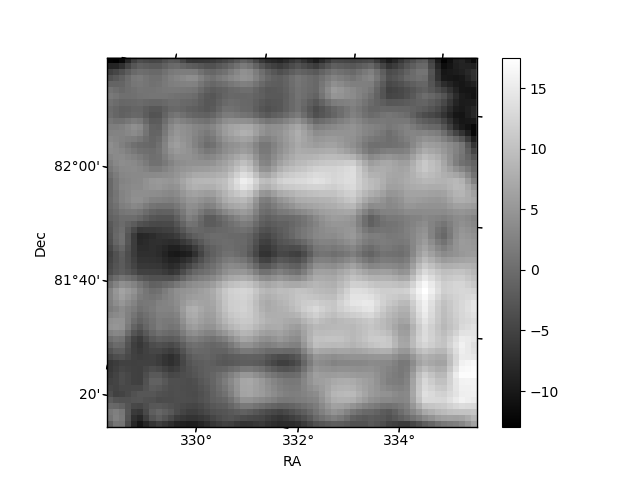
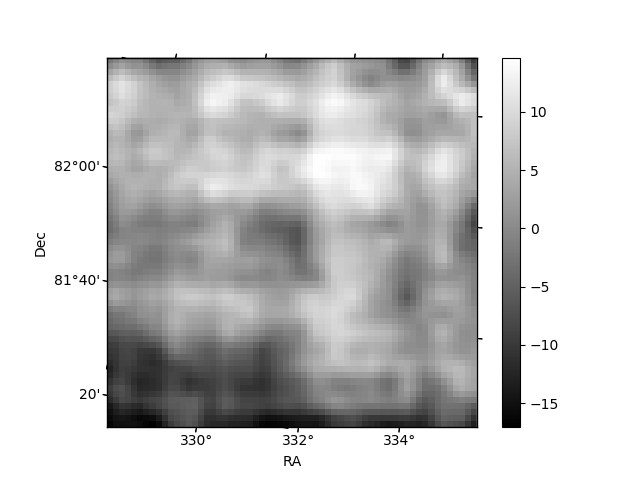
Histogram calculated using DETX and DETY for each event in the final _common_clean file
| Quadrant A | 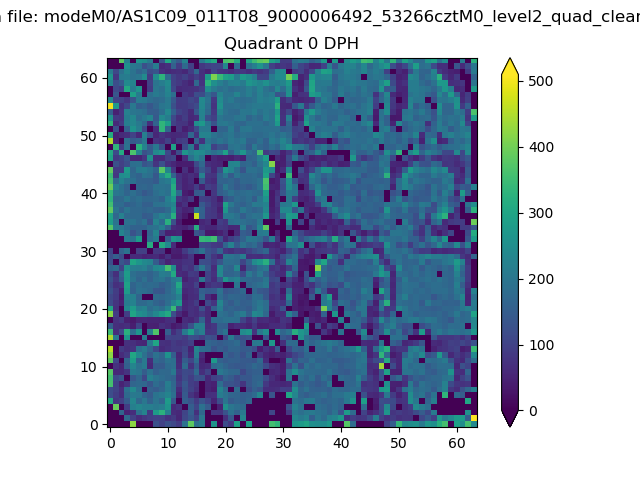 |
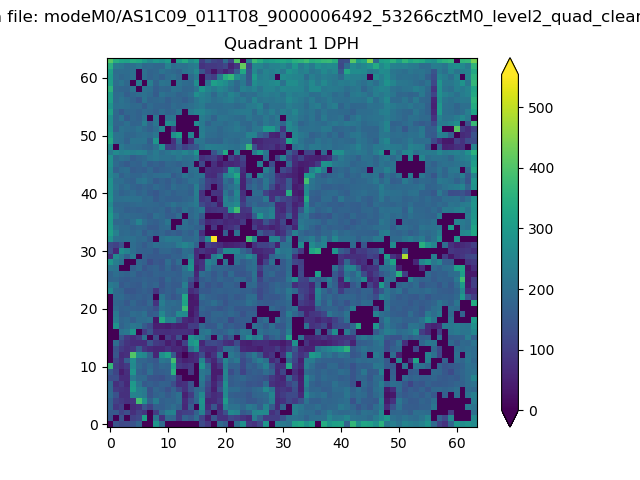 |
Quadrant B |
|---|---|---|---|
| Quadrant D | 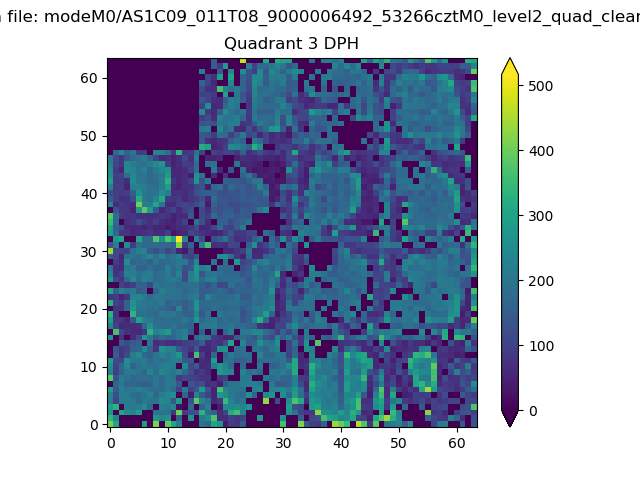 |
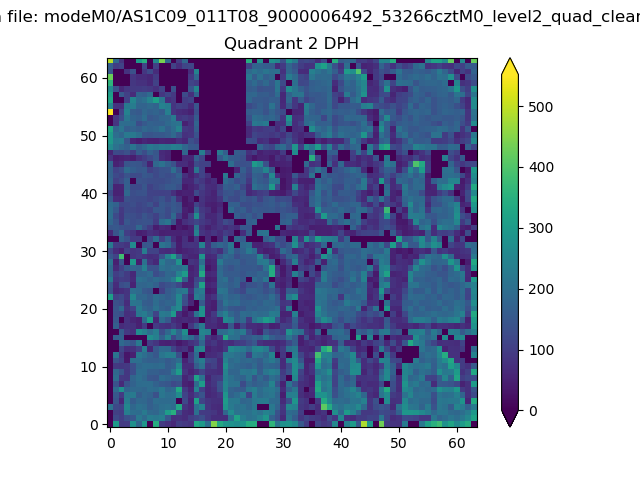 |
Quadrant C |
| Plot type | Count rate plots | Images |
|---|---|---|
| Comparison with Poisson distribution Blue bars denote a histogram of data divided into 1 sec bins. Red curve is a Poisson curve with rate = median count rate of data. |
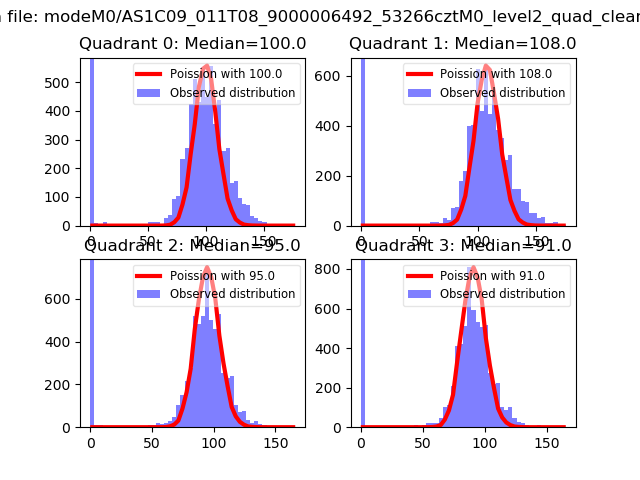 |
 |
| Quadrant-wise count rates Data is divided into 100 sec bins |
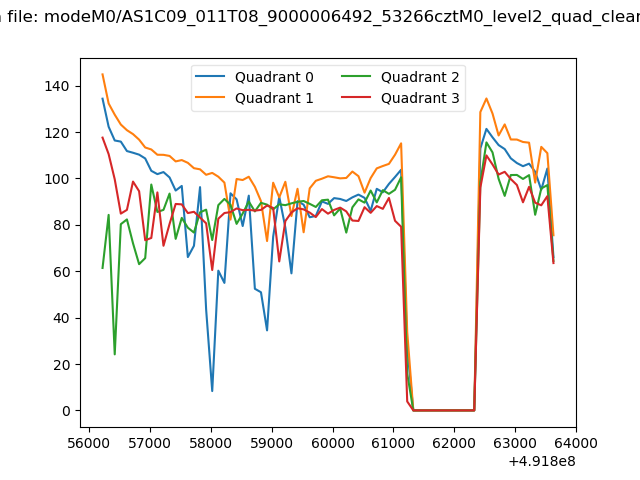 |
|
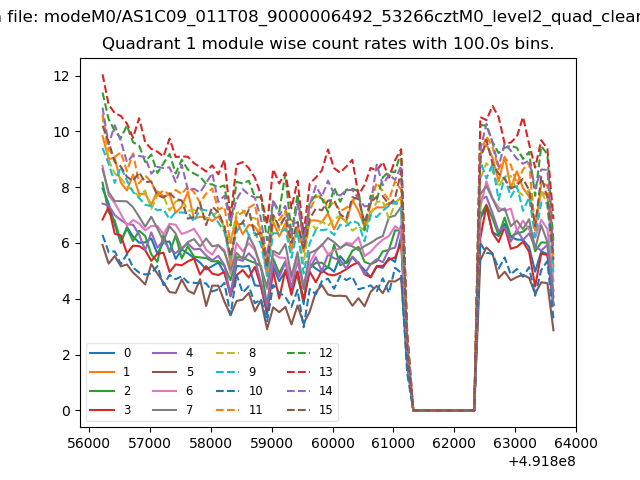
| Module-wise count rates for Quadrant A Data is divided into 100 sec bins |
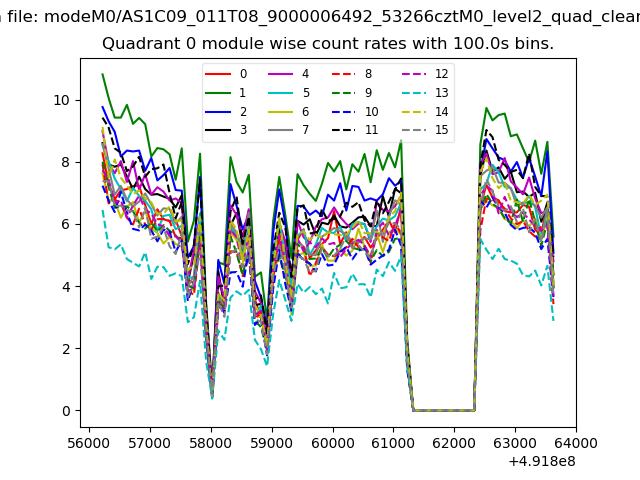 |
 |
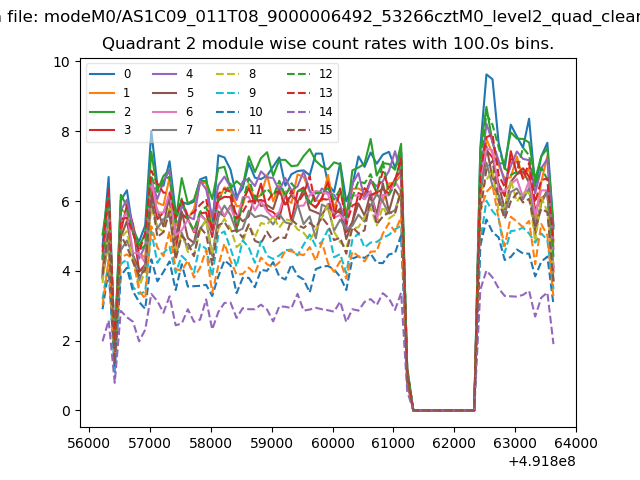
| Module-wise count rates for Quadrant B Data is divided into 100 sec bins |
 |
 |
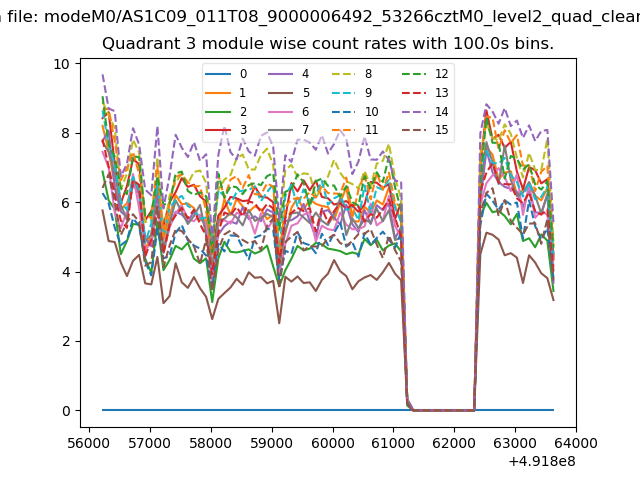
| Module-wise count rates for Quadrant C Data is divided into 100 sec bins |
 |
 |
| Module-wise count rates for Quadrant D Data is divided into 100 sec bins |
 |
 |
| Parameter | Plot |
|---|---|
| CZT HV Monitor | 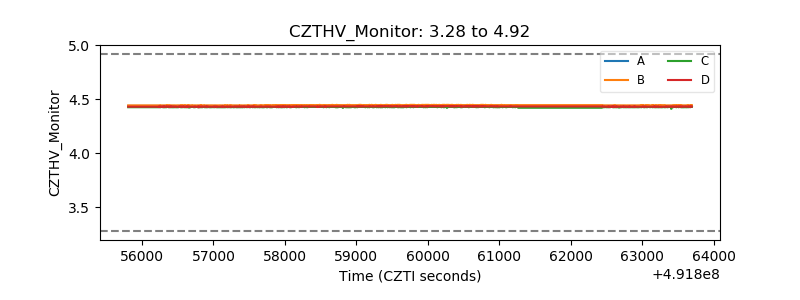 |
| D_VDD | 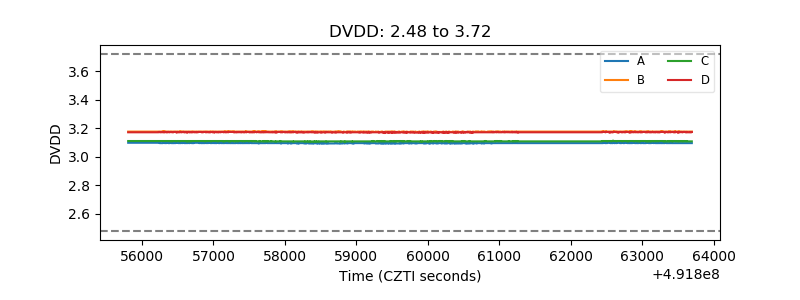 |
| Temperature 1 | 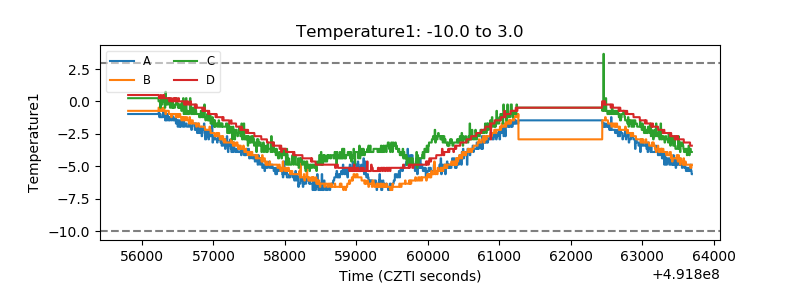 |
| Veto HV Monitor |  |
| Veto LLD | 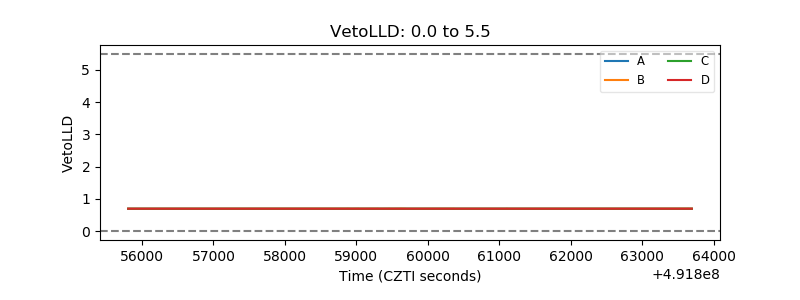 |
| Alpha Counter | 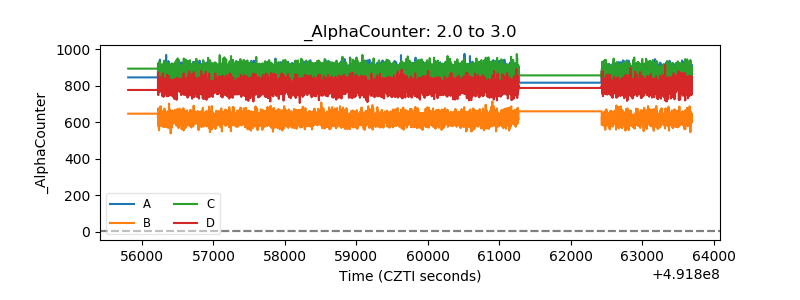 |
| _CPM_Rate | 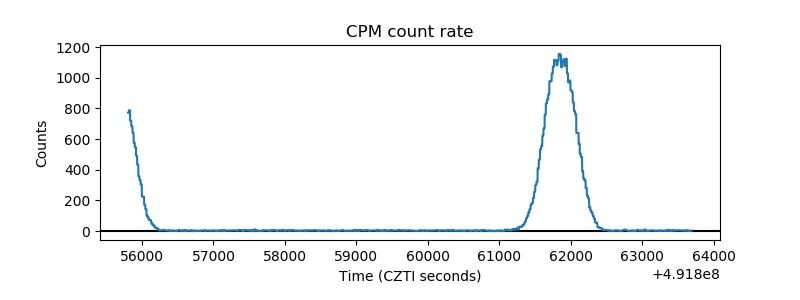 |
| CZT Counter | 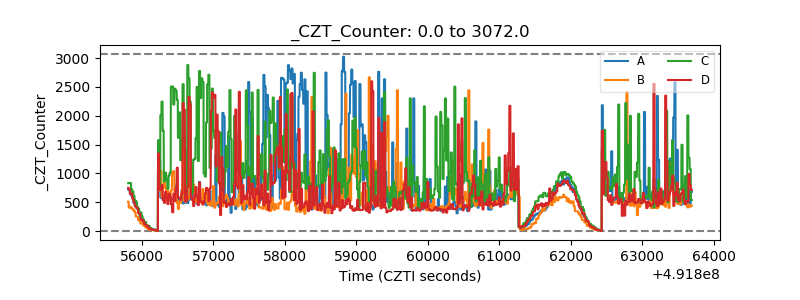 |
| +2.5 Volts monitor | 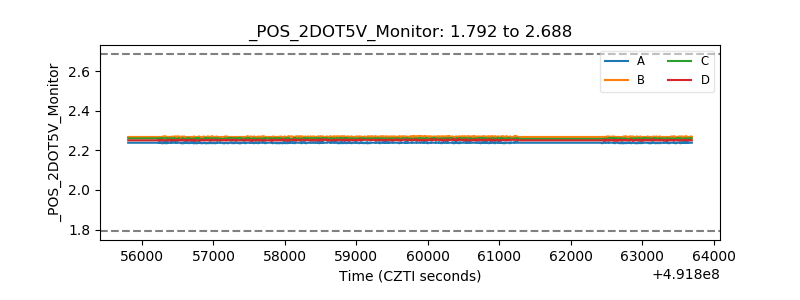 |
| +5 Volts monitor |  |
| _ROLL_ROT | 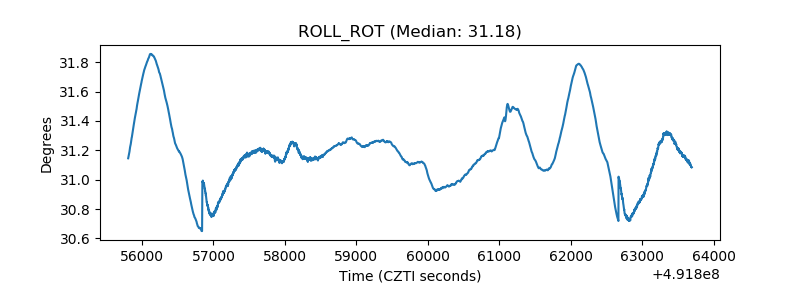 |
| _Roll_DEC | 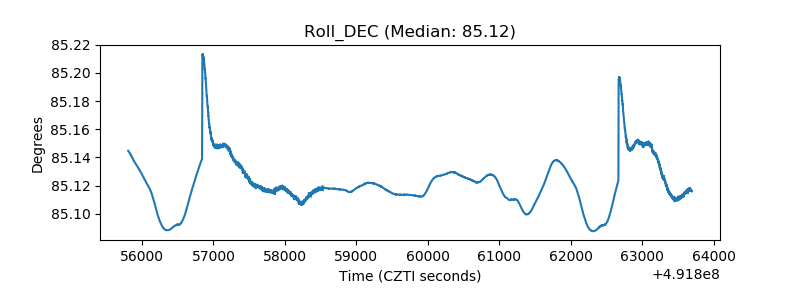 |
| _Roll_RA | 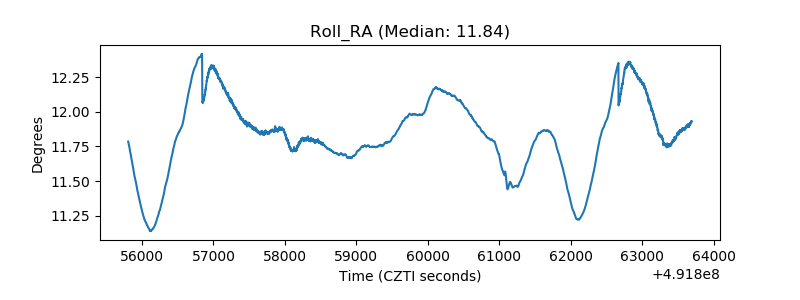 |
| Veto Counter | 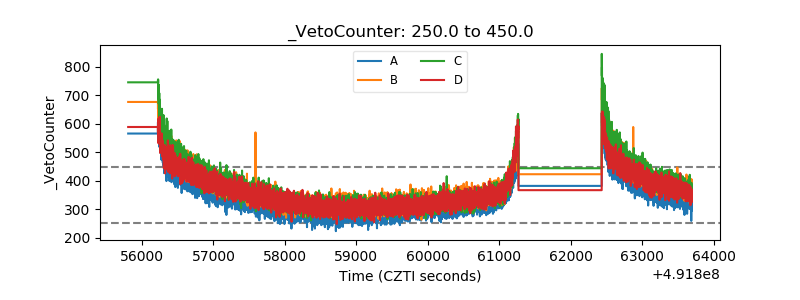 |