| Param | Original file | Final file |
|---|---|---|
| Filename | modeM0/AS1C09_011T08_9000006492_53267cztM0_level2.fits | modeM0/AS1C09_011T08_9000006492_53267cztM0_level2_quad_clean.evt |
| Size (bytes) | 578,154,240 | 90,806,400 |
| Size | 551.4 MB | 86.6 MB |
| Events in quadrant A | 5,005,506 | 587,124 |
| Events in quadrant B | 3,546,879 | 670,777 |
| Events in quadrant C | 6,387,213 | 556,293 |
| Events in quadrant D | 5,978,447 | 499,658 |
| Mode M0 | |||
|---|---|---|---|
| Quadrant | BADHDUFLAG | Total packets | Discarded packets |
| A | 0 | 19260 | 2 |
| B | 0 | 14810 | 2 |
| C | 0 | 23318 | 2 |
| D | 0 | 22057 | 2 |
| Mode M9 | |||
|---|---|---|---|
| Quadrant | BADHDUFLAG | Total packets | Discarded packets |
| A | 0 | 21 | 0 |
| B | 0 | 21 | 0 |
| C | 0 | 22 | 0 |
| D | 0 | 22 | 0 |
| Mode SS | |||
|---|---|---|---|
| Quadrant | BADHDUFLAG | Total packets | Discarded packets |
| A | 0 | 128 | 0 |
| B | 0 | 128 | 0 |
| C | 0 | 128 | 0 |
| D | 0 | 128 | 0 |
| Quadrant | Total seconds | Saturated seconds | Saturation percentage |
|---|---|---|---|
| A | 6234 | 503 | 8.068656% |
| B | 6234 | 165 | 2.646776% |
| C | 6234 | 748 | 11.998717% |
| D | 6234 | 959 | 15.383381% |
Noise dominated data is calculated using 1-second bins in cleaned event files. If a bin has >2000 counts, and if more than 50% of those come from <1% of pixels, then it is considered to be noise-dominated and hence unusable.
| Quadrant | # 1 sec bins | Bins with >0 counts | Bins with >2000 counts | High rate bins dominated by noise | Noise dominated (total time) | Noise dominated (detector-on time) | Marked lightcurve |
|---|---|---|---|---|---|---|---|
| A | 7514 | 6235 | 412 | 412 | 5.48% | 6.61% | 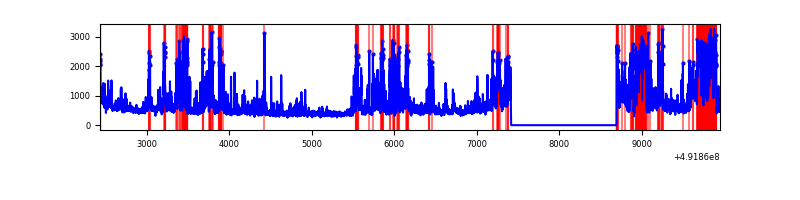 |
| B | 7514 | 6235 | 105 | 105 | 1.40% | 1.68% | 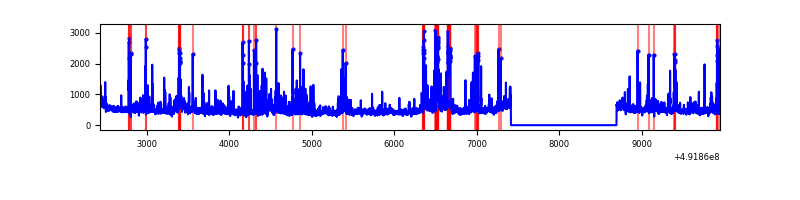 |
| C | 7514 | 6235 | 716 | 716 | 9.53% | 11.48% | 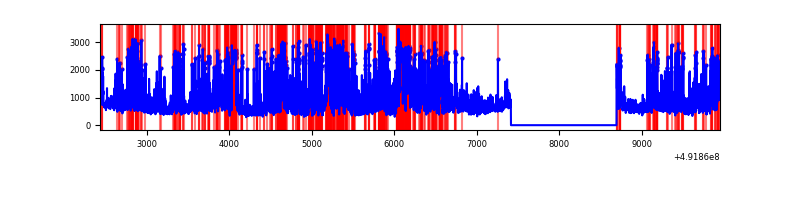 |
| D | 7514 | 6234 | 896 | 896 | 11.92% | 14.37% | 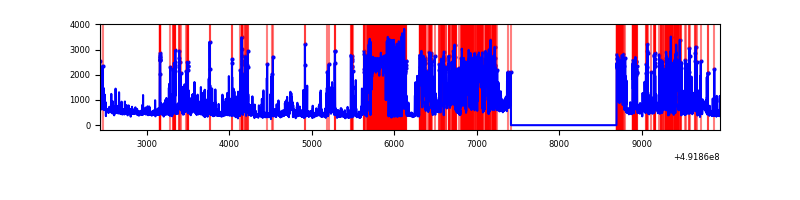 |
Top three noisy pixels from each quadrant. If the there are fewer than three noisy pixels in the level2.evt file, extra rows are filled as -1
| Pixel properties | Quadrant properties | ||||||
|---|---|---|---|---|---|---|---|
| Quadrant | DetID | PixID | Counts | Sigma | Mean | Median | Sigma |
| A | 3 | 62 | 1021903 | 6389.24 | 643 | 628 | 159.8 |
| A | 3 | 27 | 927000 | 5795.51 | 643 | 628 | 159.8 |
| A | 15 | 174 | 78273 | 485.76 | 643 | 628 | 159.8 |
| B | 4 | 81 | 231922 | 1657.7 | 660 | 638 | 139.5 |
| B | 2 | 249 | 218243 | 1559.66 | 660 | 638 | 139.5 |
| B | 4 | 171 | 145038 | 1034.97 | 660 | 638 | 139.5 |
| C | 15 | 224 | 968093 | 5514.08 | 629 | 622 | 175.5 |
| C | 0 | 240 | 948186 | 5400.62 | 629 | 622 | 175.5 |
| C | 10 | 22 | 783470 | 4461.82 | 629 | 622 | 175.5 |
| D | 13 | 170 | 1527075 | 8842.08 | 603 | 576 | 172.6 |
| D | 12 | 3 | 1297021 | 7509.51 | 603 | 576 | 172.6 |
| D | 12 | 128 | 278193 | 1608.07 | 603 | 576 | 172.6 |
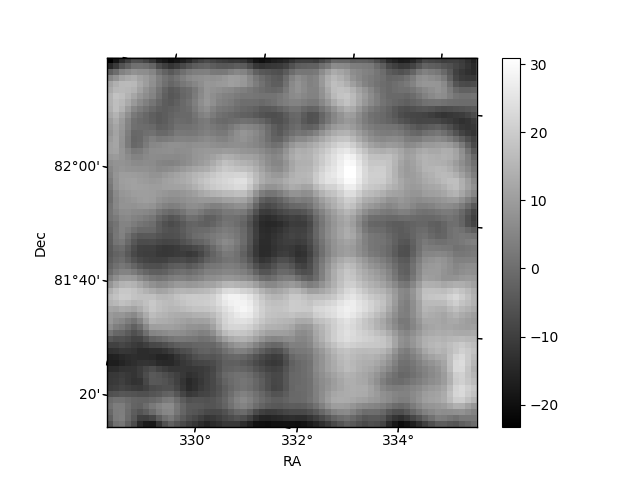
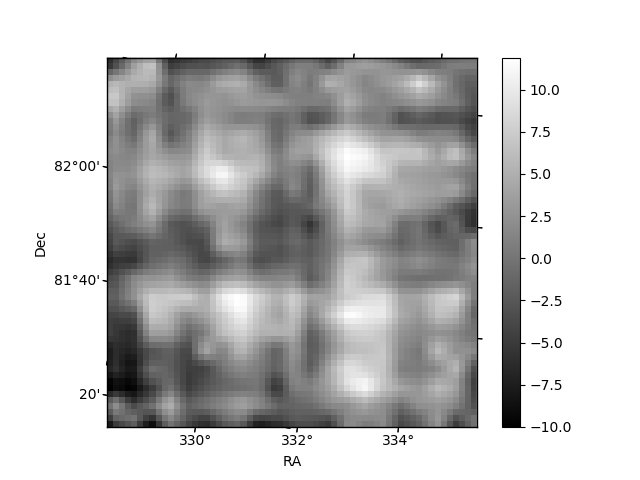
Histogram calculated using DETX and DETY for each event in the final _common_clean file
| Quadrant A | 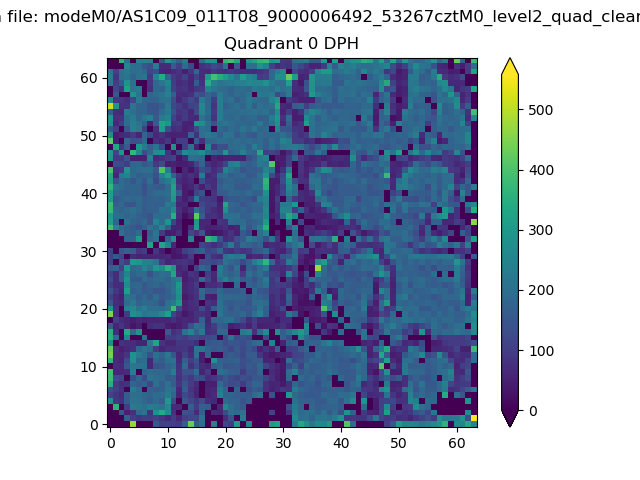 |
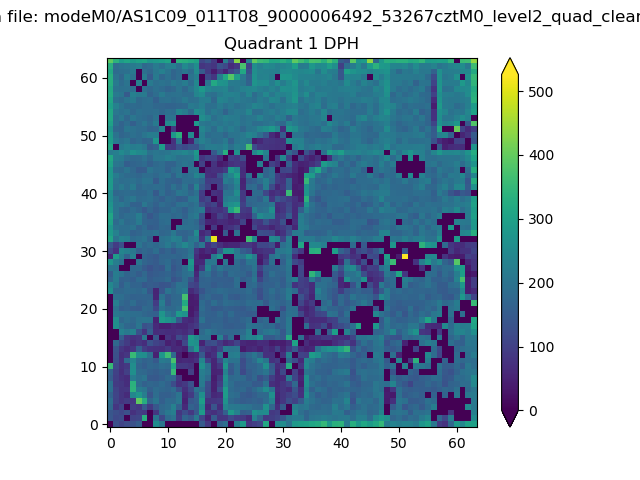 |
Quadrant B |
|---|---|---|---|
| Quadrant D | 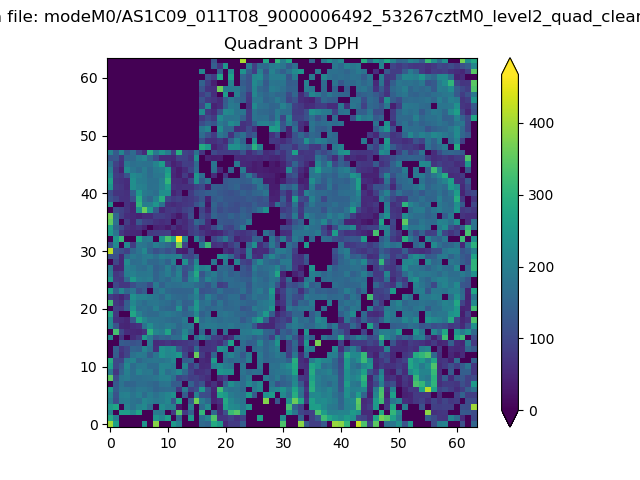 |
 |
Quadrant C |
| Plot type | Count rate plots | Images |
|---|---|---|
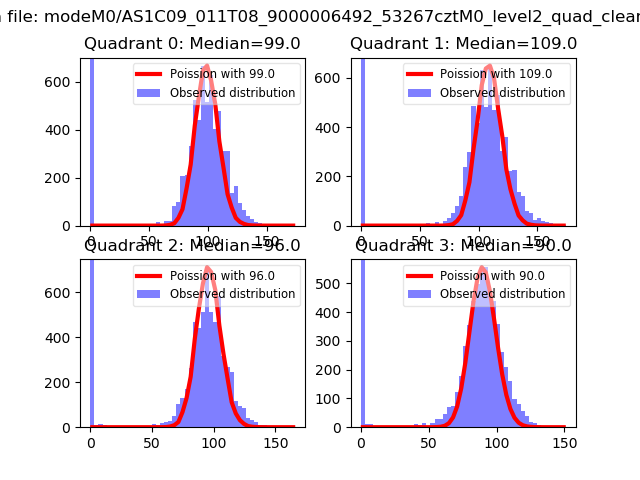
| Comparison with Poisson distribution Blue bars denote a histogram of data divided into 1 sec bins. Red curve is a Poisson curve with rate = median count rate of data. |
 |
 |
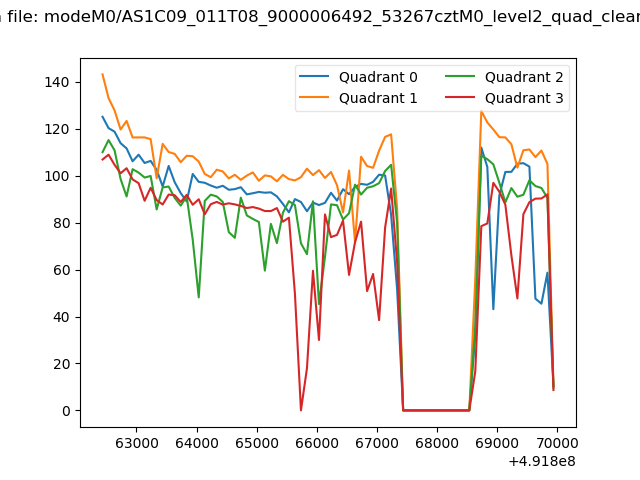
| Quadrant-wise count rates Data is divided into 100 sec bins |
 |
|
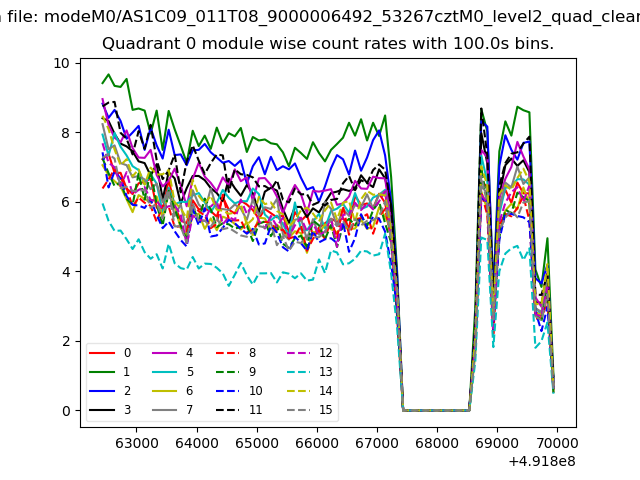
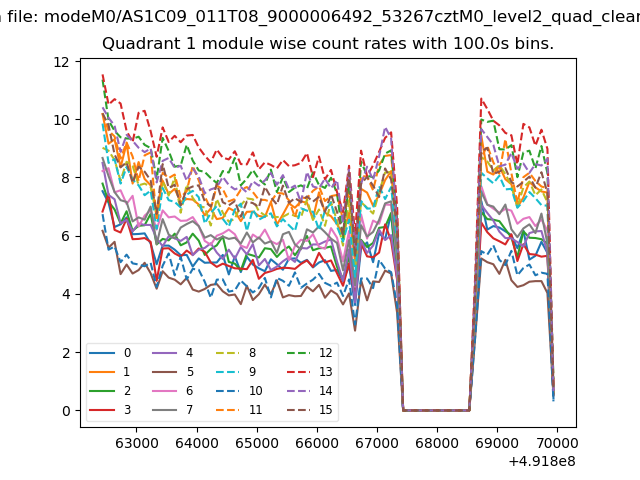
| Module-wise count rates for Quadrant A Data is divided into 100 sec bins |
 |
 |
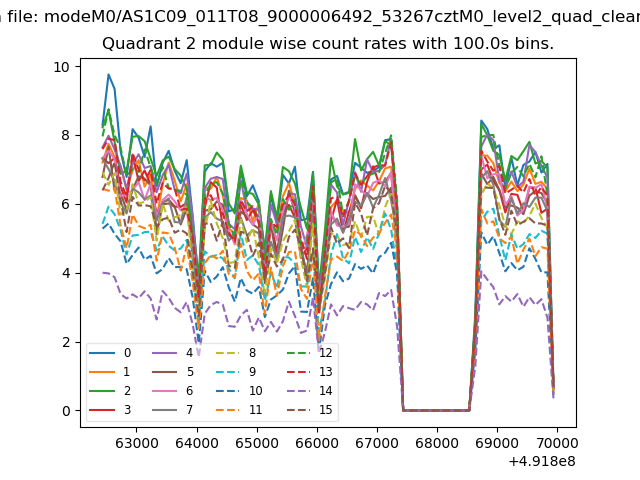
| Module-wise count rates for Quadrant B Data is divided into 100 sec bins |
 |
 |
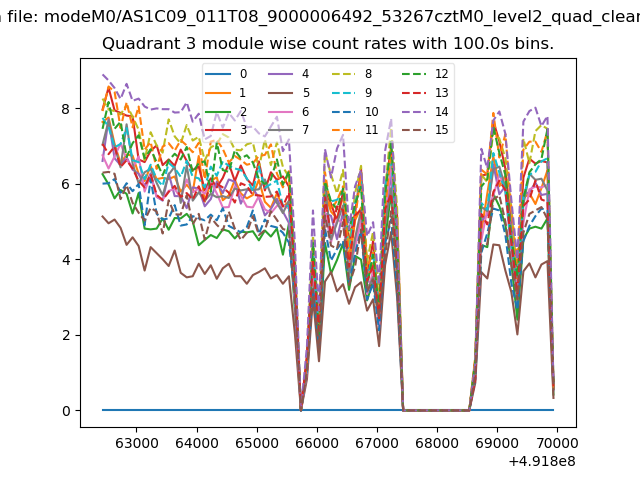
| Module-wise count rates for Quadrant C Data is divided into 100 sec bins |
 |
 |
| Module-wise count rates for Quadrant D Data is divided into 100 sec bins |
 |
 |
| Parameter | Plot |
|---|---|
| CZT HV Monitor | 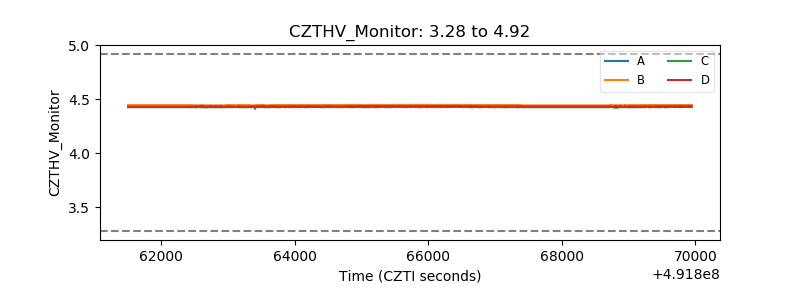 |
| D_VDD | 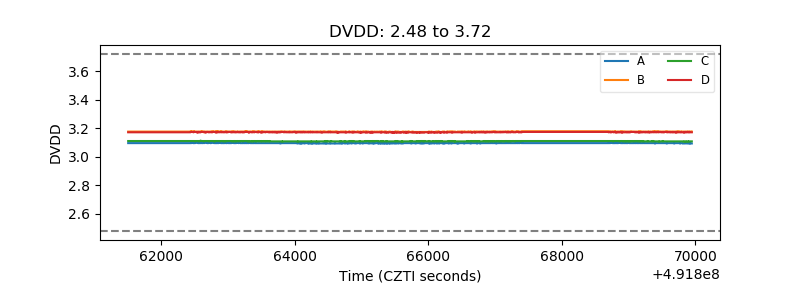 |
| Temperature 1 | 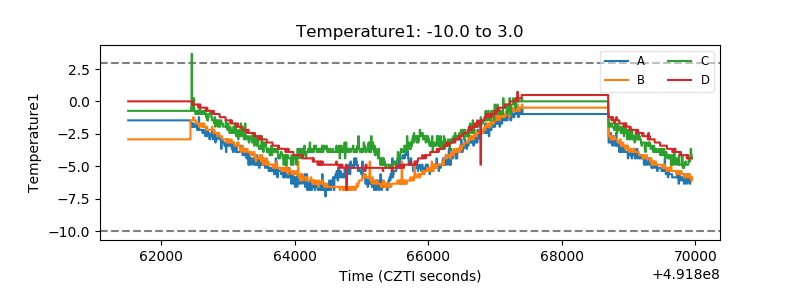 |
| Veto HV Monitor | 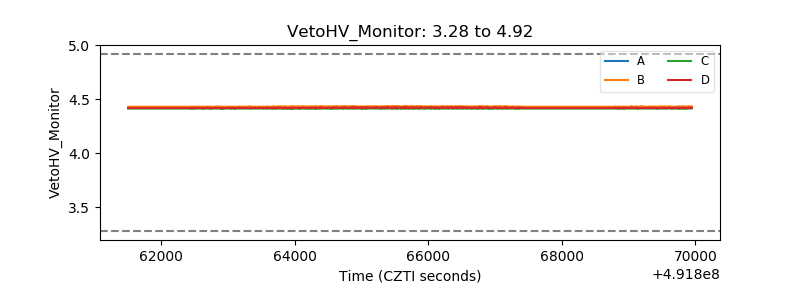 |
| Veto LLD | 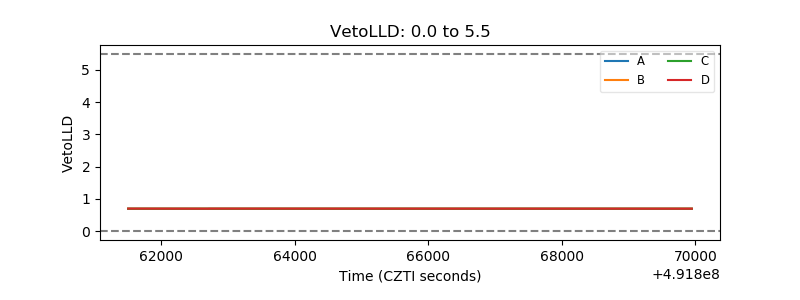 |
| Alpha Counter | 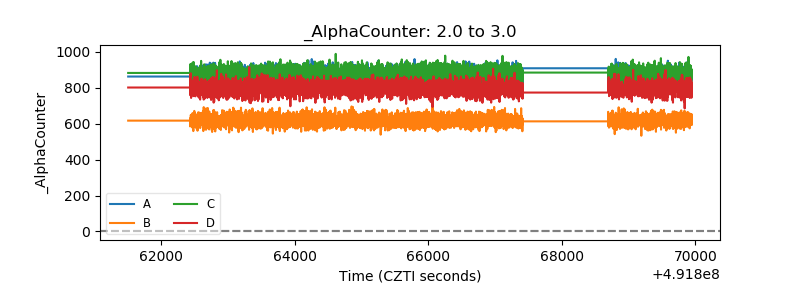 |
| _CPM_Rate | 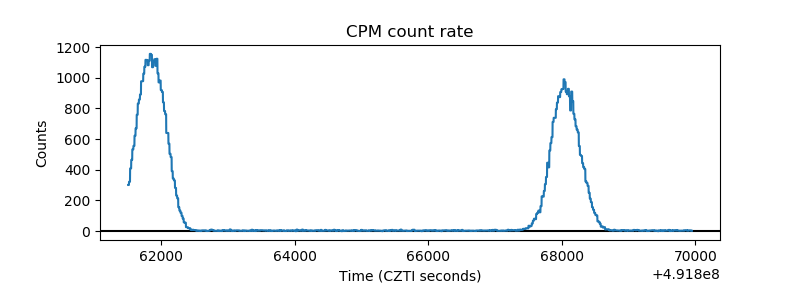 |
| CZT Counter | 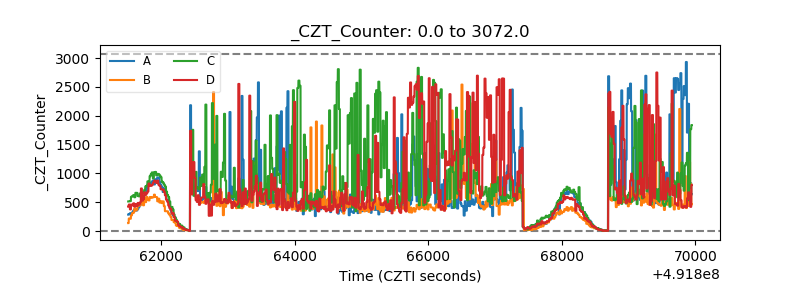 |
| +2.5 Volts monitor |  |
| +5 Volts monitor |  |
| _ROLL_ROT |  |
| _Roll_DEC | 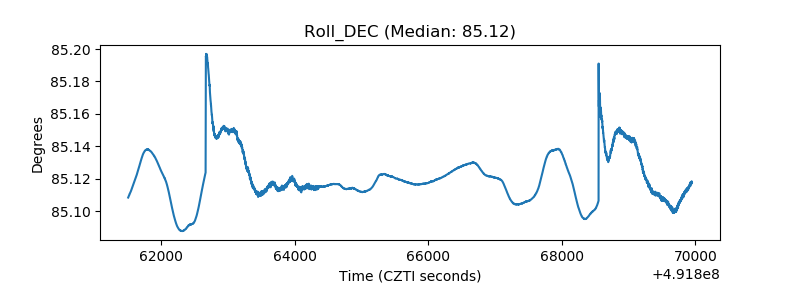 |
| _Roll_RA | 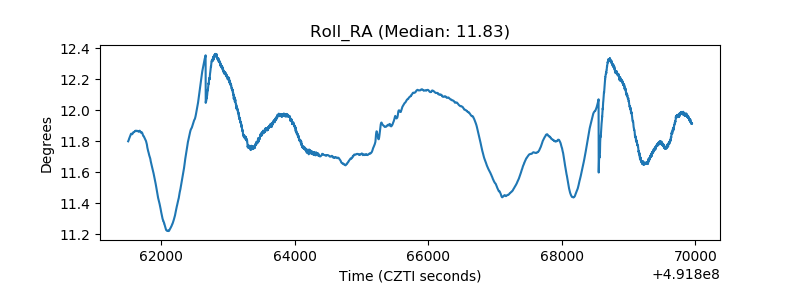 |
| Veto Counter | 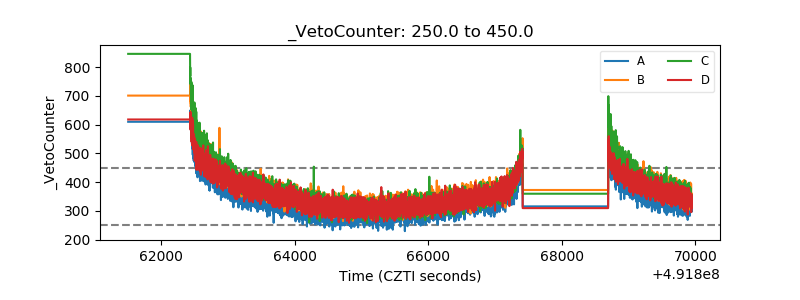 |