| Param | Original file | Final file |
|---|---|---|
| Filename | modeM0/AS1C09_011T08_9000006492_53269cztM0_level2.fits | modeM0/AS1C09_011T08_9000006492_53269cztM0_level2_quad_clean.evt |
| Size (bytes) | 659,937,600 | 94,276,800 |
| Size | 629.4 MB | 89.9 MB |
| Events in quadrant A | 4,602,486 | 644,826 |
| Events in quadrant B | 5,460,274 | 663,910 |
| Events in quadrant C | 9,894,638 | 471,589 |
| Events in quadrant D | 3,938,081 | 594,656 |
| Mode M0 | |||
|---|---|---|---|
| Quadrant | BADHDUFLAG | Total packets | Discarded packets |
| A | 0 | 18509 | 2 |
| B | 0 | 21097 | 2 |
| C | 0 | 34171 | 2 |
| D | 0 | 16904 | 2 |
| Mode M9 | |||
|---|---|---|---|
| Quadrant | BADHDUFLAG | Total packets | Discarded packets |
| A | 0 | 19 | 0 |
| B | 0 | 20 | 0 |
| C | 0 | 20 | 0 |
| D | 0 | 20 | 0 |
| Mode SS | |||
|---|---|---|---|
| Quadrant | BADHDUFLAG | Total packets | Discarded packets |
| A | 0 | 140 | 0 |
| B | 0 | 140 | 0 |
| C | 0 | 140 | 0 |
| D | 0 | 140 | 0 |
| Quadrant | Total seconds | Saturated seconds | Saturation percentage |
|---|---|---|---|
| A | 6881 | 240 | 3.487865% |
| B | 6881 | 579 | 8.414475% |
| C | 6881 | 2099 | 30.504287% |
| D | 6881 | 133 | 1.932859% |
Noise dominated data is calculated using 1-second bins in cleaned event files. If a bin has >2000 counts, and if more than 50% of those come from <1% of pixels, then it is considered to be noise-dominated and hence unusable.
| Quadrant | # 1 sec bins | Bins with >0 counts | Bins with >2000 counts | High rate bins dominated by noise | Noise dominated (total time) | Noise dominated (detector-on time) | Marked lightcurve |
|---|---|---|---|---|---|---|---|
| A | 7901 | 6882 | 225 | 225 | 2.85% | 3.27% | 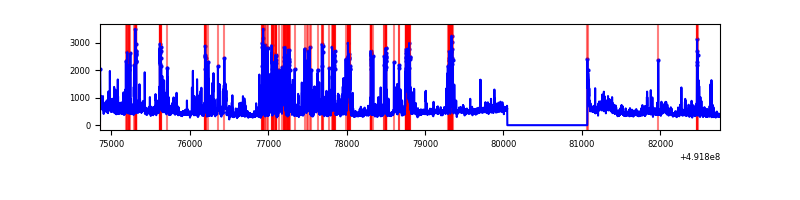 |
| B | 7901 | 6882 | 320 | 320 | 4.05% | 4.65% | 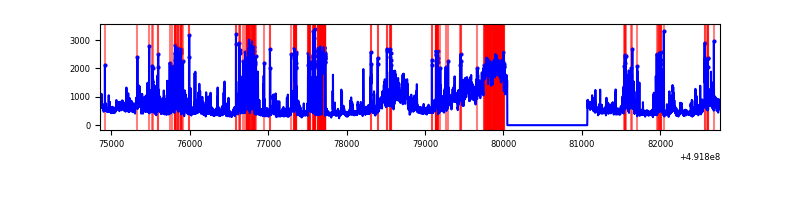 |
| C | 7901 | 6881 | 1917 | 1917 | 24.26% | 27.86% | 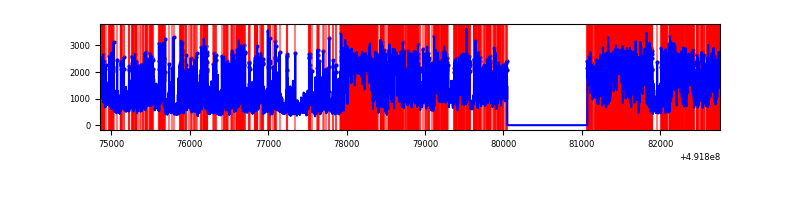 |
| D | 7901 | 6882 | 126 | 126 | 1.59% | 1.83% | 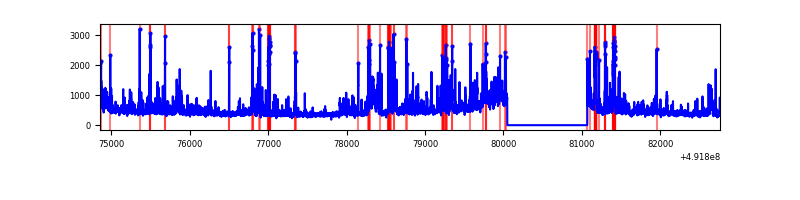 |
Top three noisy pixels from each quadrant. If the there are fewer than three noisy pixels in the level2.evt file, extra rows are filled as -1
| Pixel properties | Quadrant properties | ||||||
|---|---|---|---|---|---|---|---|
| Quadrant | DetID | PixID | Counts | Sigma | Mean | Median | Sigma |
| A | 3 | 27 | 792352 | 4580.1 | 695 | 678 | 172.9 |
| A | 3 | 62 | 546551 | 3158.06 | 695 | 678 | 172.9 |
| A | 12 | 80 | 143515 | 826.36 | 695 | 678 | 172.9 |
| B | 10 | 254 | 1272249 | 8651.6 | 688 | 664 | 147.0 |
| B | 4 | 171 | 492919 | 3349.2 | 688 | 664 | 147.0 |
| B | 2 | 249 | 360436 | 2447.81 | 688 | 664 | 147.0 |
| C | 10 | 22 | 1801481 | 10865.53 | 602 | 596 | 165.7 |
| C | 15 | 224 | 1479352 | 8921.99 | 602 | 596 | 165.7 |
| C | 13 | 3 | 1454072 | 8769.46 | 602 | 596 | 165.7 |
| D | 2 | 249 | 276165 | 1418.05 | 678 | 647 | 194.3 |
| D | 12 | 3 | 248266 | 1274.45 | 678 | 647 | 194.3 |
| D | 6 | 42 | 163950 | 840.49 | 678 | 647 | 194.3 |
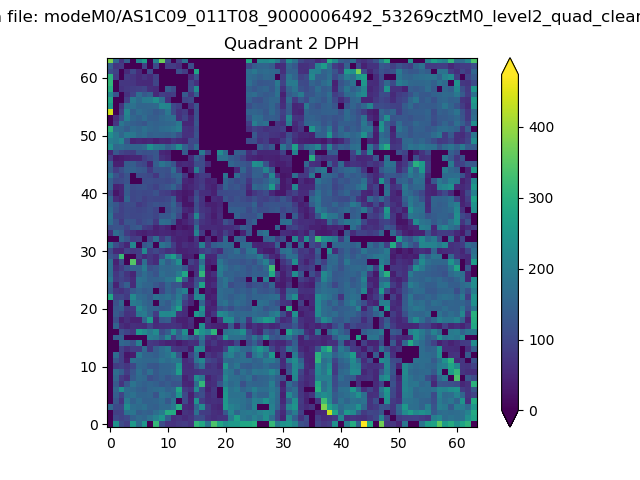
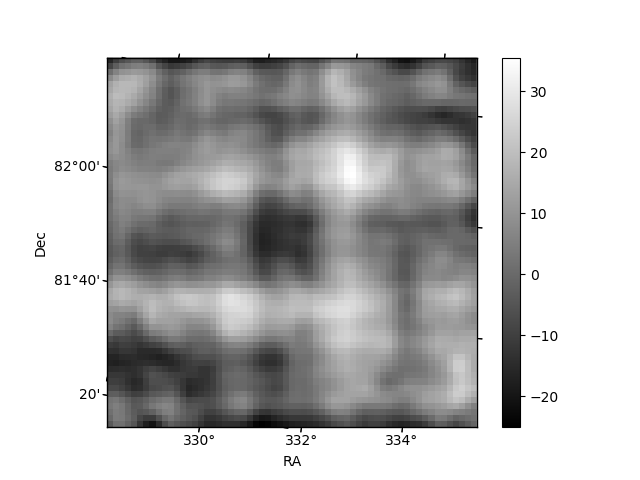
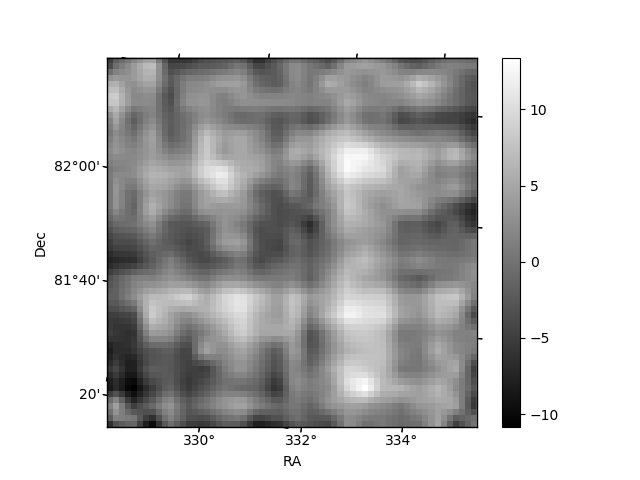
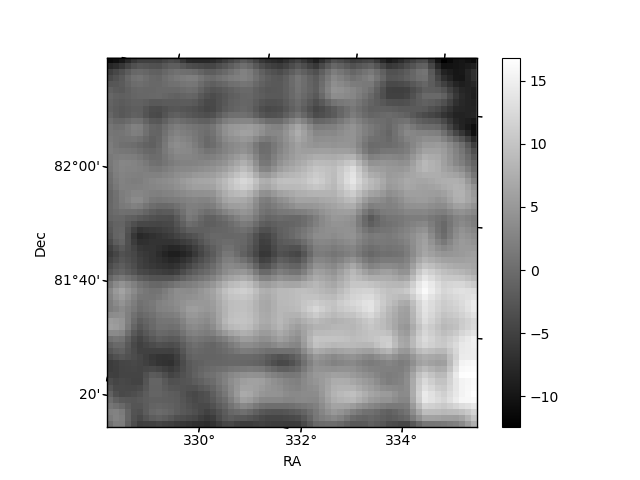
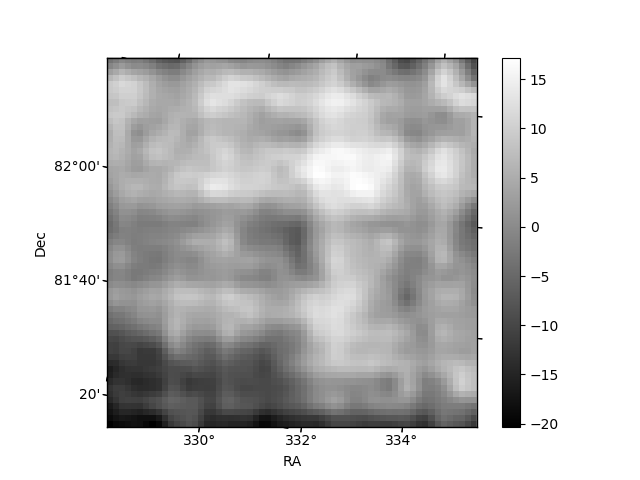
Histogram calculated using DETX and DETY for each event in the final _common_clean file
| Quadrant A | 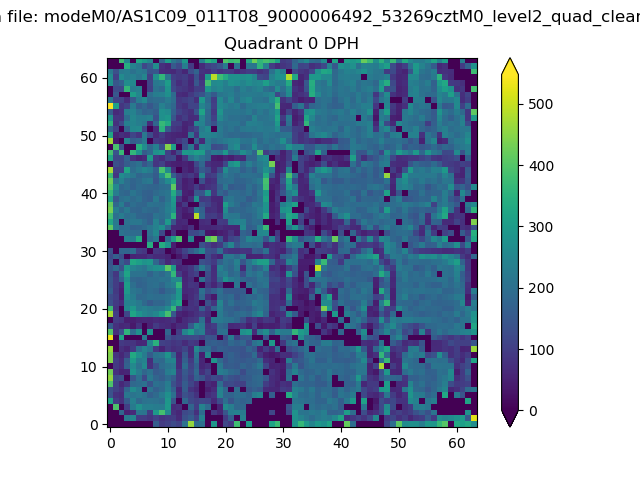 |
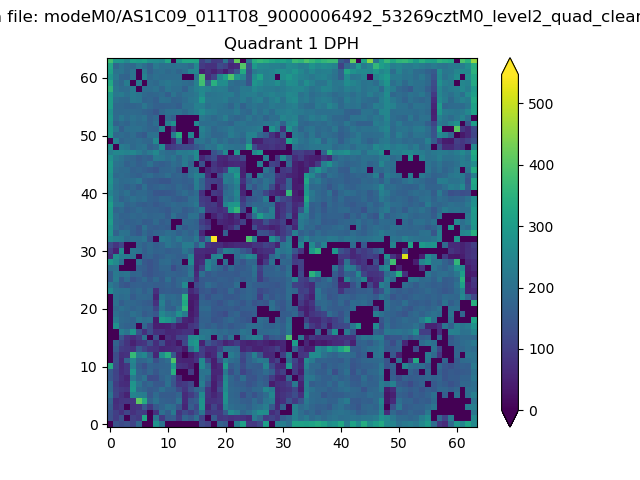 |
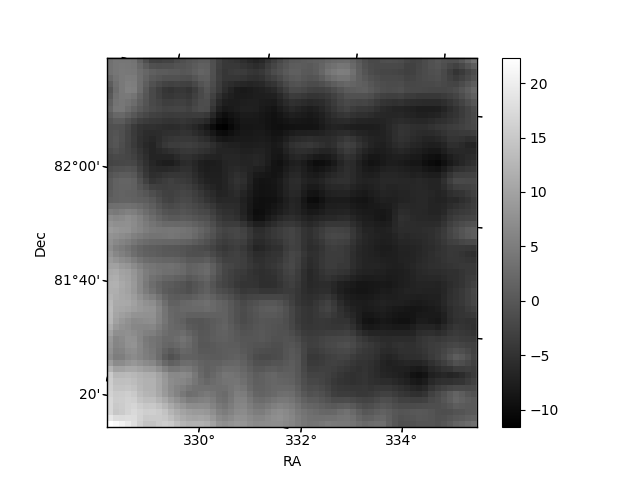
Quadrant B |
|---|---|---|---|
| Quadrant D | 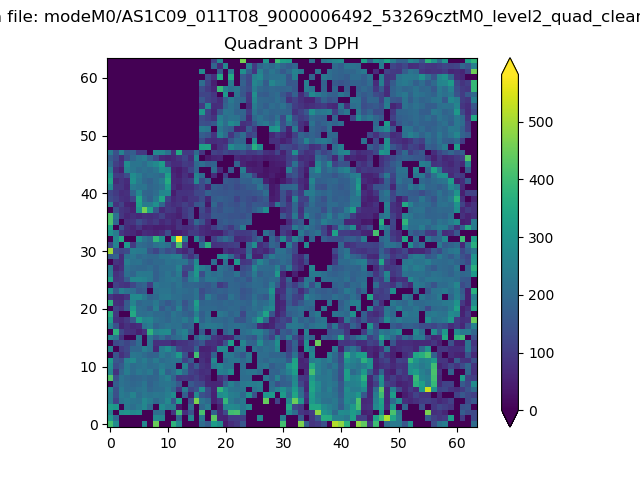 |
 |
Quadrant C |
| Plot type | Count rate plots | Images |
|---|---|---|
| Comparison with Poisson distribution Blue bars denote a histogram of data divided into 1 sec bins. Red curve is a Poisson curve with rate = median count rate of data. |
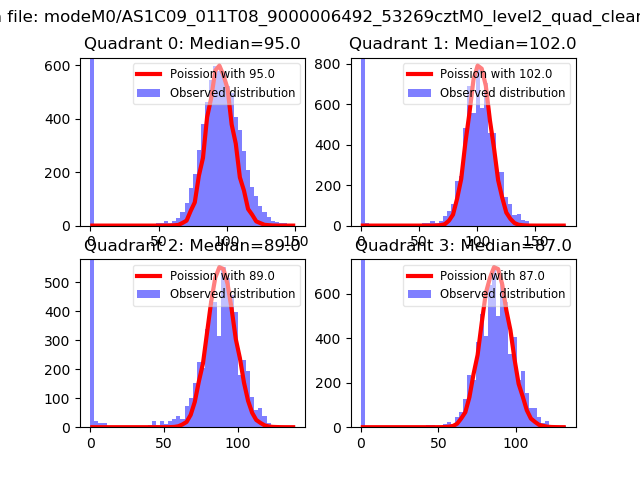 |
 |
| Quadrant-wise count rates Data is divided into 100 sec bins |
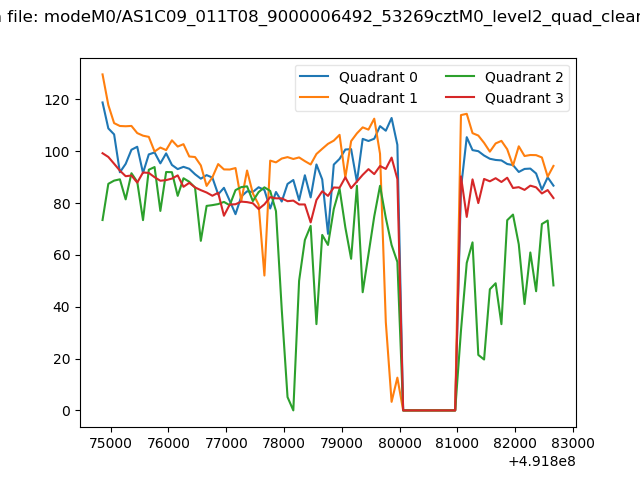 |
|
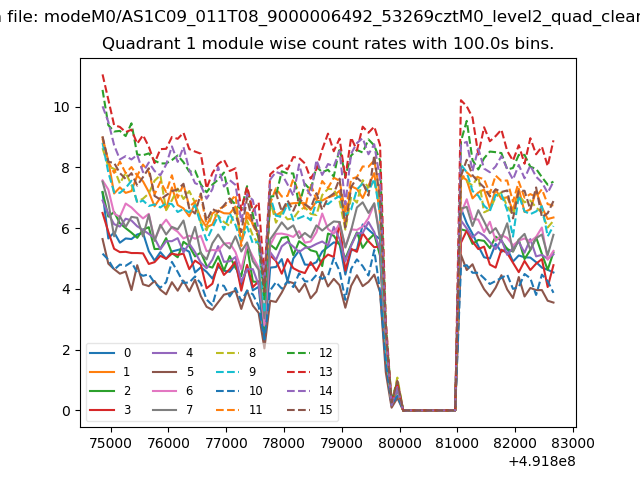
| Module-wise count rates for Quadrant A Data is divided into 100 sec bins |
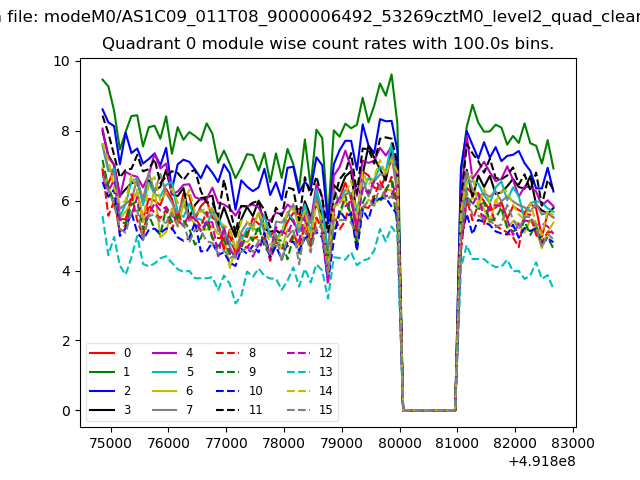 |
 |
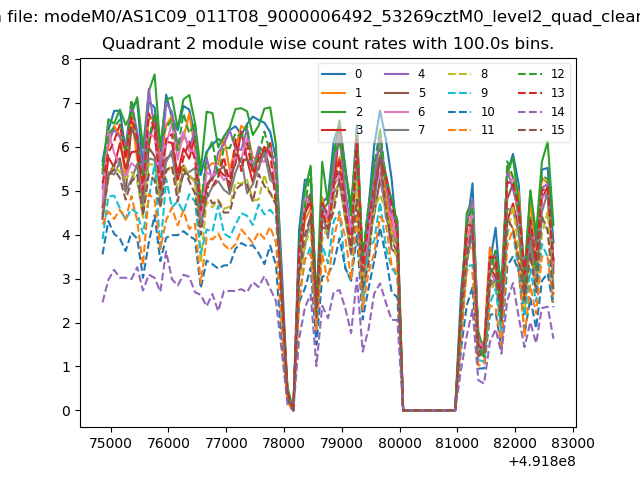
| Module-wise count rates for Quadrant B Data is divided into 100 sec bins |
 |
 |
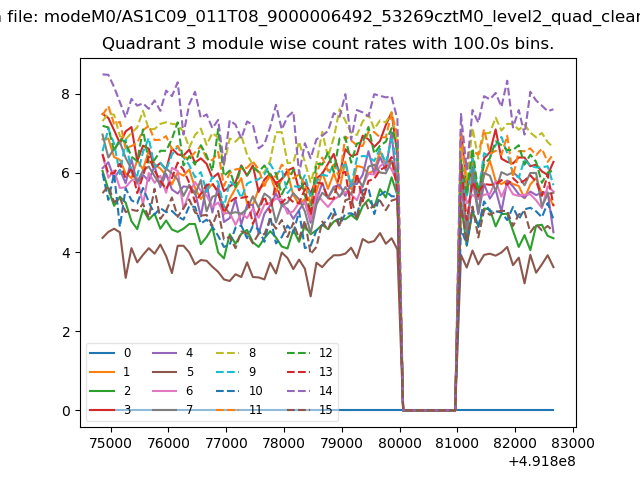
| Module-wise count rates for Quadrant C Data is divided into 100 sec bins |
 |
 |
| Module-wise count rates for Quadrant D Data is divided into 100 sec bins |
 |
 |
| Parameter | Plot |
|---|---|
| CZT HV Monitor | 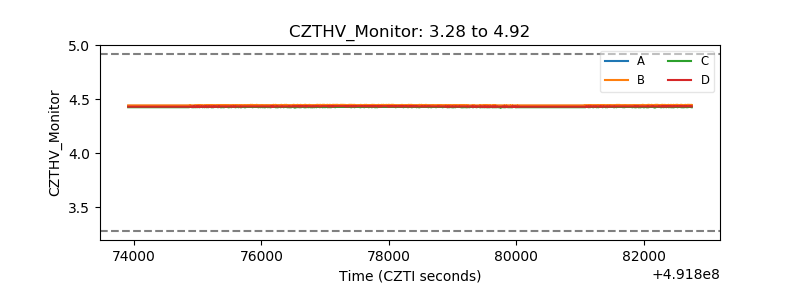 |
| D_VDD | 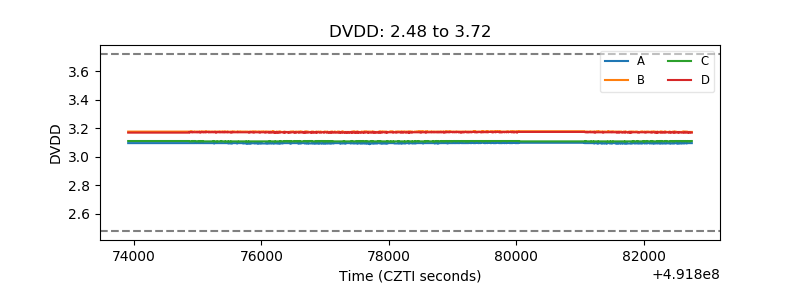 |
| Temperature 1 | 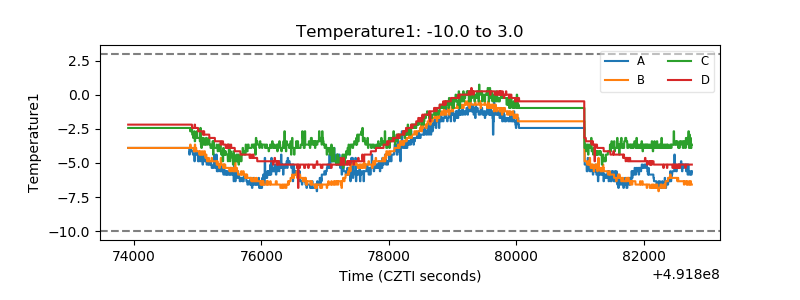 |
| Veto HV Monitor | 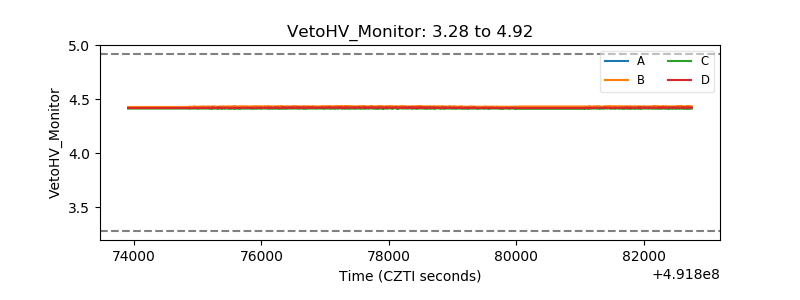 |
| Veto LLD | 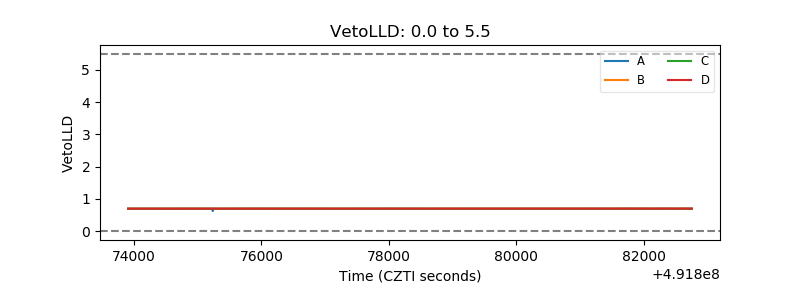 |
| Alpha Counter | 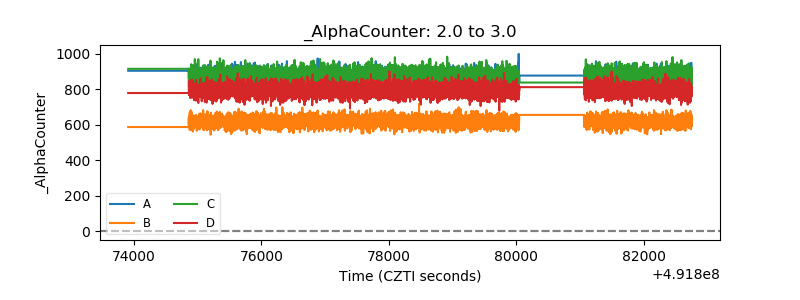 |
| _CPM_Rate | 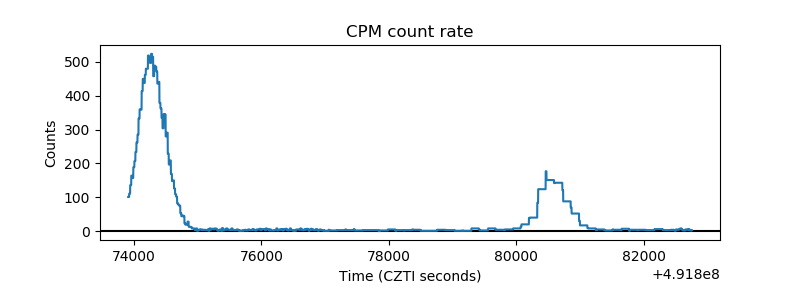 |
| CZT Counter | 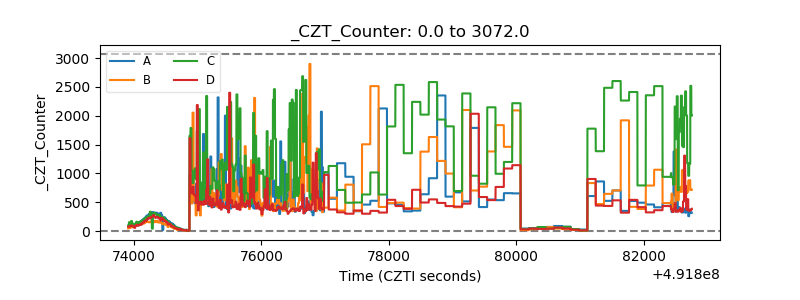 |
| +2.5 Volts monitor |  |
| +5 Volts monitor |  |
| _ROLL_ROT | 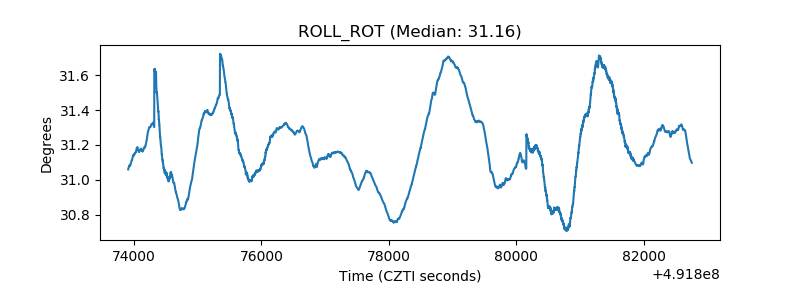 |
| _Roll_DEC | 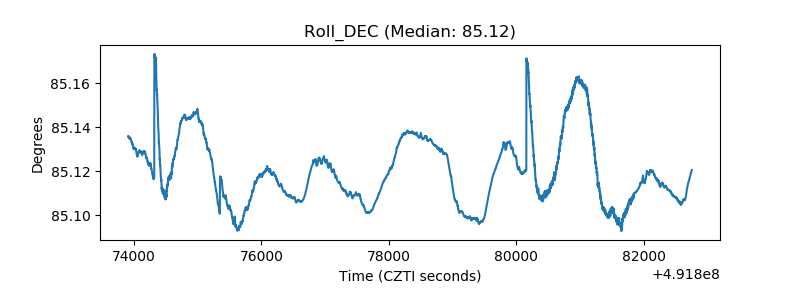 |
| _Roll_RA | 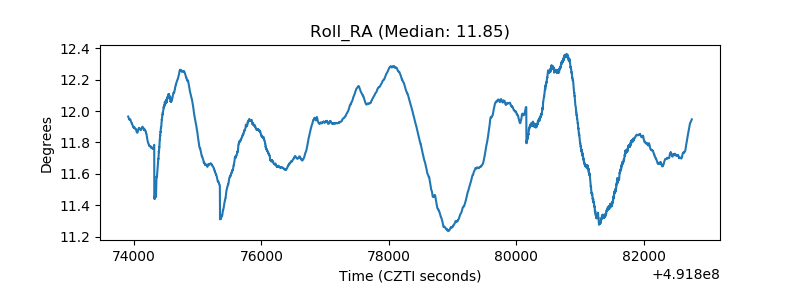 |
| Veto Counter | 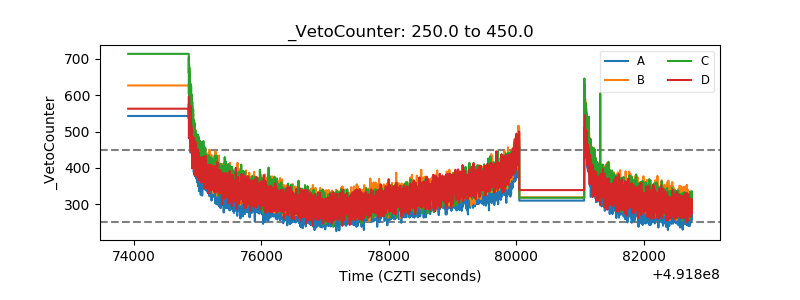 |