| Param | Original file | Final file |
|---|---|---|
| Filename | modeM0/AS1C09_011T08_9000006492_53270cztM0_level2.fits | modeM0/AS1C09_011T08_9000006492_53270cztM0_level2_quad_clean.evt |
| Size (bytes) | 694,546,560 | 95,212,800 |
| Size | 662.4 MB | 90.8 MB |
| Events in quadrant A | 4,508,088 | 660,341 |
| Events in quadrant B | 5,923,050 | 678,500 |
| Events in quadrant C | 10,303,255 | 465,976 |
| Events in quadrant D | 4,419,697 | 578,216 |
| Mode M0 | |||
|---|---|---|---|
| Quadrant | BADHDUFLAG | Total packets | Discarded packets |
| A | 0 | 18535 | 1 |
| B | 0 | 22628 | 1 |
| C | 0 | 35669 | 1 |
| D | 0 | 18560 | 1 |
| Mode M9 | |||
|---|---|---|---|
| Quadrant | BADHDUFLAG | Total packets | Discarded packets |
| A | 0 | 6 | 0 |
| B | 0 | 6 | 0 |
| C | 0 | 6 | 0 |
| D | 0 | 6 | 0 |
| Mode SS | |||
|---|---|---|---|
| Quadrant | BADHDUFLAG | Total packets | Discarded packets |
| A | 0 | 146 | 0 |
| B | 0 | 146 | 0 |
| C | 0 | 146 | 0 |
| D | 0 | 146 | 0 |
| Quadrant | Total seconds | Saturated seconds | Saturation percentage |
|---|---|---|---|
| A | 7171 | 189 | 2.635616% |
| B | 7171 | 603 | 8.408869% |
| C | 7171 | 2312 | 32.240971% |
| D | 7172 | 444 | 6.190742% |
Noise dominated data is calculated using 1-second bins in cleaned event files. If a bin has >2000 counts, and if more than 50% of those come from <1% of pixels, then it is considered to be noise-dominated and hence unusable.
| Quadrant | # 1 sec bins | Bins with >0 counts | Bins with >2000 counts | High rate bins dominated by noise | Noise dominated (total time) | Noise dominated (detector-on time) | Marked lightcurve |
|---|---|---|---|---|---|---|---|
| A | 7781 | 7171 | 147 | 147 | 1.89% | 2.05% | 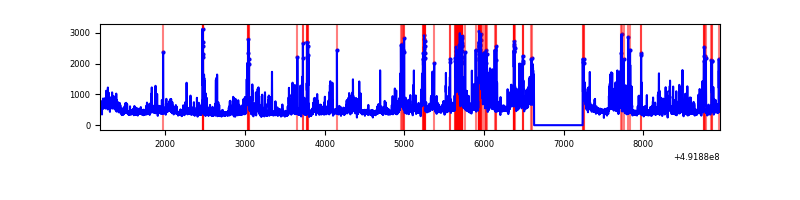 |
| B | 7781 | 7172 | 417 | 417 | 5.36% | 5.81% | 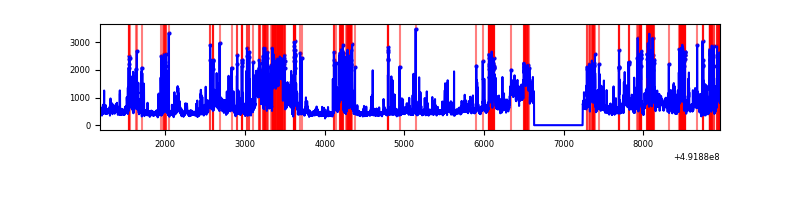 |
| C | 7781 | 7172 | 2168 | 2168 | 27.86% | 30.23% | 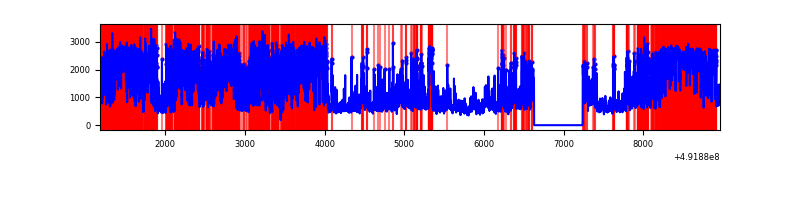 |
| D | 7782 | 7173 | 388 | 388 | 4.99% | 5.41% | 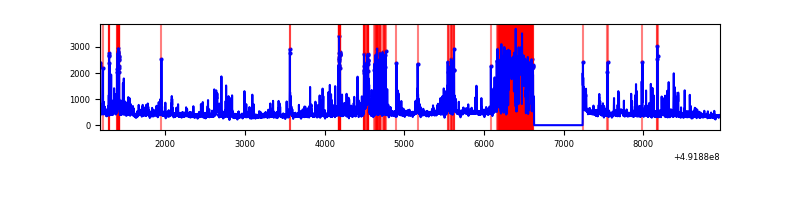 |
Top three noisy pixels from each quadrant. If the there are fewer than three noisy pixels in the level2.evt file, extra rows are filled as -1
| Pixel properties | Quadrant properties | ||||||
|---|---|---|---|---|---|---|---|
| Quadrant | DetID | PixID | Counts | Sigma | Mean | Median | Sigma |
| A | 3 | 62 | 704949 | 3935.1 | 724 | 706 | 179.0 |
| A | 3 | 27 | 502003 | 2801.1 | 724 | 706 | 179.0 |
| A | 12 | 80 | 89234 | 494.67 | 724 | 706 | 179.0 |
| B | 10 | 254 | 1380039 | 9122.24 | 709 | 685 | 151.2 |
| B | 2 | 249 | 629541 | 4158.88 | 709 | 685 | 151.2 |
| B | 4 | 81 | 522995 | 3454.25 | 709 | 685 | 151.2 |
| C | 10 | 22 | 2911227 | 16942.98 | 621 | 617 | 171.8 |
| C | 13 | 3 | 2077315 | 12088.69 | 621 | 617 | 171.8 |
| C | 15 | 224 | 1190915 | 6928.86 | 621 | 617 | 171.8 |
| D | 12 | 3 | 1026846 | 5264.36 | 675 | 643 | 194.9 |
| D | 1 | 0 | 121147 | 618.18 | 675 | 643 | 194.9 |
| D | 3 | 12 | 101527 | 517.53 | 675 | 643 | 194.9 |
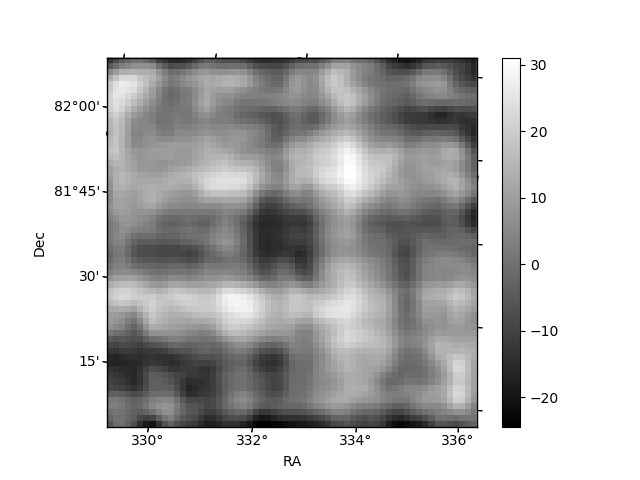
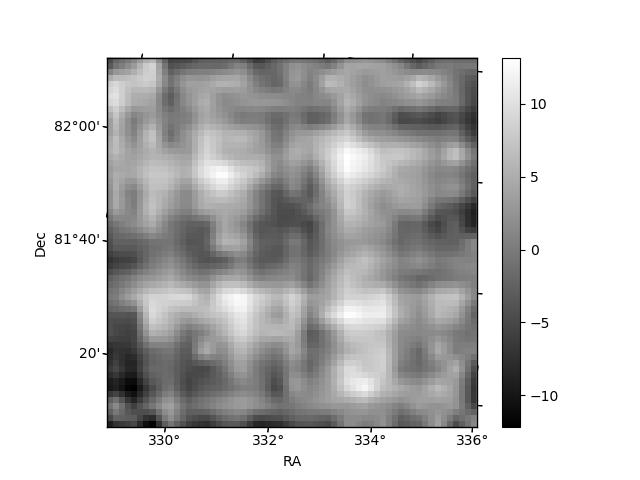
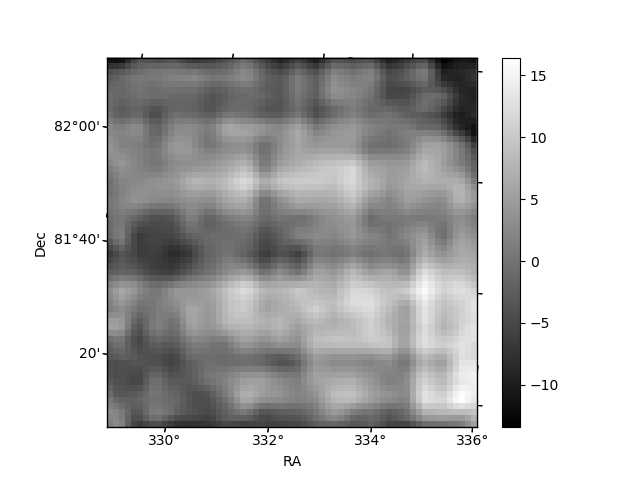
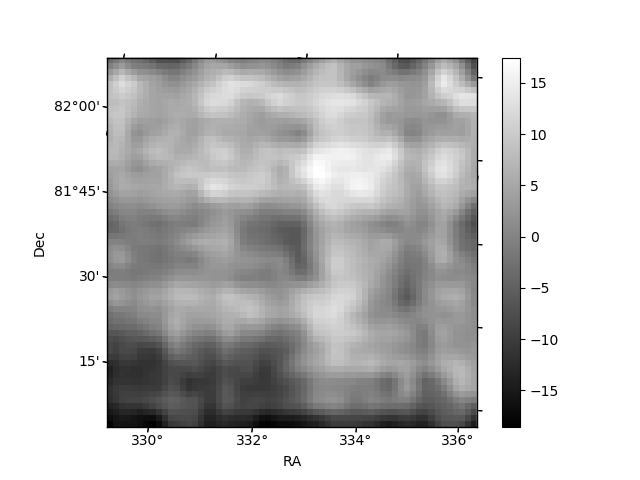
Histogram calculated using DETX and DETY for each event in the final _common_clean file
| Quadrant A | 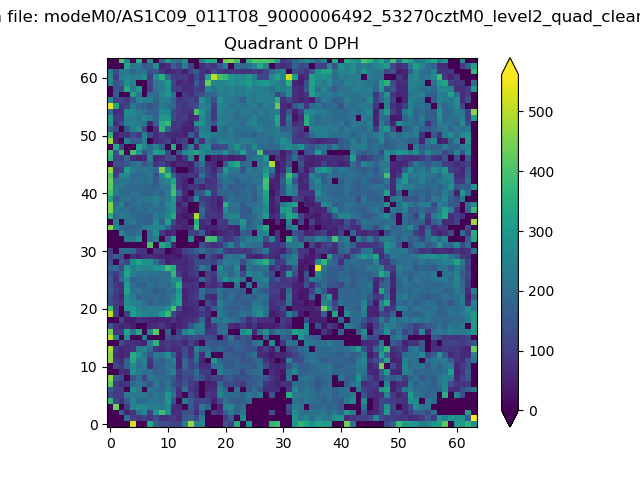 |
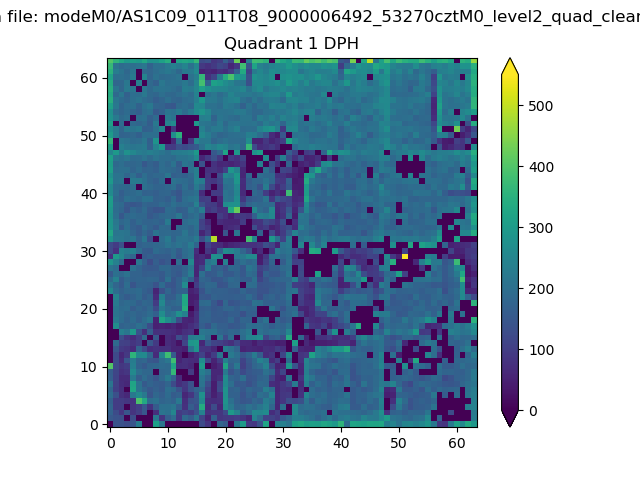 |
Quadrant B |
|---|---|---|---|
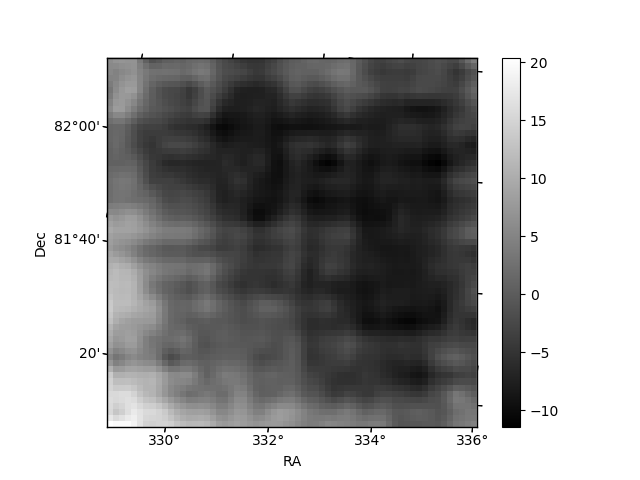
| Quadrant D | 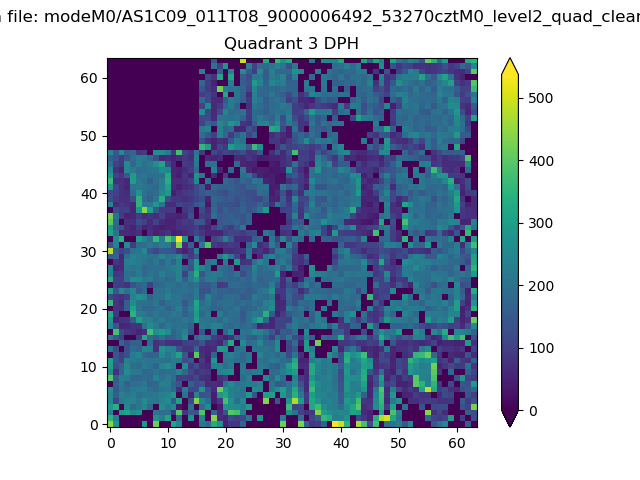 |
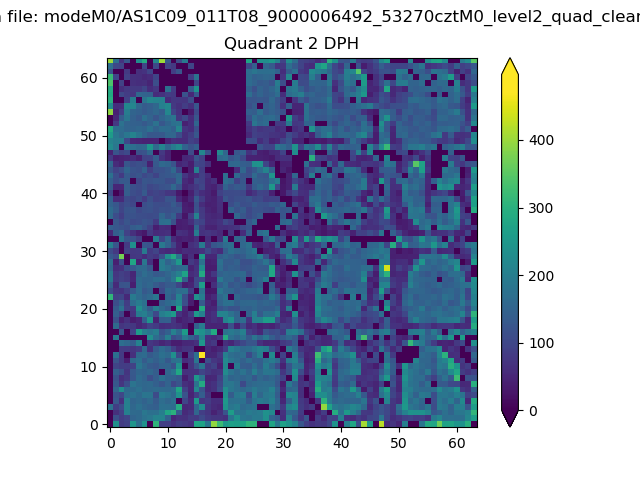 |
Quadrant C |
| Plot type | Count rate plots | Images |
|---|---|---|
| Comparison with Poisson distribution Blue bars denote a histogram of data divided into 1 sec bins. Red curve is a Poisson curve with rate = median count rate of data. |
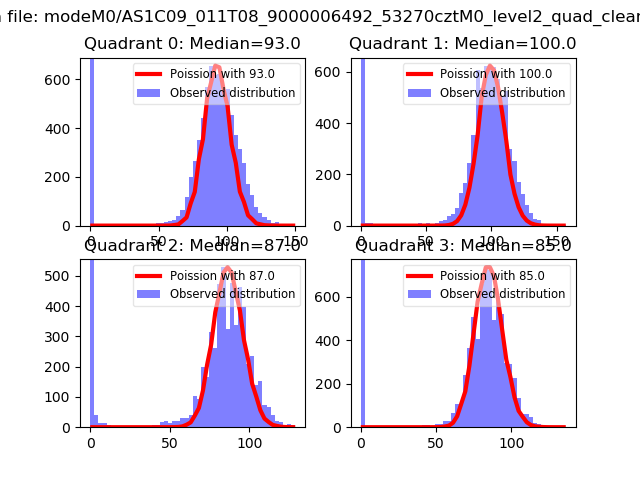 |
 |
| Quadrant-wise count rates Data is divided into 100 sec bins |
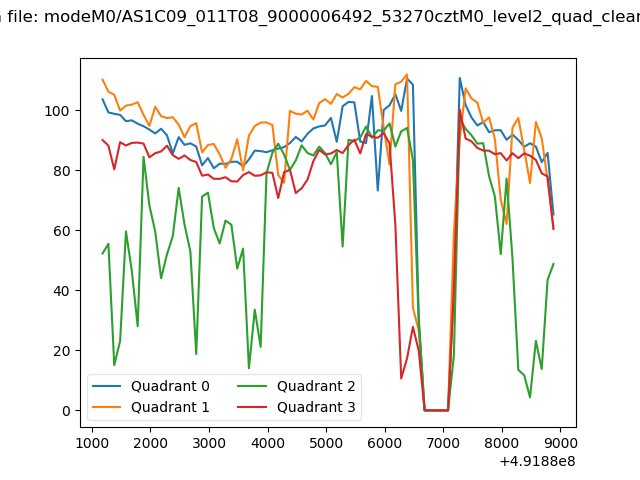 |
|
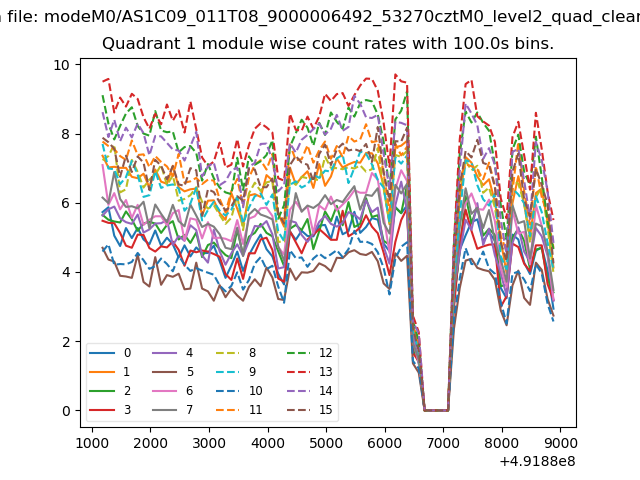
| Module-wise count rates for Quadrant A Data is divided into 100 sec bins |
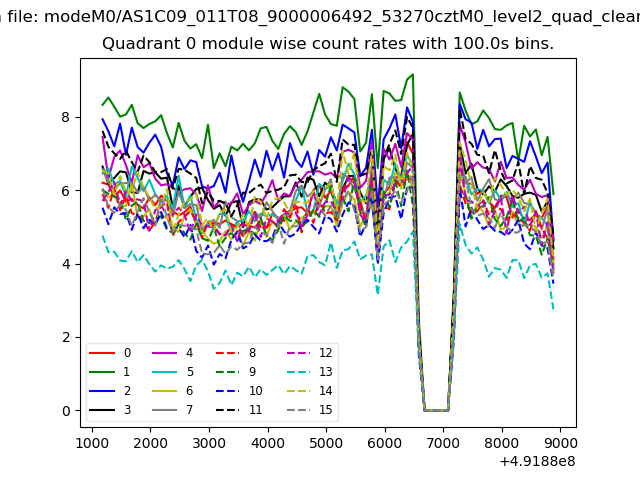 |
 |
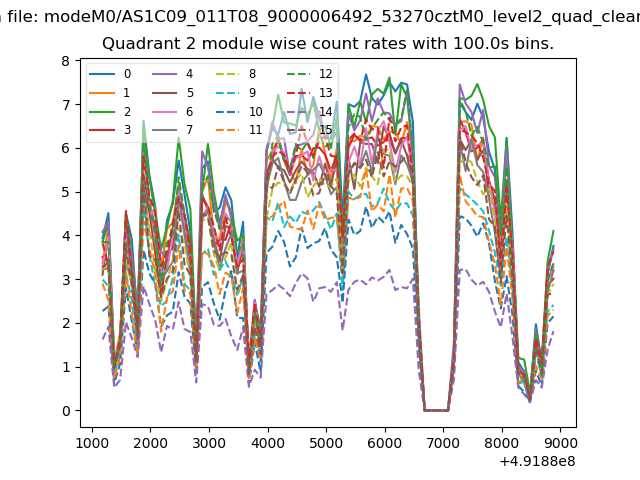
| Module-wise count rates for Quadrant B Data is divided into 100 sec bins |
 |
 |
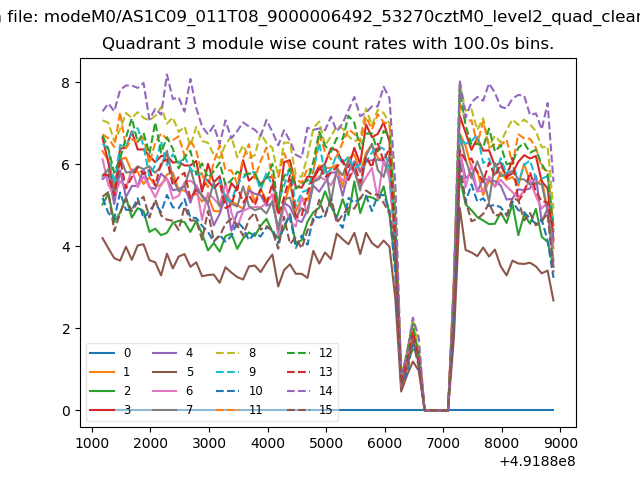
| Module-wise count rates for Quadrant C Data is divided into 100 sec bins |
 |
 |
| Module-wise count rates for Quadrant D Data is divided into 100 sec bins |
 |
 |
| Parameter | Plot |
|---|---|
| CZT HV Monitor | 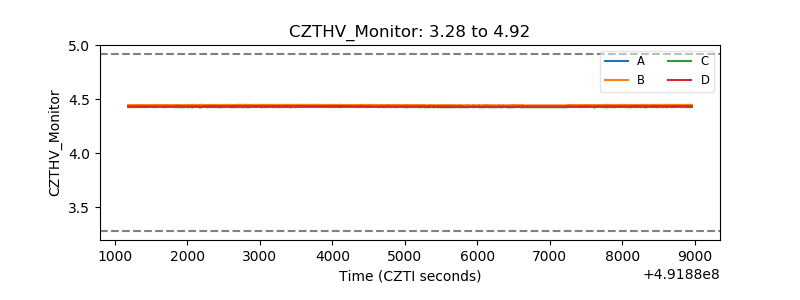 |
| D_VDD | 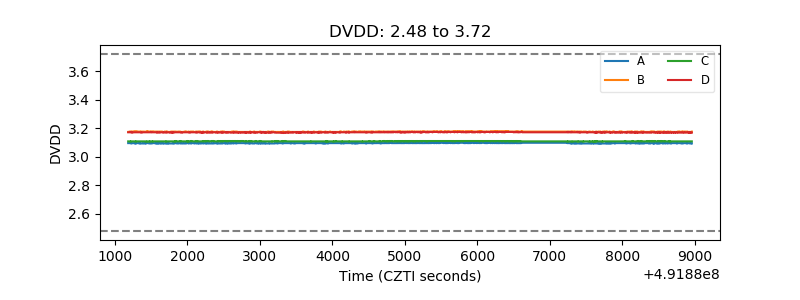 |
| Temperature 1 | 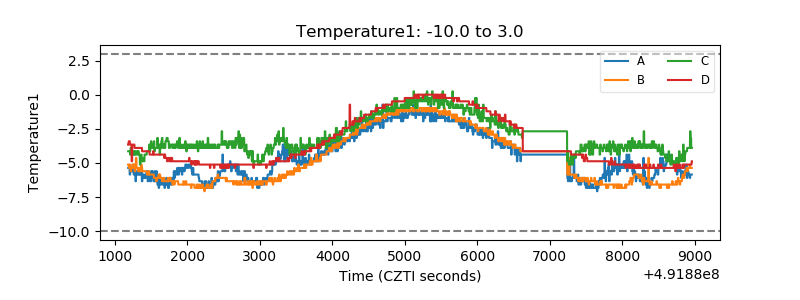 |
| Veto HV Monitor | 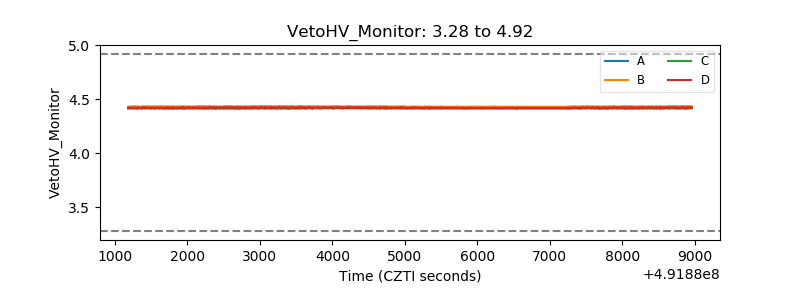 |
| Veto LLD | 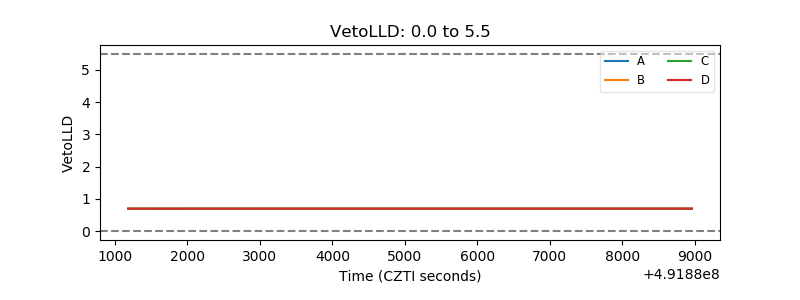 |
| Alpha Counter | 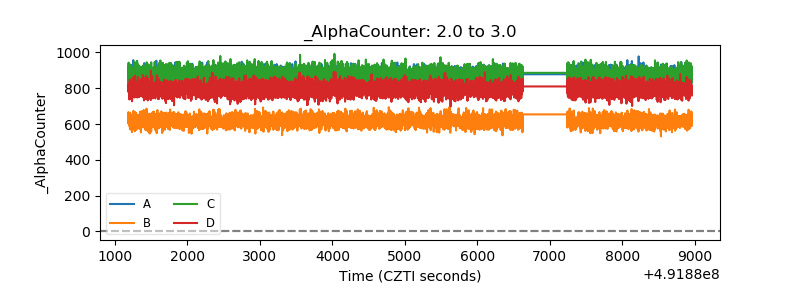 |
| _CPM_Rate | 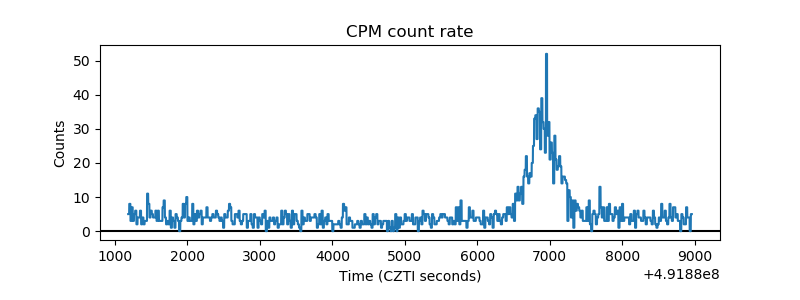 |
| CZT Counter | 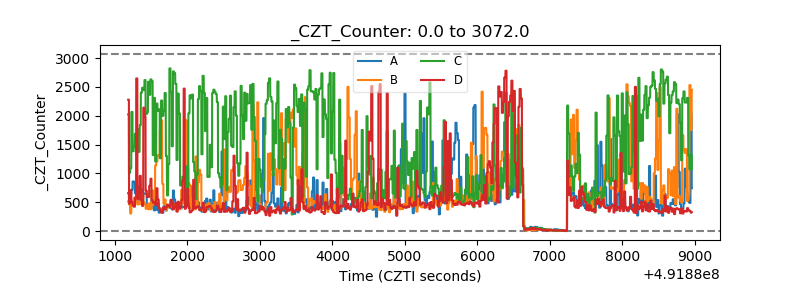 |
| +2.5 Volts monitor | 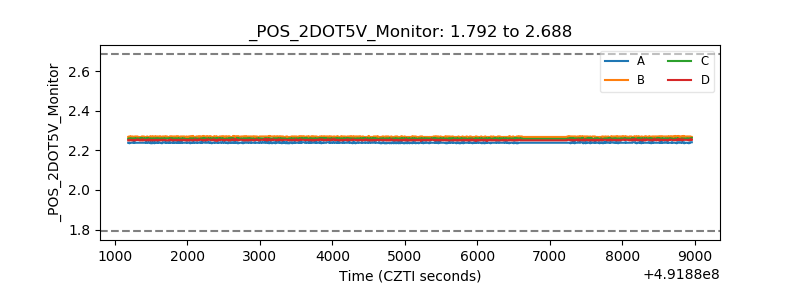 |
| +5 Volts monitor | 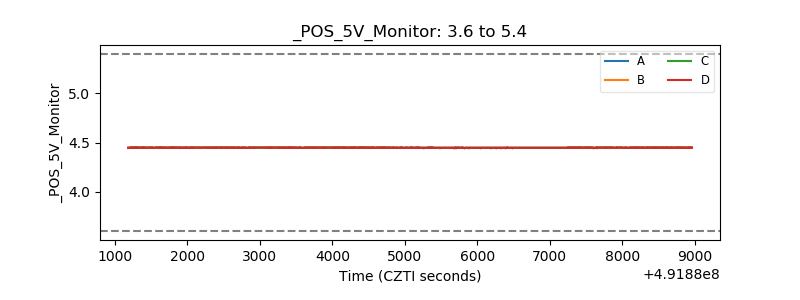 |
| _ROLL_ROT | 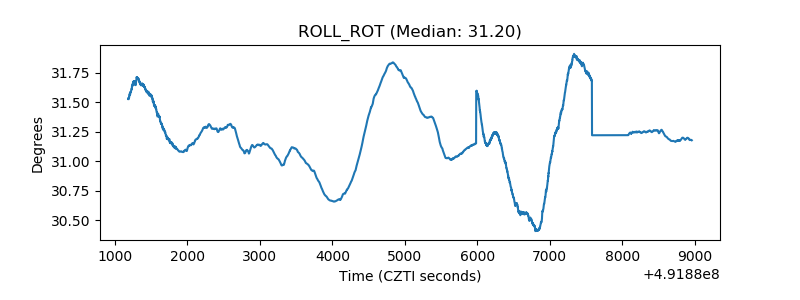 |
| _Roll_DEC | 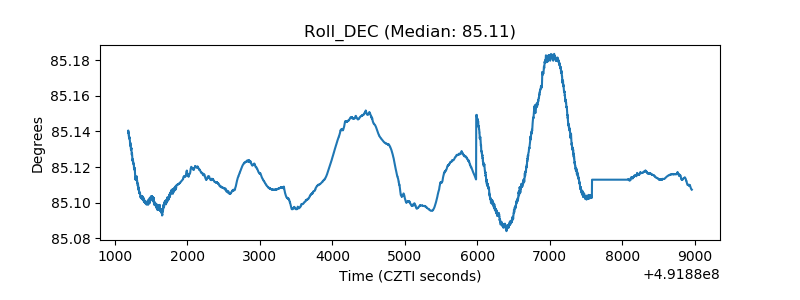 |
| _Roll_RA | 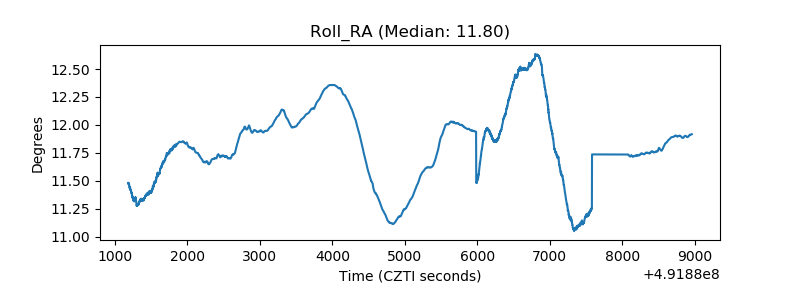 |
| Veto Counter | 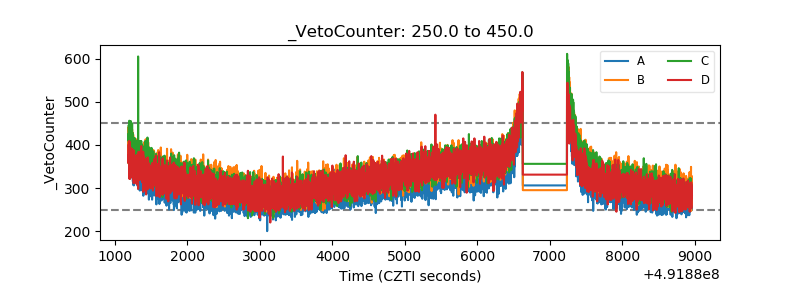 |