| Param | Original file | Final file |
|---|---|---|
| Filename | modeM0/AS1C09_011T08_9000006492_53271cztM0_level2.fits | modeM0/AS1C09_011T08_9000006492_53271cztM0_level2_quad_clean.evt |
| Size (bytes) | 775,321,920 | 91,336,320 |
| Size | 739.4 MB | 87.1 MB |
| Events in quadrant A | 5,011,707 | 640,997 |
| Events in quadrant B | 6,869,465 | 633,385 |
| Events in quadrant C | 12,229,643 | 414,071 |
| Events in quadrant D | 4,044,335 | 585,932 |
| Mode M0 | |||
|---|---|---|---|
| Quadrant | BADHDUFLAG | Total packets | Discarded packets |
| A | 0 | 19818 | 0 |
| B | 0 | 25320 | 0 |
| C | 0 | 41242 | 0 |
| D | 0 | 17369 | 0 |
| Mode SS | |||
|---|---|---|---|
| Quadrant | BADHDUFLAG | Total packets | Discarded packets |
| A | 0 | 142 | 0 |
| B | 0 | 142 | 0 |
| C | 0 | 142 | 0 |
| D | 0 | 142 | 0 |
| Quadrant | Total seconds | Saturated seconds | Saturation percentage |
|---|---|---|---|
| A | 7041 | 302 | 4.289163% |
| B | 7042 | 907 | 12.879864% |
| C | 7042 | 2893 | 41.082079% |
| D | 7042 | 212 | 3.010508% |
Noise dominated data is calculated using 1-second bins in cleaned event files. If a bin has >2000 counts, and if more than 50% of those come from <1% of pixels, then it is considered to be noise-dominated and hence unusable.
| Quadrant | # 1 sec bins | Bins with >0 counts | Bins with >2000 counts | High rate bins dominated by noise | Noise dominated (total time) | Noise dominated (detector-on time) | Marked lightcurve |
|---|---|---|---|---|---|---|---|
| A | 7041 | 7041 | 243 | 243 | 3.45% | 3.45% | 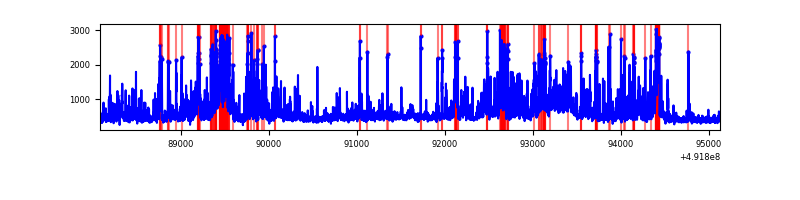 |
| B | 7042 | 7042 | 671 | 671 | 9.53% | 9.53% | 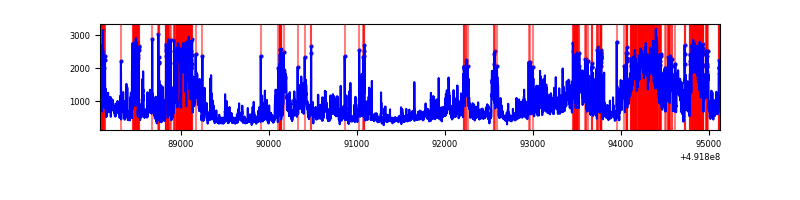 |
| C | 7042 | 7042 | 2745 | 2745 | 38.98% | 38.98% | 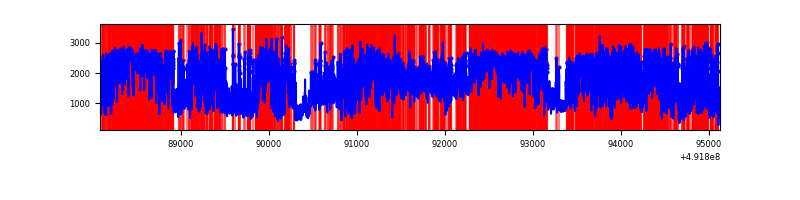 |
| D | 7042 | 7042 | 211 | 211 | 3.00% | 3.00% | 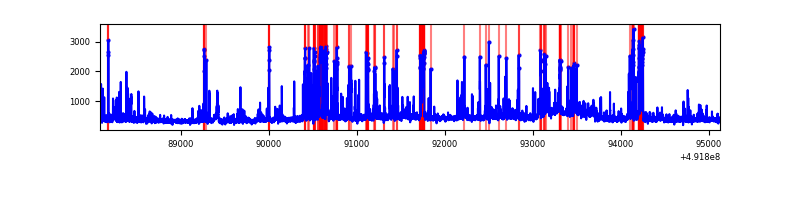 |
Top three noisy pixels from each quadrant. If the there are fewer than three noisy pixels in the level2.evt file, extra rows are filled as -1
| Pixel properties | Quadrant properties | ||||||
|---|---|---|---|---|---|---|---|
| Quadrant | DetID | PixID | Counts | Sigma | Mean | Median | Sigma |
| A | 3 | 27 | 1418796 | 8007.41 | 718 | 700 | 177.1 |
| A | 3 | 62 | 259405 | 1460.8 | 718 | 700 | 177.1 |
| A | 4 | 249 | 197986 | 1113.99 | 718 | 700 | 177.1 |
| B | 10 | 254 | 2540929 | 17045.01 | 697 | 671 | 149.0 |
| B | 2 | 249 | 784931 | 5262.35 | 697 | 671 | 149.0 |
| B | 4 | 81 | 419986 | 2813.58 | 697 | 671 | 149.0 |
| C | 10 | 22 | 5326322 | 32249.07 | 604 | 597 | 165.1 |
| C | 15 | 224 | 1750987 | 10599.21 | 604 | 597 | 165.1 |
| C | 5 | 10 | 1148468 | 6950.75 | 604 | 597 | 165.1 |
| D | 3 | 12 | 332899 | 1676.03 | 694 | 662 | 198.2 |
| D | 12 | 128 | 280403 | 1411.2 | 694 | 662 | 198.2 |
| D | 1 | 0 | 273379 | 1375.77 | 694 | 662 | 198.2 |
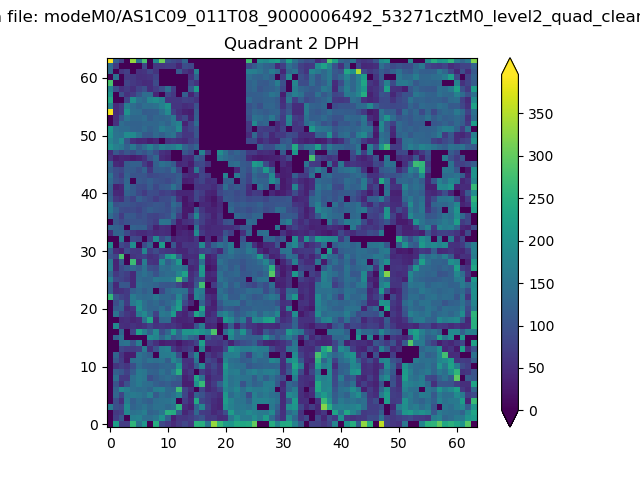
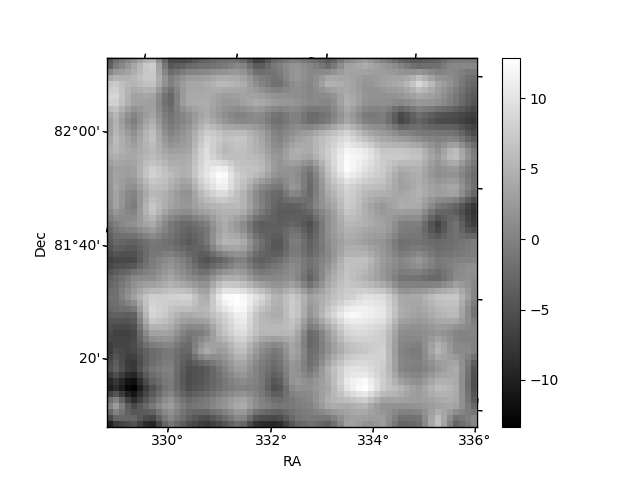
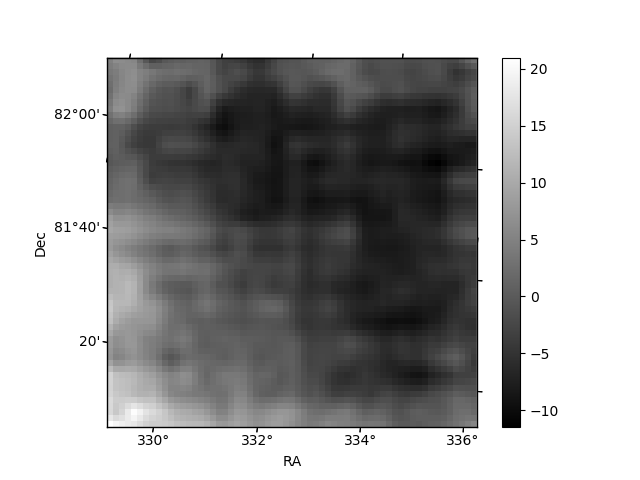
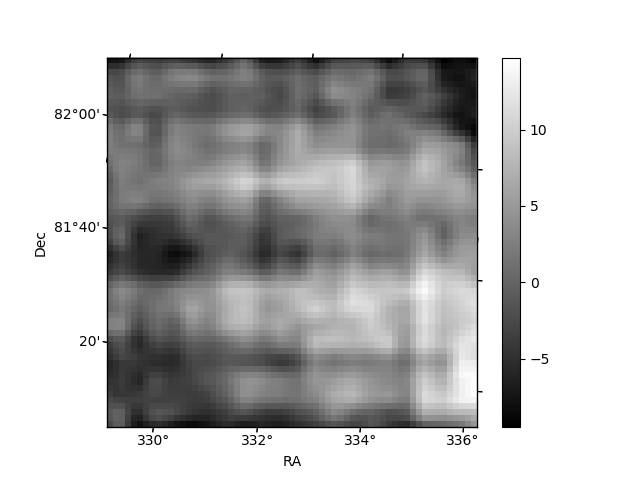
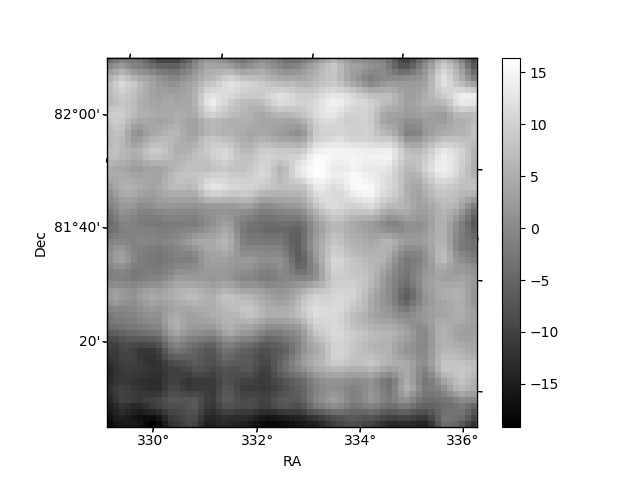
Histogram calculated using DETX and DETY for each event in the final _common_clean file
| Quadrant A | 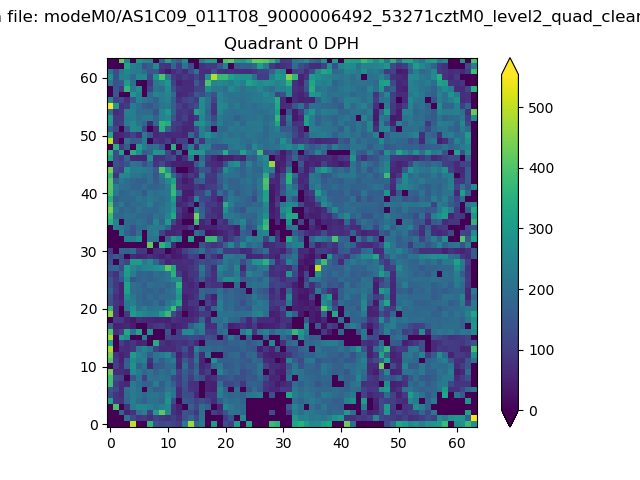 |
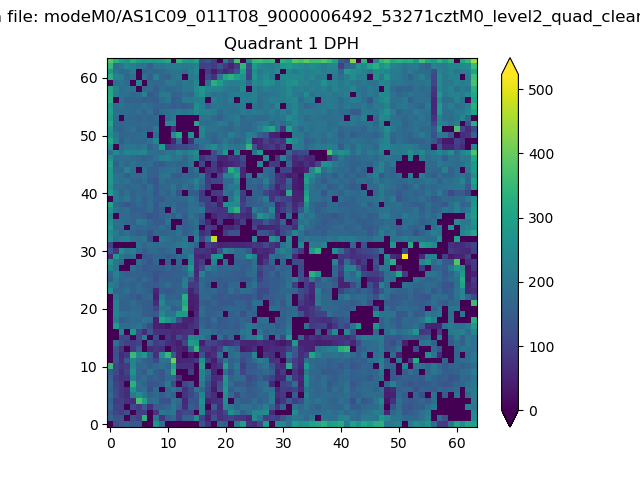 |
Quadrant B |
|---|---|---|---|
| Quadrant D | 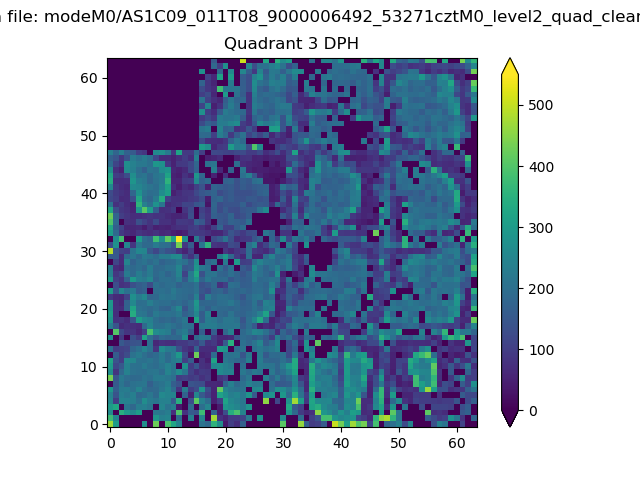 |
 |
Quadrant C |
| Plot type | Count rate plots | Images |
|---|---|---|
| Comparison with Poisson distribution Blue bars denote a histogram of data divided into 1 sec bins. Red curve is a Poisson curve with rate = median count rate of data. |
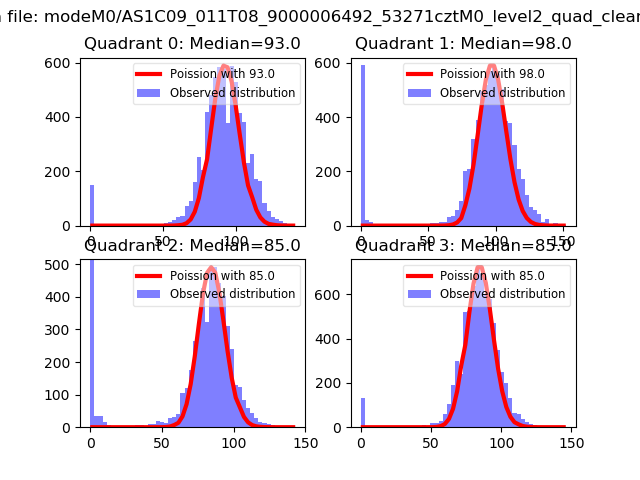 |
 |
| Quadrant-wise count rates Data is divided into 100 sec bins |
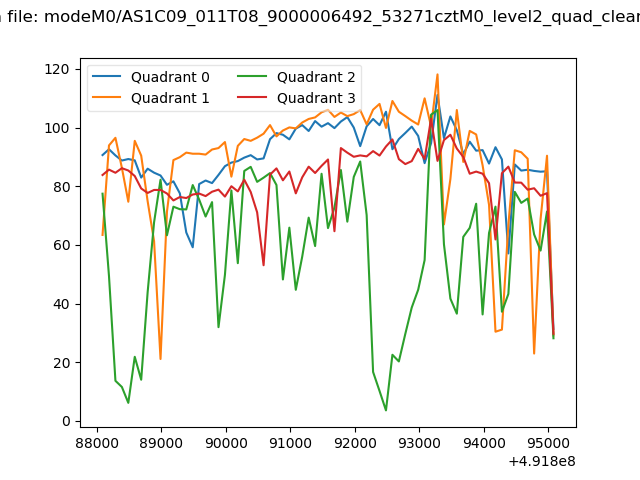 |
|
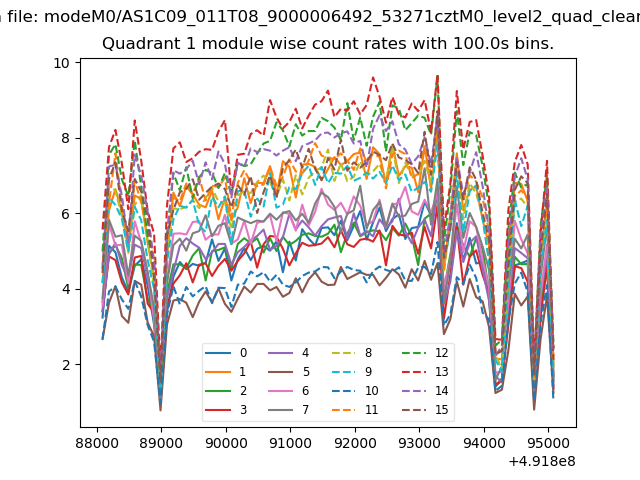
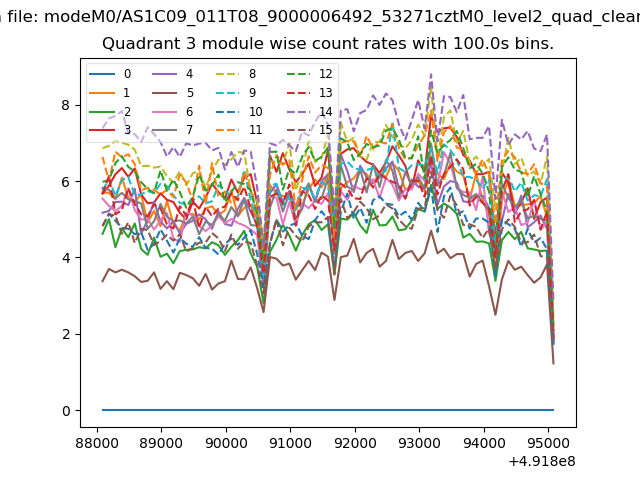
| Module-wise count rates for Quadrant A Data is divided into 100 sec bins |
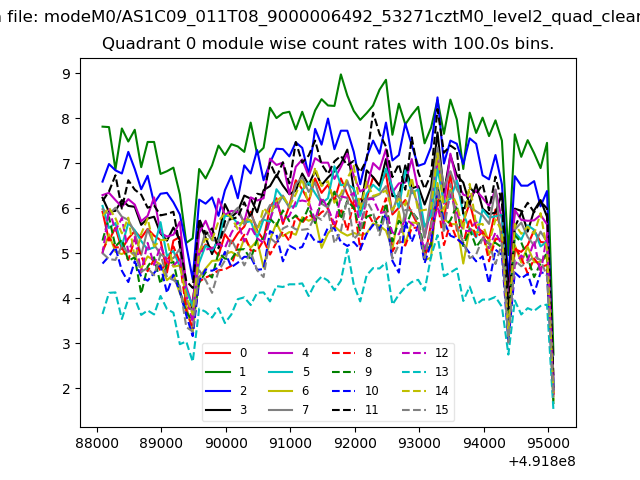 |
 |
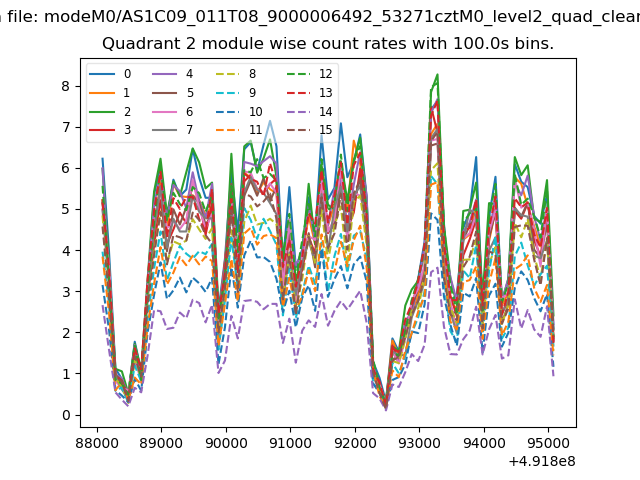
| Module-wise count rates for Quadrant B Data is divided into 100 sec bins |
 |
 |
| Module-wise count rates for Quadrant C Data is divided into 100 sec bins |
 |
 |
| Module-wise count rates for Quadrant D Data is divided into 100 sec bins |
 |
 |
| Parameter | Plot |
|---|---|
| CZT HV Monitor | 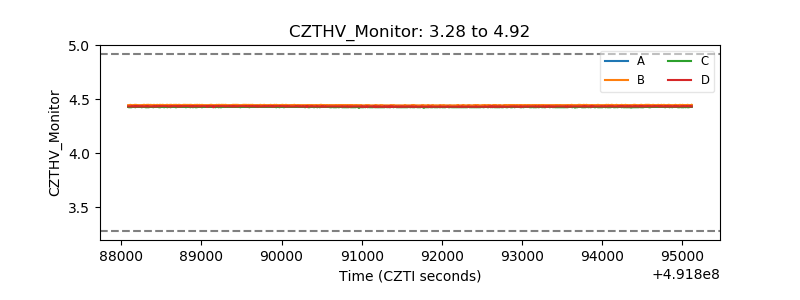 |
| D_VDD | 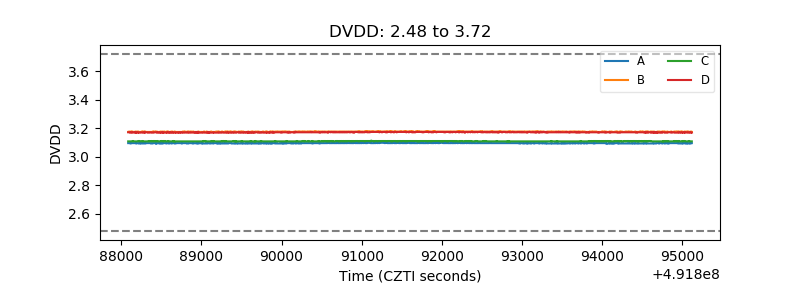 |
| Temperature 1 | 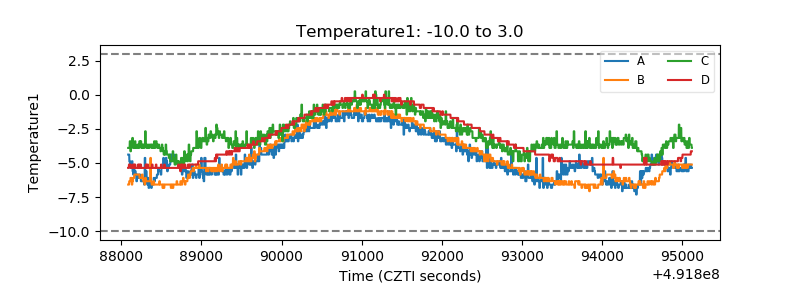 |
| Veto HV Monitor | 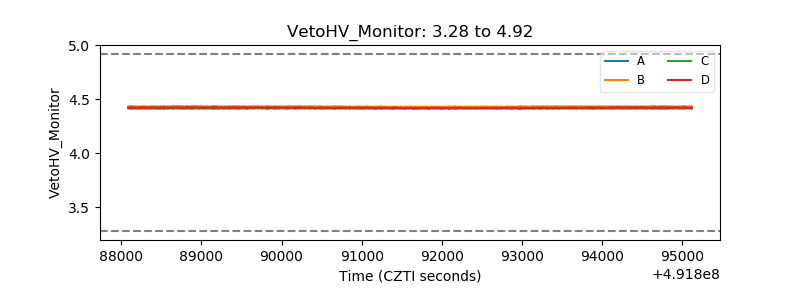 |
| Veto LLD | 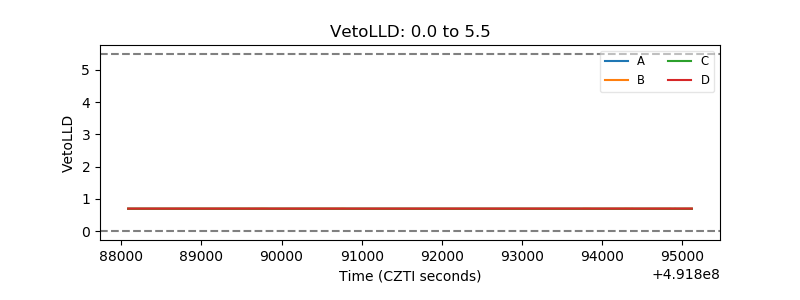 |
| Alpha Counter |  |
| _CPM_Rate | 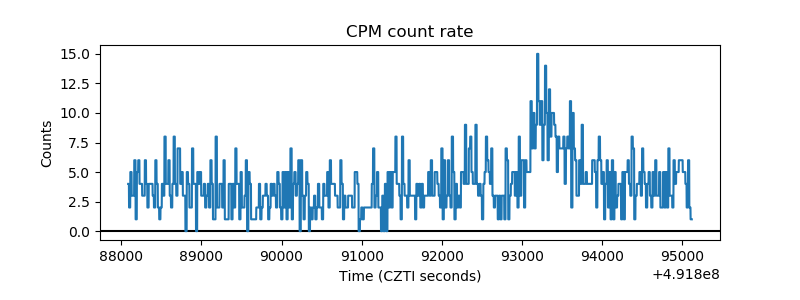 |
| CZT Counter | 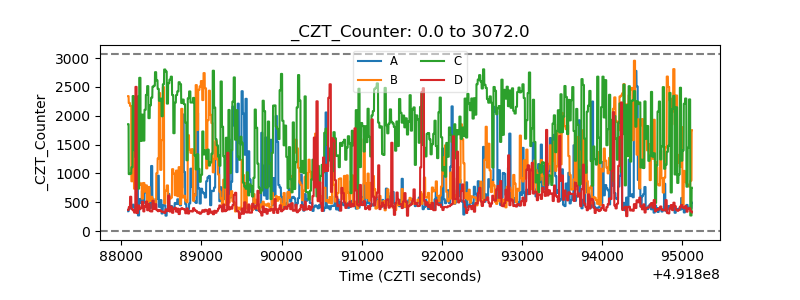 |
| +2.5 Volts monitor | 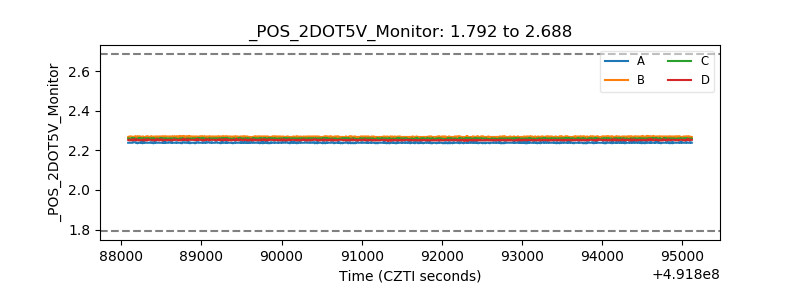 |
| +5 Volts monitor | 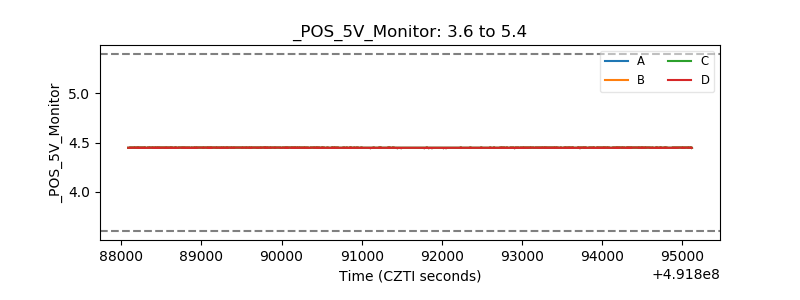 |
| _ROLL_ROT | 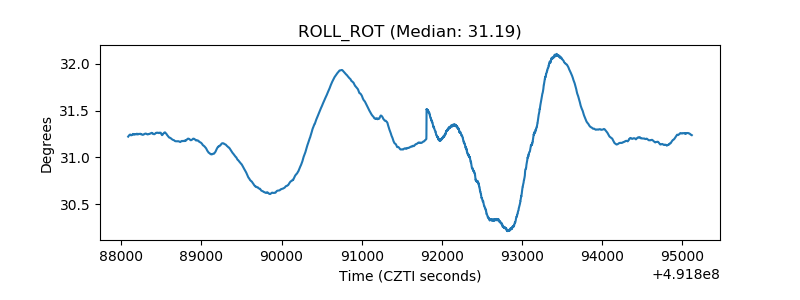 |
| _Roll_DEC | 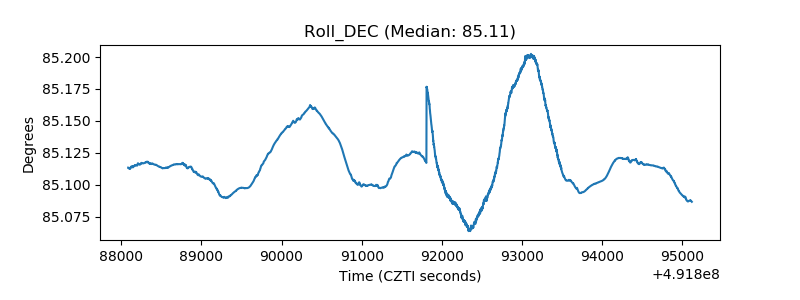 |
| _Roll_RA | 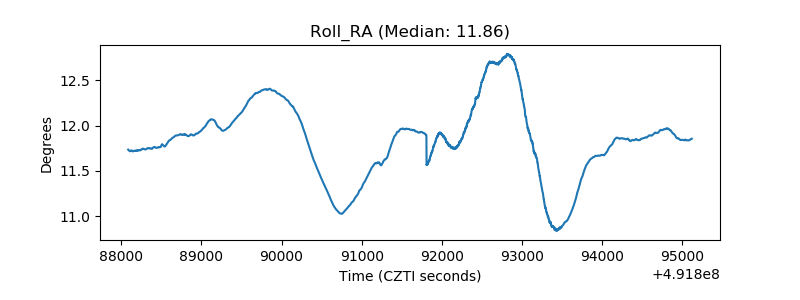 |
| Veto Counter | 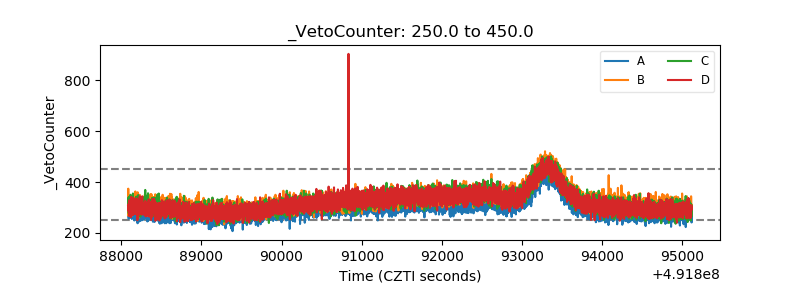 |