| Param | Original file | Final file |
|---|---|---|
| Filename | modeM0/AS1C09_011T08_9000006492_53272cztM0_level2.fits | modeM0/AS1C09_011T08_9000006492_53272cztM0_level2_quad_clean.evt |
| Size (bytes) | 854,061,120 | 92,099,520 |
| Size | 814.5 MB | 87.8 MB |
| Events in quadrant A | 7,327,837 | 597,619 |
| Events in quadrant B | 7,619,579 | 649,454 |
| Events in quadrant C | 11,398,476 | 429,869 |
| Events in quadrant D | 4,706,604 | 604,574 |
| Mode M0 | |||
|---|---|---|---|
| Quadrant | BADHDUFLAG | Total packets | Discarded packets |
| A | 0 | 27011 | 0 |
| B | 0 | 27593 | 0 |
| C | 0 | 38828 | 0 |
| D | 0 | 19233 | 0 |
| Mode SS | |||
|---|---|---|---|
| Quadrant | BADHDUFLAG | Total packets | Discarded packets |
| A | 0 | 146 | 0 |
| B | 0 | 146 | 0 |
| C | 0 | 146 | 0 |
| D | 0 | 146 | 0 |
| Quadrant | Total seconds | Saturated seconds | Saturation percentage |
|---|---|---|---|
| A | 7276 | 1060 | 14.568444% |
| B | 7277 | 1006 | 13.824378% |
| C | 7277 | 2717 | 37.336815% |
| D | 7277 | 210 | 2.885805% |
Noise dominated data is calculated using 1-second bins in cleaned event files. If a bin has >2000 counts, and if more than 50% of those come from <1% of pixels, then it is considered to be noise-dominated and hence unusable.
| Quadrant | # 1 sec bins | Bins with >0 counts | Bins with >2000 counts | High rate bins dominated by noise | Noise dominated (total time) | Noise dominated (detector-on time) | Marked lightcurve |
|---|---|---|---|---|---|---|---|
| A | 7276 | 7276 | 1002 | 1002 | 13.77% | 13.77% | 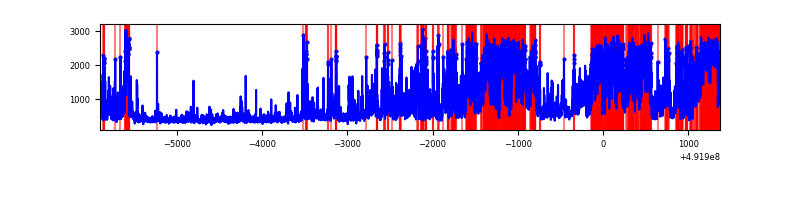 |
| B | 7277 | 7277 | 922 | 922 | 12.67% | 12.67% | 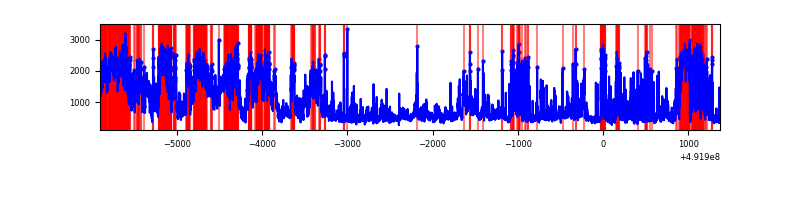 |
| C | 7276 | 7276 | 2696 | 2696 | 37.05% | 37.05% | 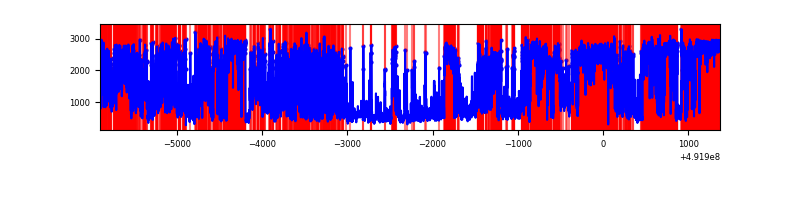 |
| D | 7277 | 7277 | 230 | 230 | 3.16% | 3.16% | 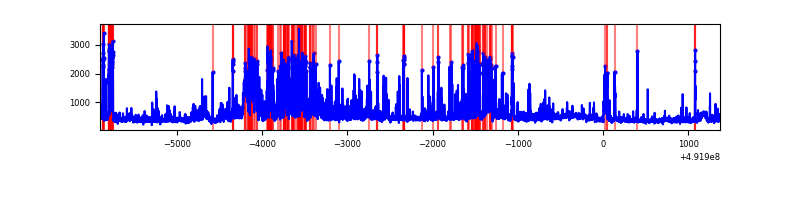 |
Top three noisy pixels from each quadrant. If the there are fewer than three noisy pixels in the level2.evt file, extra rows are filled as -1
| Pixel properties | Quadrant properties | ||||||
|---|---|---|---|---|---|---|---|
| Quadrant | DetID | PixID | Counts | Sigma | Mean | Median | Sigma |
| A | 3 | 27 | 3556357 | 20047.4 | 712 | 695 | 177.4 |
| A | 3 | 62 | 312352 | 1757.17 | 712 | 695 | 177.4 |
| A | 15 | 174 | 132261 | 741.79 | 712 | 695 | 177.4 |
| B | 10 | 254 | 2845767 | 18784.65 | 712 | 689 | 151.5 |
| B | 4 | 81 | 885321 | 5840.79 | 712 | 689 | 151.5 |
| B | 2 | 249 | 537076 | 3541.5 | 712 | 689 | 151.5 |
| C | 1 | 241 | 3789106 | 22776.62 | 601 | 593 | 166.3 |
| C | 15 | 224 | 2482220 | 14919.59 | 601 | 593 | 166.3 |
| C | 10 | 22 | 895120 | 5377.91 | 601 | 593 | 166.3 |
| D | 12 | 3 | 635688 | 3130.47 | 713 | 681 | 202.8 |
| D | 2 | 37 | 358487 | 1763.92 | 713 | 681 | 202.8 |
| D | 1 | 0 | 253083 | 1244.3 | 713 | 681 | 202.8 |
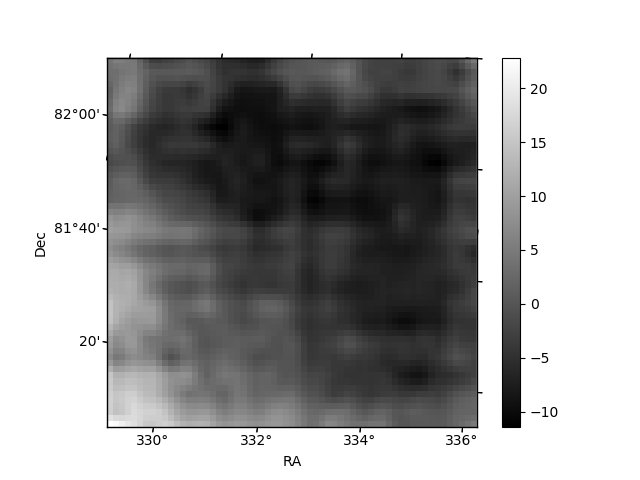
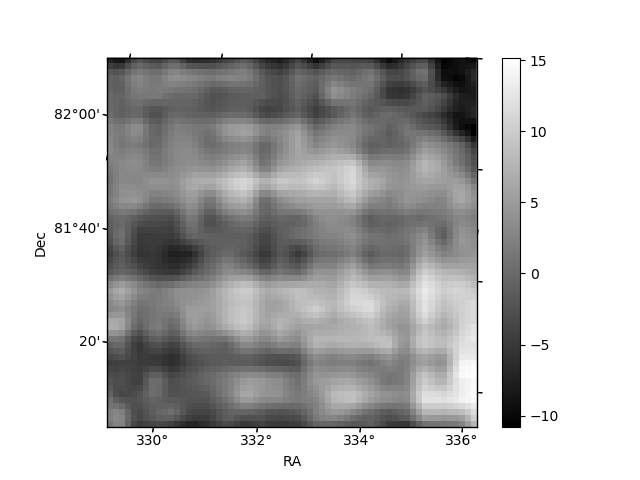
Histogram calculated using DETX and DETY for each event in the final _common_clean file
| Quadrant A | 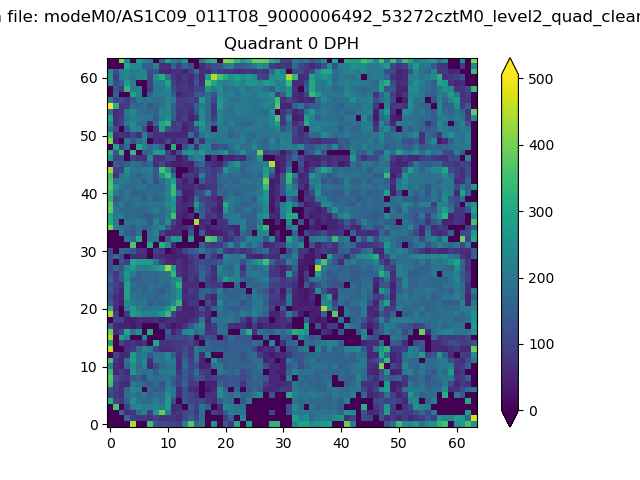 |
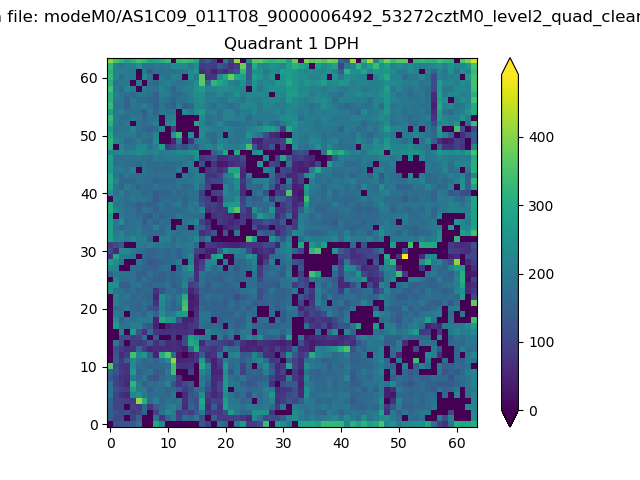 |
Quadrant B |
|---|---|---|---|
| Quadrant D | 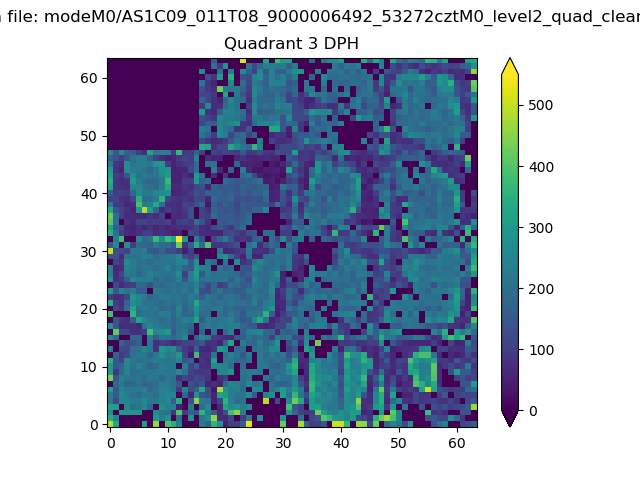 |
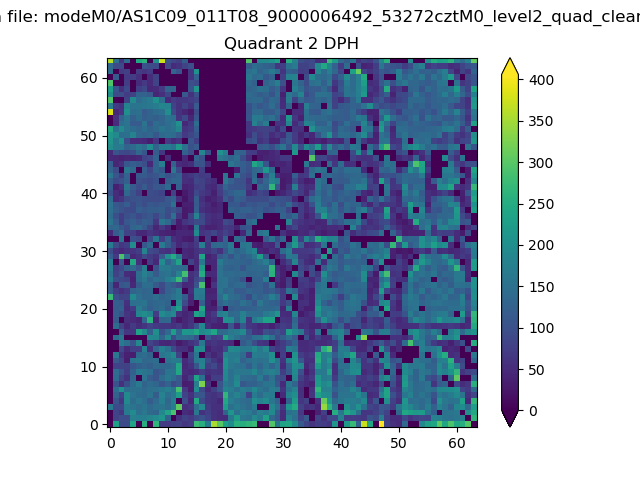 |
Quadrant C |
| Plot type | Count rate plots | Images |
|---|---|---|
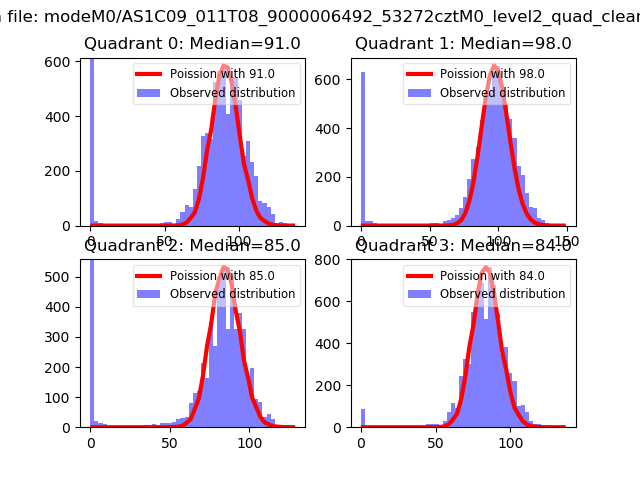
| Comparison with Poisson distribution Blue bars denote a histogram of data divided into 1 sec bins. Red curve is a Poisson curve with rate = median count rate of data. |
 |
 |
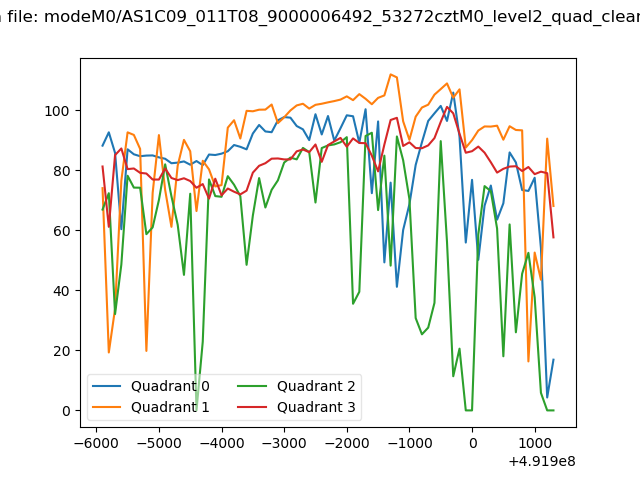
| Quadrant-wise count rates Data is divided into 100 sec bins |
 |
|
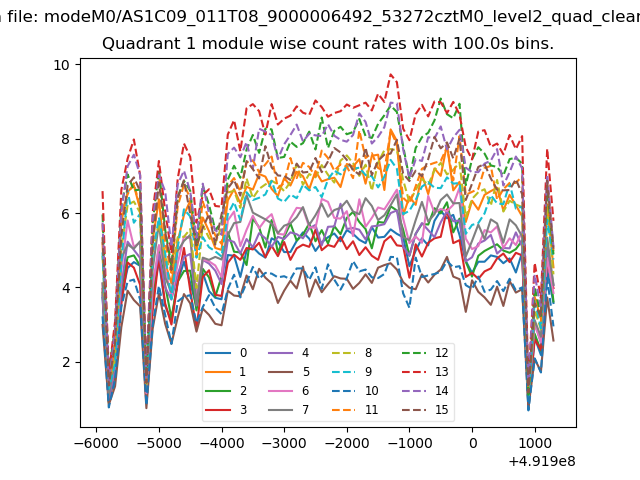
| Module-wise count rates for Quadrant A Data is divided into 100 sec bins |
 |
 |
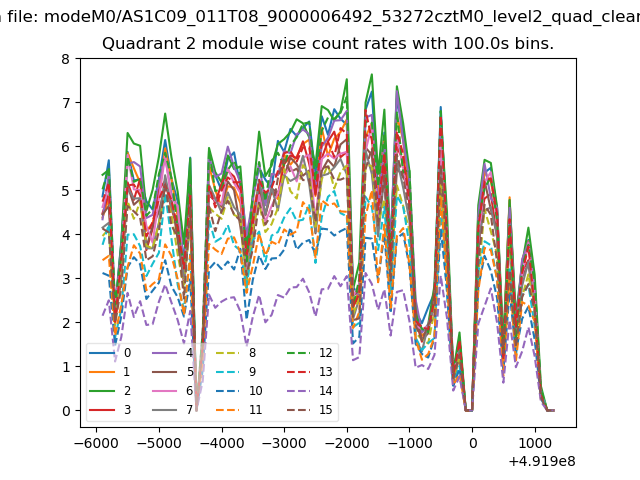
| Module-wise count rates for Quadrant B Data is divided into 100 sec bins |
 |
 |
| Module-wise count rates for Quadrant C Data is divided into 100 sec bins |
 |
 |
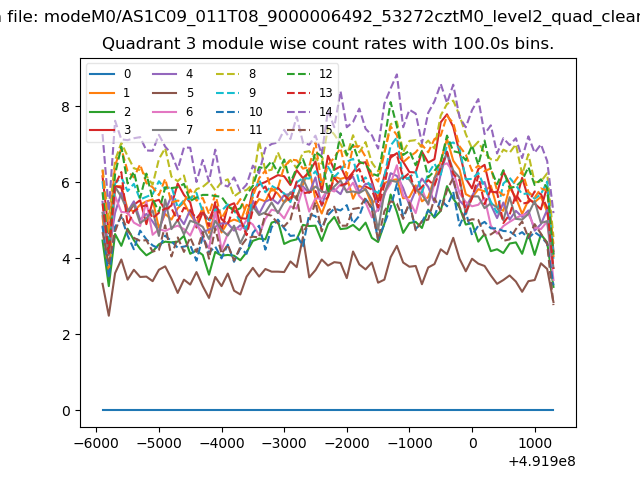
| Module-wise count rates for Quadrant D Data is divided into 100 sec bins |
 |
 |
| Parameter | Plot |
|---|---|
| CZT HV Monitor | 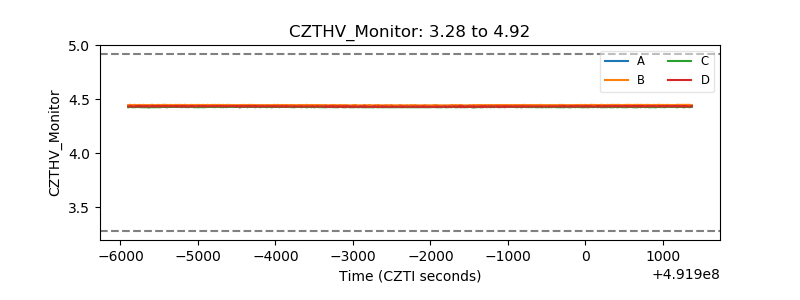 |
| D_VDD | 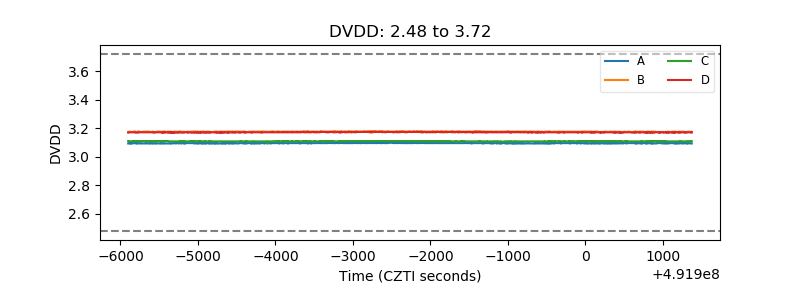 |
| Temperature 1 | 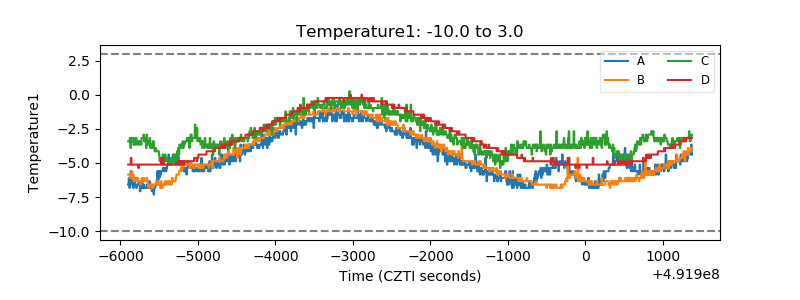 |
| Veto HV Monitor | 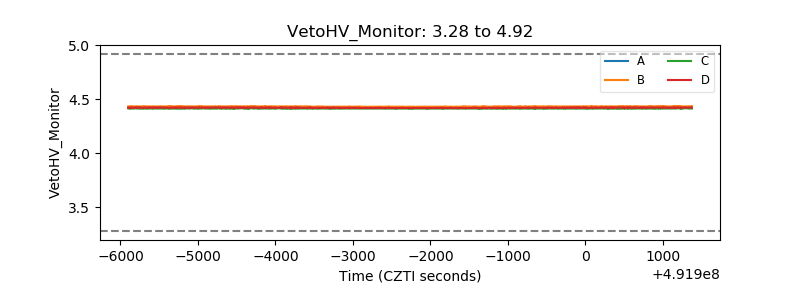 |
| Veto LLD | 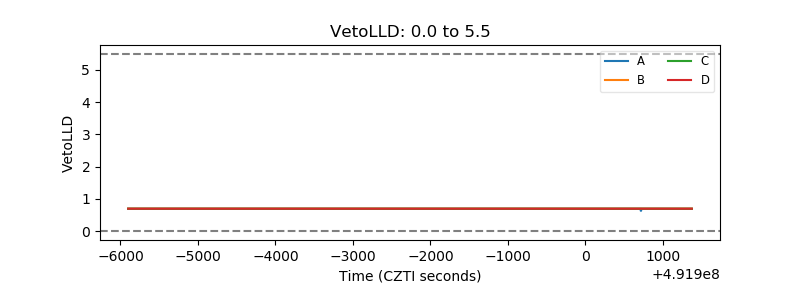 |
| Alpha Counter | 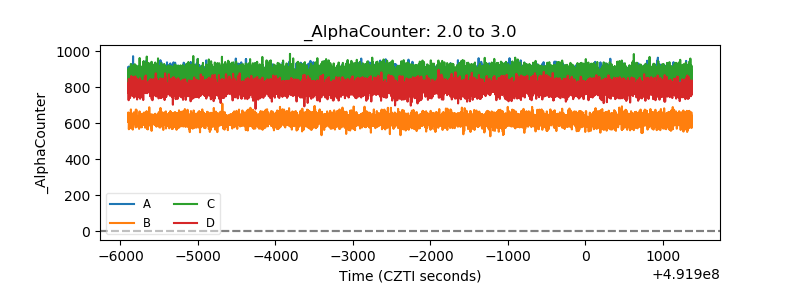 |
| _CPM_Rate | 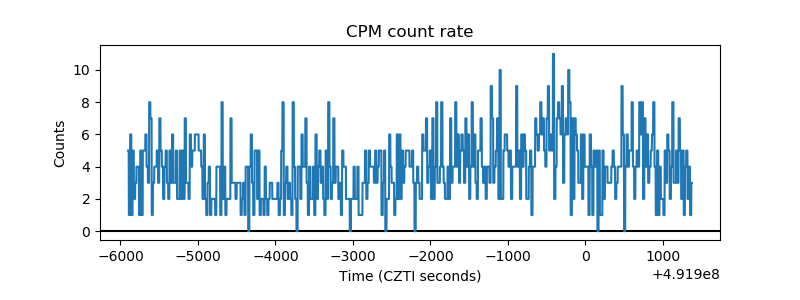 |
| CZT Counter | 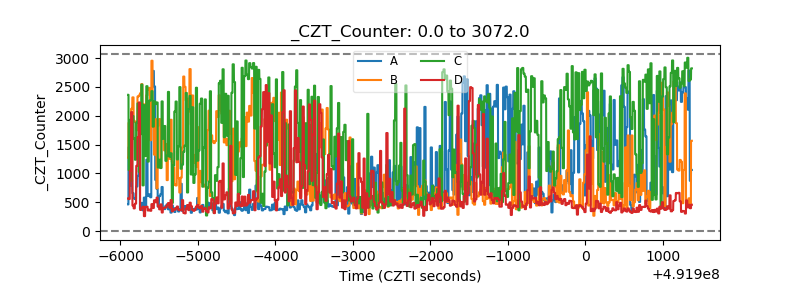 |
| +2.5 Volts monitor |  |
| +5 Volts monitor |  |
| _ROLL_ROT | 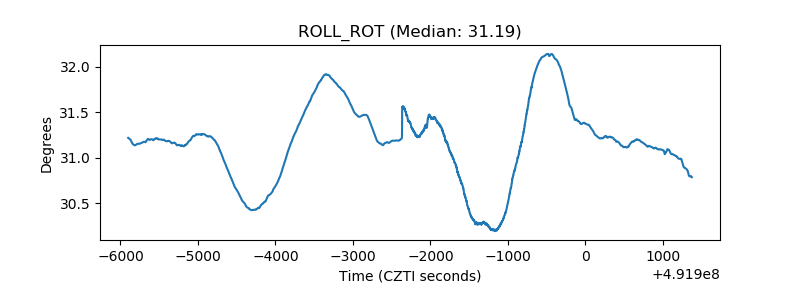 |
| _Roll_DEC | 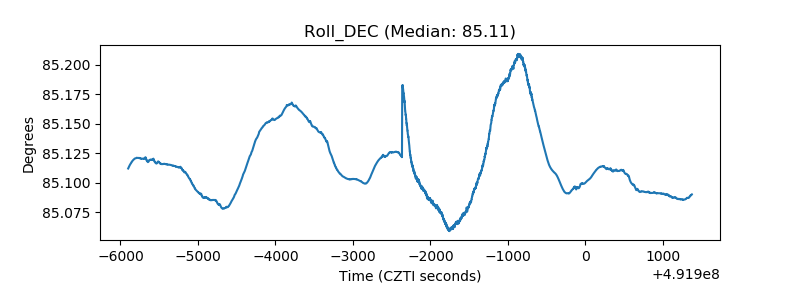 |
| _Roll_RA | 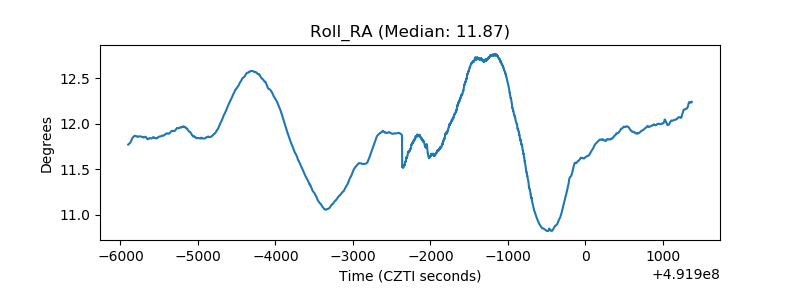 |
| Veto Counter | 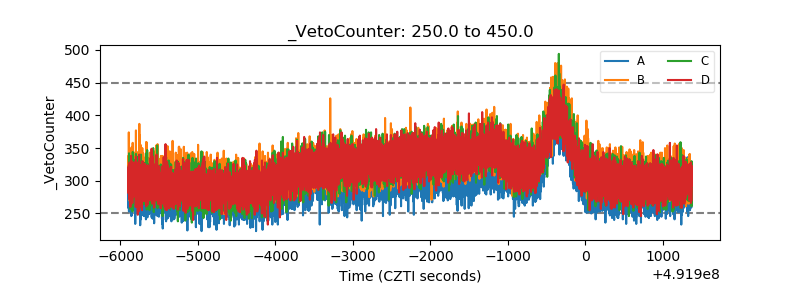 |