| Param | Original file | Final file |
|---|---|---|
| Filename | modeM0/AS1C09_011T08_9000006492_53276cztM0_level2.fits | modeM0/AS1C09_011T08_9000006492_53276cztM0_level2_quad_clean.evt |
| Size (bytes) | 1,521,541,440 | 213,480,000 |
| Size | 1.4 GB | 203.6 MB |
| Events in quadrant A | 12,912,706 | 1,415,801 |
| Events in quadrant B | 10,574,107 | 1,547,331 |
| Events in quadrant C | 21,618,917 | 1,050,927 |
| Events in quadrant D | 9,968,522 | 1,332,721 |
| Mode M0 | |||
|---|---|---|---|
| Quadrant | BADHDUFLAG | Total packets | Discarded packets |
| A | 0 | 49312 | 3 |
| B | 0 | 42618 | 3 |
| C | 0 | 75459 | 3 |
| D | 0 | 40994 | 3 |
| Mode M9 | |||
|---|---|---|---|
| Quadrant | BADHDUFLAG | Total packets | Discarded packets |
| A | 0 | 15 | 0 |
| B | 0 | 15 | 0 |
| C | 0 | 15 | 0 |
| D | 0 | 15 | 0 |
| Mode SS | |||
|---|---|---|---|
| Quadrant | BADHDUFLAG | Total packets | Discarded packets |
| A | 0 | 332 | 0 |
| B | 0 | 332 | 0 |
| C | 0 | 332 | 0 |
| D | 0 | 332 | 0 |
| Quadrant | Total seconds | Saturated seconds | Saturation percentage |
|---|---|---|---|
| A | 16172 | 1134 | 7.012120% |
| B | 16172 | 995 | 6.152609% |
| C | 16172 | 4244 | 26.242889% |
| D | 16172 | 581 | 3.592629% |
Noise dominated data is calculated using 1-second bins in cleaned event files. If a bin has >2000 counts, and if more than 50% of those come from <1% of pixels, then it is considered to be noise-dominated and hence unusable.
| Quadrant | # 1 sec bins | Bins with >0 counts | Bins with >2000 counts | High rate bins dominated by noise | Noise dominated (total time) | Noise dominated (detector-on time) | Marked lightcurve |
|---|---|---|---|---|---|---|---|
| A | 17772 | 16172 | 945 | 945 | 5.32% | 5.84% | 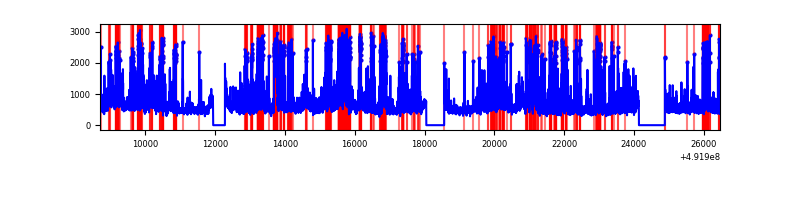 |
| B | 17772 | 16172 | 624 | 624 | 3.51% | 3.86% | 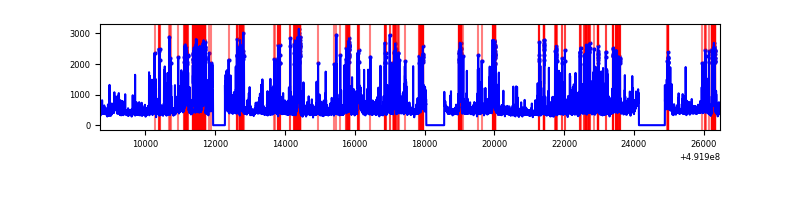 |
| C | 17772 | 16173 | 4082 | 4082 | 22.97% | 25.24% | 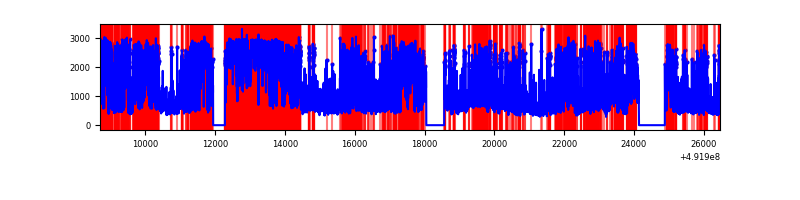 |
| D | 17772 | 16173 | 430 | 430 | 2.42% | 2.66% |  |
Top three noisy pixels from each quadrant. If the there are fewer than three noisy pixels in the level2.evt file, extra rows are filled as -1
| Pixel properties | Quadrant properties | ||||||
|---|---|---|---|---|---|---|---|
| Quadrant | DetID | PixID | Counts | Sigma | Mean | Median | Sigma |
| A | 3 | 62 | 2979292 | 7095.52 | 1678 | 1631 | 419.7 |
| A | 3 | 14 | 1329440 | 3164.06 | 1678 | 1631 | 419.7 |
| A | 0 | 8 | 459830 | 1091.85 | 1678 | 1631 | 419.7 |
| B | 2 | 249 | 1138800 | 3240.47 | 1665 | 1603 | 350.9 |
| B | 10 | 28 | 792647 | 2254.1 | 1665 | 1603 | 350.9 |
| B | 8 | 128 | 728505 | 2071.32 | 1665 | 1603 | 350.9 |
| C | 1 | 241 | 5015588 | 12409.67 | 1463 | 1448 | 404.1 |
| C | 15 | 224 | 4146531 | 10258.81 | 1463 | 1448 | 404.1 |
| C | 10 | 22 | 1847703 | 4569.36 | 1463 | 1448 | 404.1 |
| D | 3 | 12 | 560013 | 1184.02 | 1647 | 1573 | 471.6 |
| D | 2 | 249 | 473114 | 999.78 | 1647 | 1573 | 471.6 |
| D | 11 | 176 | 340034 | 717.62 | 1647 | 1573 | 471.6 |
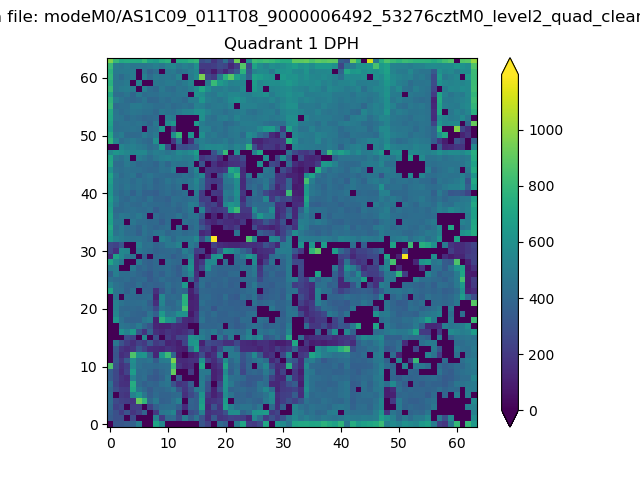
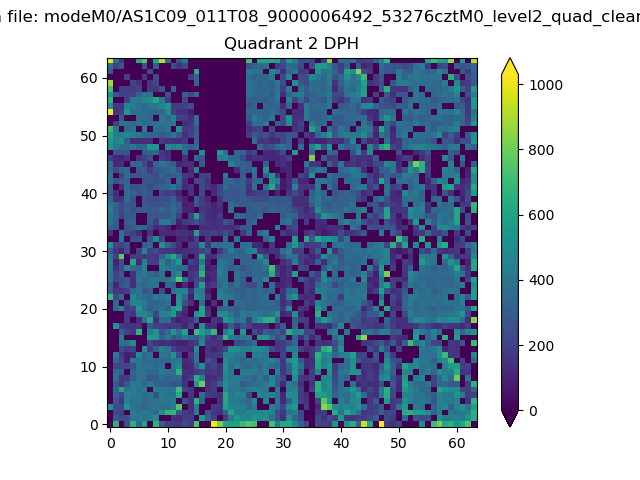
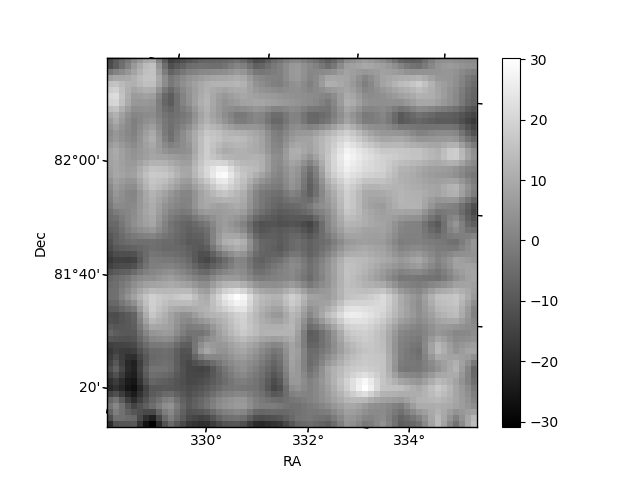
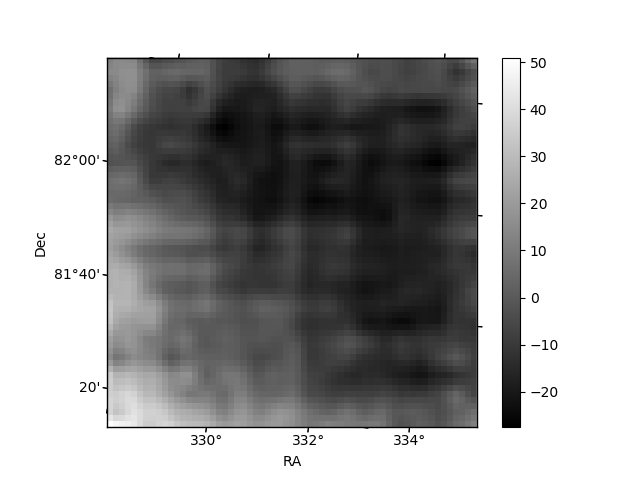
Histogram calculated using DETX and DETY for each event in the final _common_clean file
| Quadrant A | 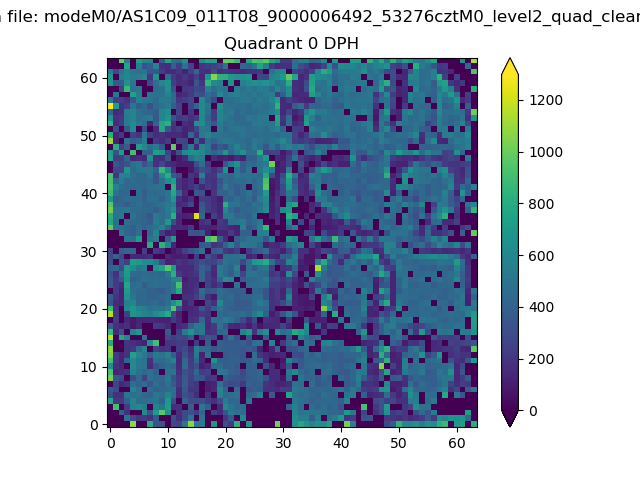 |
 |
Quadrant B |
|---|---|---|---|
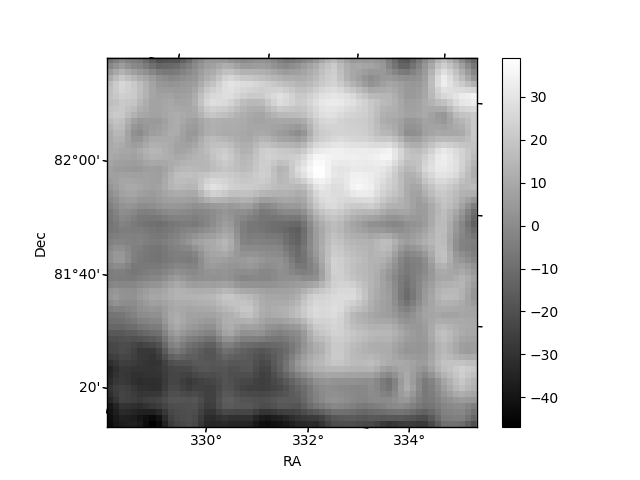
| Quadrant D | 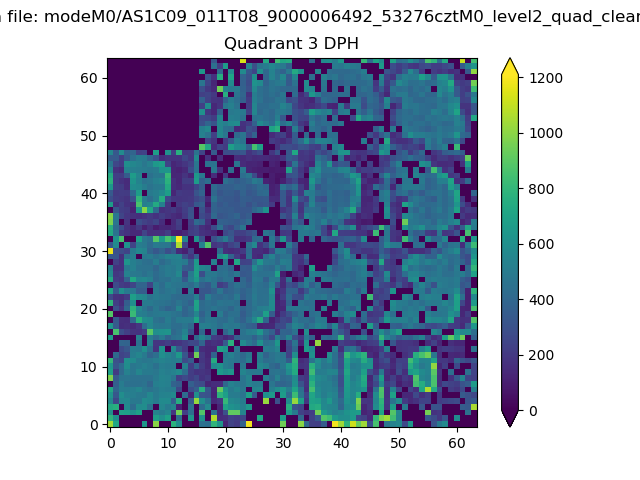 |
 |
Quadrant C |
| Plot type | Count rate plots | Images |
|---|---|---|
| Comparison with Poisson distribution Blue bars denote a histogram of data divided into 1 sec bins. Red curve is a Poisson curve with rate = median count rate of data. |
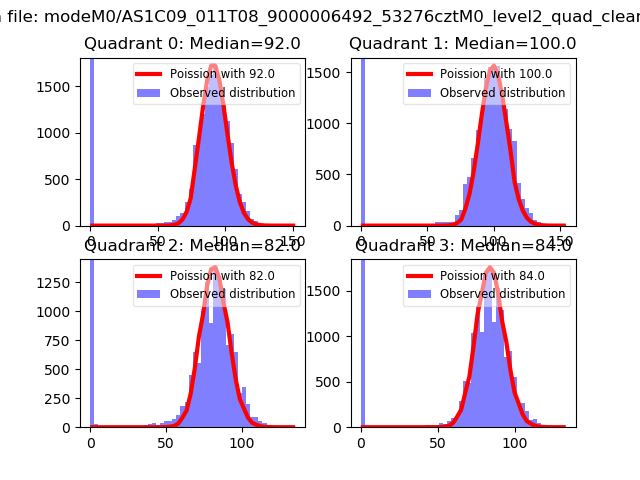 |
 |
| Quadrant-wise count rates Data is divided into 100 sec bins |
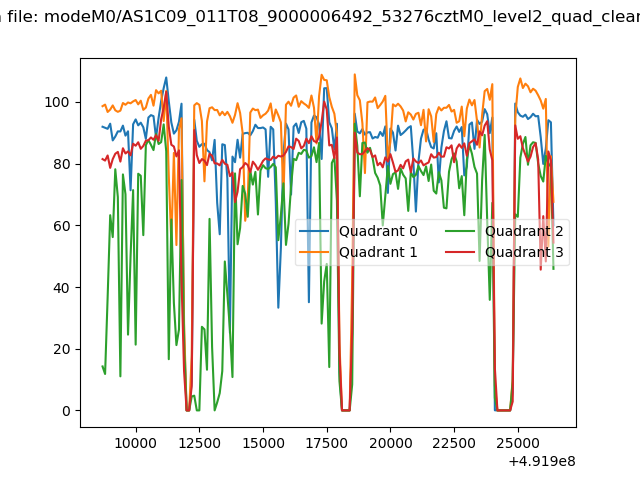 |
|
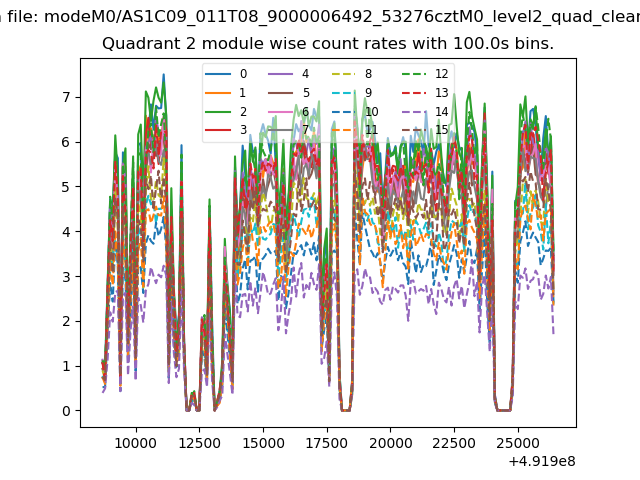
| Module-wise count rates for Quadrant A Data is divided into 100 sec bins |
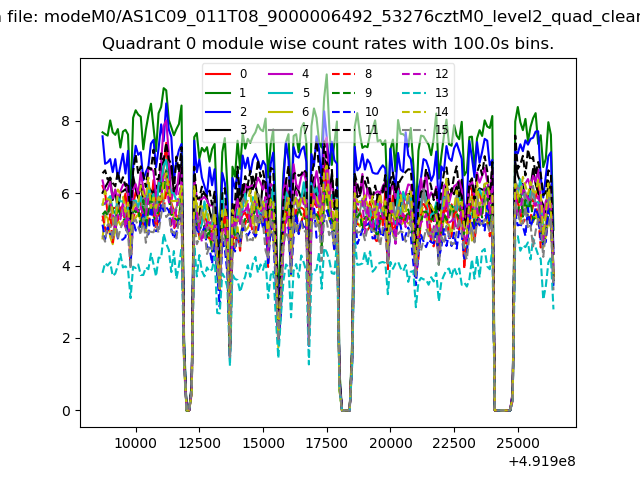 |
 |
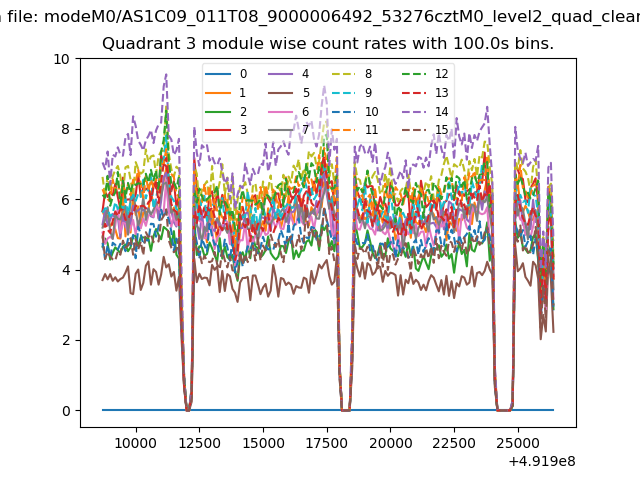
| Module-wise count rates for Quadrant B Data is divided into 100 sec bins |
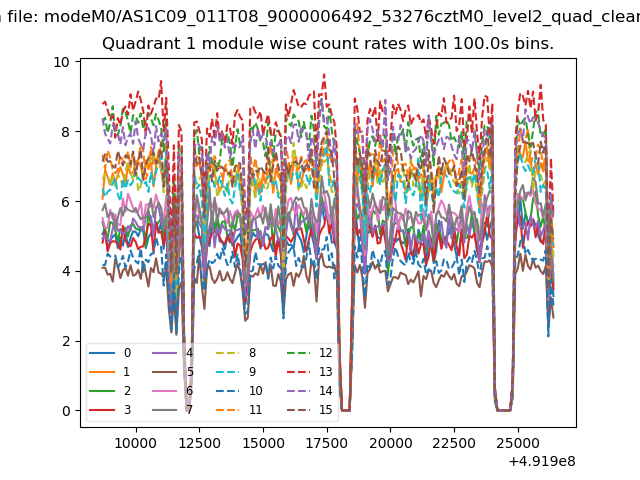 |
 |
| Module-wise count rates for Quadrant C Data is divided into 100 sec bins |
 |
 |
| Module-wise count rates for Quadrant D Data is divided into 100 sec bins |
 |
 |
| Parameter | Plot |
|---|---|
| CZT HV Monitor | 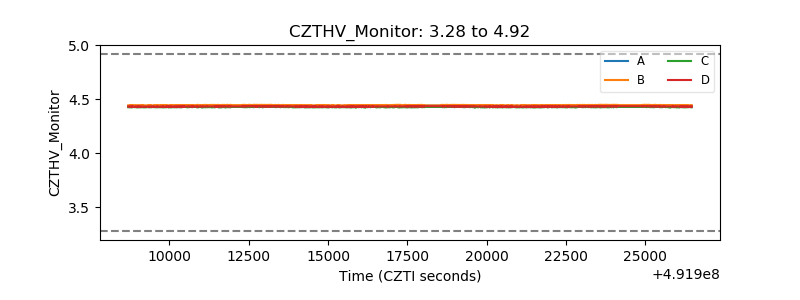 |
| D_VDD | 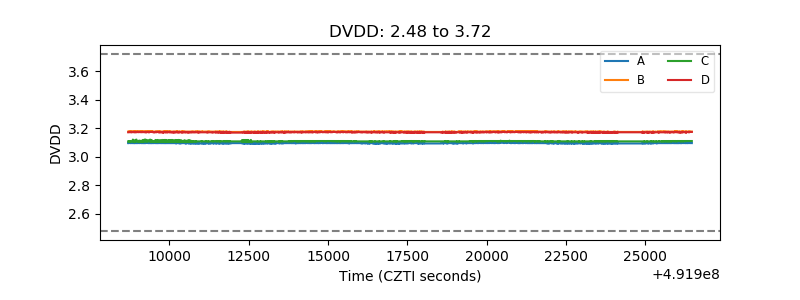 |
| Temperature 1 | 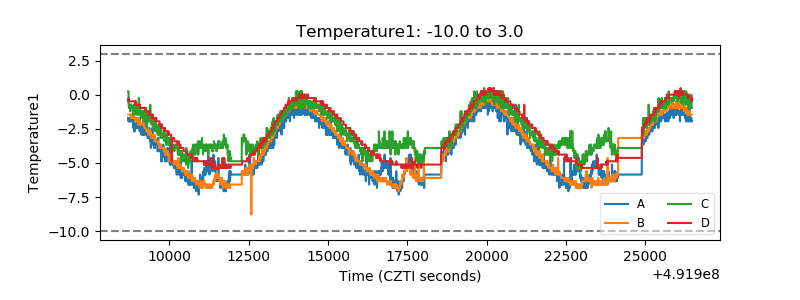 |
| Veto HV Monitor | 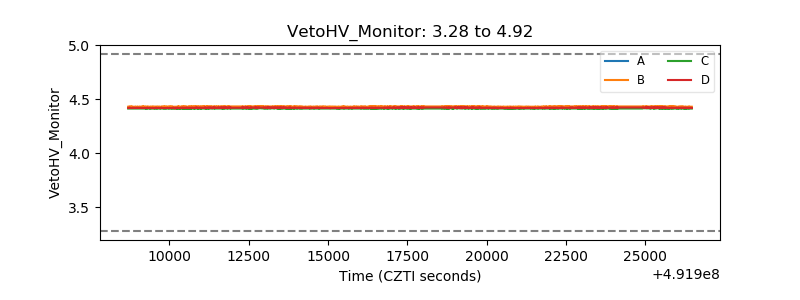 |
| Veto LLD | 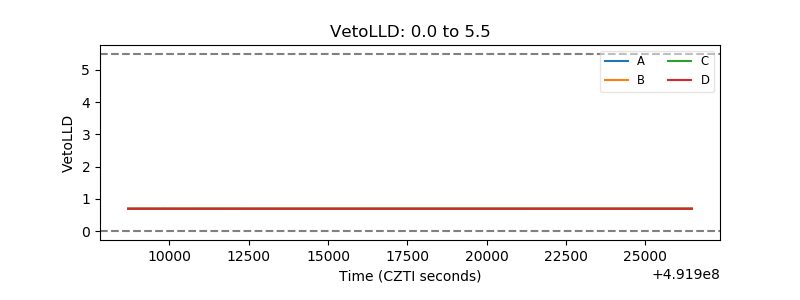 |
| Alpha Counter |  |
| _CPM_Rate | 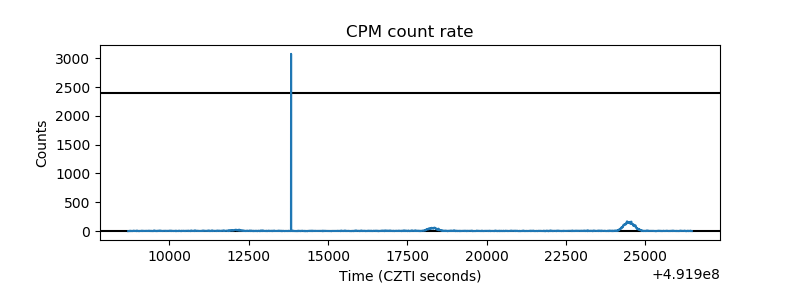 |
| CZT Counter | 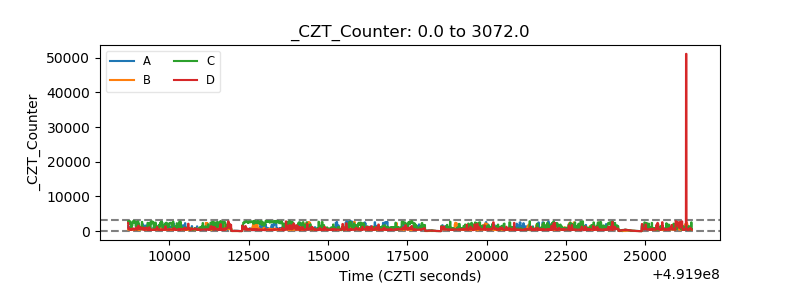 |
| +2.5 Volts monitor | 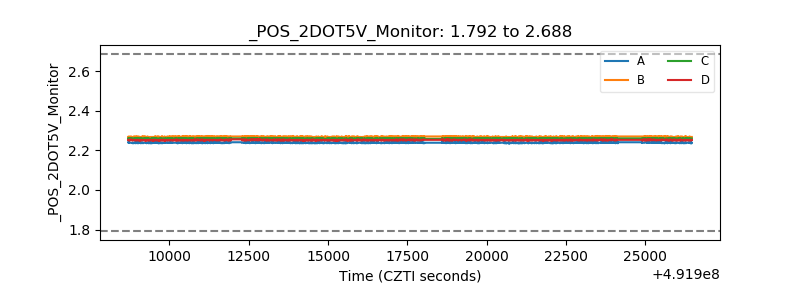 |
| +5 Volts monitor | 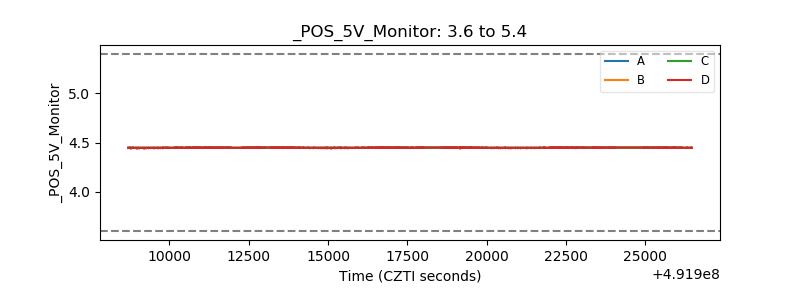 |
| _ROLL_ROT | 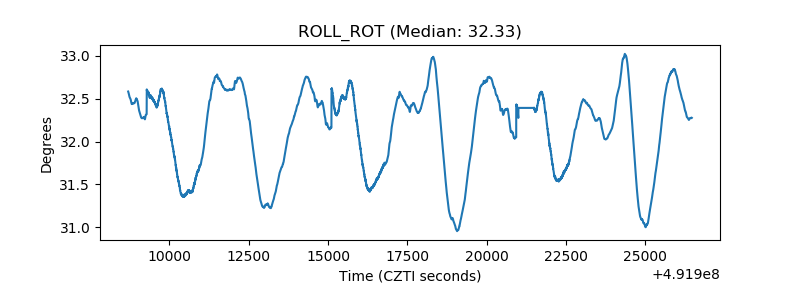 |
| _Roll_DEC | 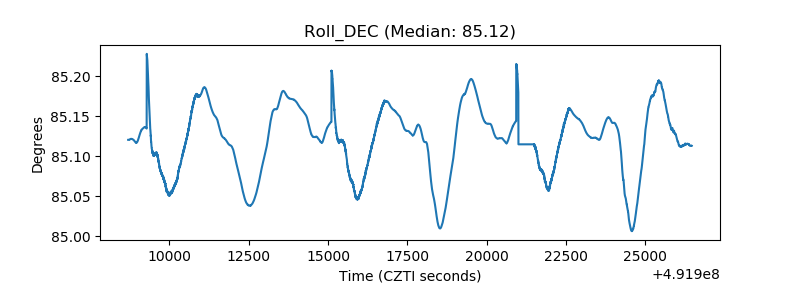 |
| _Roll_RA | 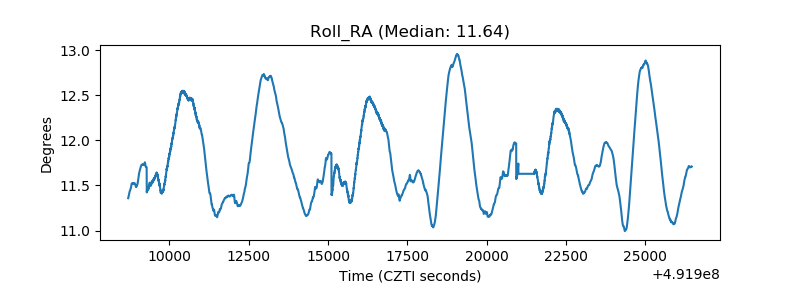 |
| Veto Counter |  |