| Param | Original file | Final file |
|---|---|---|
| Filename | modeM0/AS1C09_011T08_9000006492_53277cztM0_level2.fits | modeM0/AS1C09_011T08_9000006492_53277cztM0_level2_quad_clean.evt |
| Size (bytes) | 637,899,840 | 76,049,280 |
| Size | 608.3 MB | 72.5 MB |
| Events in quadrant A | 3,389,763 | 570,361 |
| Events in quadrant B | 3,477,560 | 597,617 |
| Events in quadrant C | 12,081,751 | 212,933 |
| Events in quadrant D | 4,196,072 | 501,158 |
| Mode M0 | |||
|---|---|---|---|
| Quadrant | BADHDUFLAG | Total packets | Discarded packets |
| A | 0 | 14304 | 1 |
| B | 0 | 14579 | 1 |
| C | 0 | 40045 | 1 |
| D | 0 | 16655 | 1 |
| Mode M9 | |||
|---|---|---|---|
| Quadrant | BADHDUFLAG | Total packets | Discarded packets |
| A | 0 | 9 | 0 |
| B | 0 | 9 | 0 |
| C | 0 | 9 | 0 |
| D | 0 | 9 | 0 |
| Mode SS | |||
|---|---|---|---|
| Quadrant | BADHDUFLAG | Total packets | Discarded packets |
| A | 0 | 122 | 0 |
| B | 0 | 122 | 0 |
| C | 0 | 122 | 0 |
| D | 0 | 122 | 0 |
| Quadrant | Total seconds | Saturated seconds | Saturation percentage |
|---|---|---|---|
| A | 6019 | 182 | 3.023758% |
| B | 6019 | 258 | 4.286426% |
| C | 6020 | 3791 | 62.973422% |
| D | 6020 | 290 | 4.817276% |
Noise dominated data is calculated using 1-second bins in cleaned event files. If a bin has >2000 counts, and if more than 50% of those come from <1% of pixels, then it is considered to be noise-dominated and hence unusable.
| Quadrant | # 1 sec bins | Bins with >0 counts | Bins with >2000 counts | High rate bins dominated by noise | Noise dominated (total time) | Noise dominated (detector-on time) | Marked lightcurve |
|---|---|---|---|---|---|---|---|
| A | 6919 | 6019 | 112 | 112 | 1.62% | 1.86% | 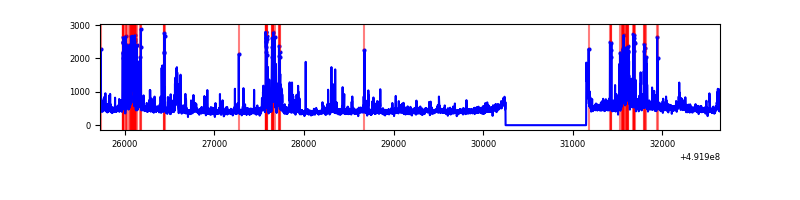 |
| B | 6919 | 6019 | 173 | 173 | 2.50% | 2.87% | 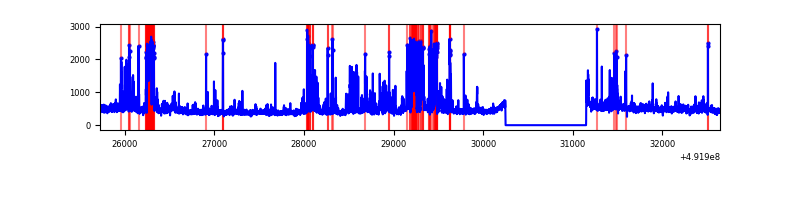 |
| C | 6919 | 6019 | 3779 | 3779 | 54.62% | 62.78% | 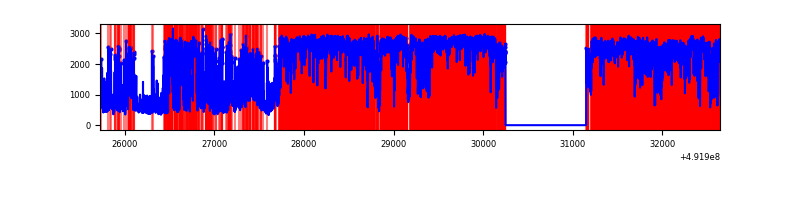 |
| D | 6920 | 6020 | 251 | 251 | 3.63% | 4.17% | 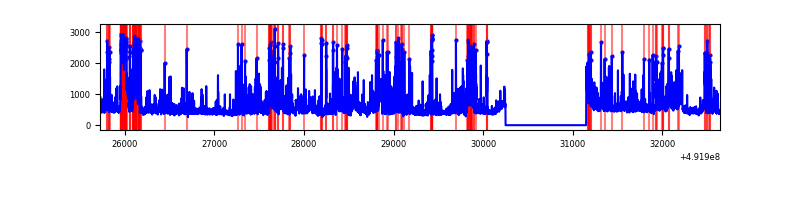 |
Top three noisy pixels from each quadrant. If the there are fewer than three noisy pixels in the level2.evt file, extra rows are filled as -1
| Pixel properties | Quadrant properties | ||||||
|---|---|---|---|---|---|---|---|
| Quadrant | DetID | PixID | Counts | Sigma | Mean | Median | Sigma |
| A | 3 | 62 | 290430 | 1841.3 | 630 | 616 | 157.4 |
| A | 3 | 14 | 148003 | 936.41 | 630 | 616 | 157.4 |
| A | 0 | 8 | 118040 | 746.04 | 630 | 616 | 157.4 |
| B | 2 | 249 | 296275 | 2215.36 | 623 | 602 | 133.5 |
| B | 10 | 28 | 249749 | 1866.76 | 623 | 602 | 133.5 |
| B | 4 | 81 | 178294 | 1331.37 | 623 | 602 | 133.5 |
| C | 1 | 241 | 6887167 | 61012.0 | 406 | 403 | 112.9 |
| C | 10 | 22 | 986274 | 8734.14 | 406 | 403 | 112.9 |
| C | 15 | 224 | 631157 | 5588.05 | 406 | 403 | 112.9 |
| D | 3 | 12 | 558373 | 3188.41 | 609 | 582 | 174.9 |
| D | 11 | 176 | 340964 | 1945.67 | 609 | 582 | 174.9 |
| D | 12 | 128 | 212721 | 1212.61 | 609 | 582 | 174.9 |
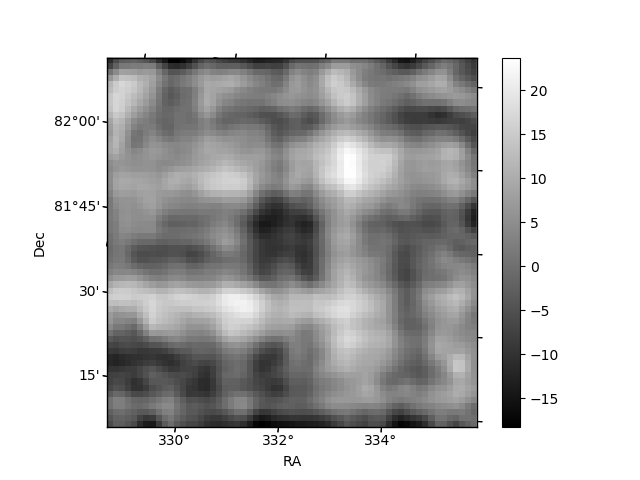
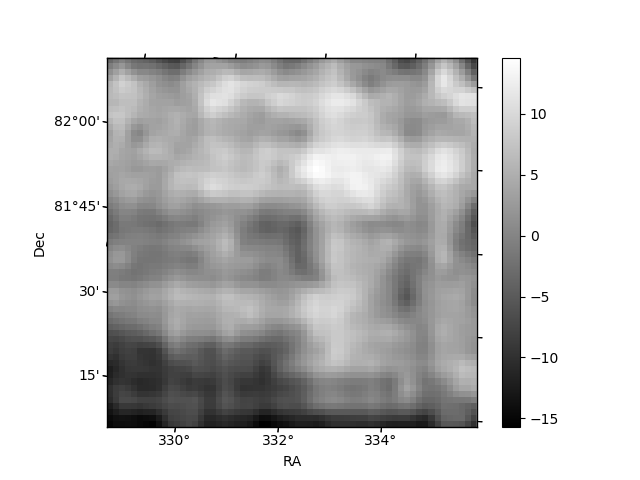
Histogram calculated using DETX and DETY for each event in the final _common_clean file
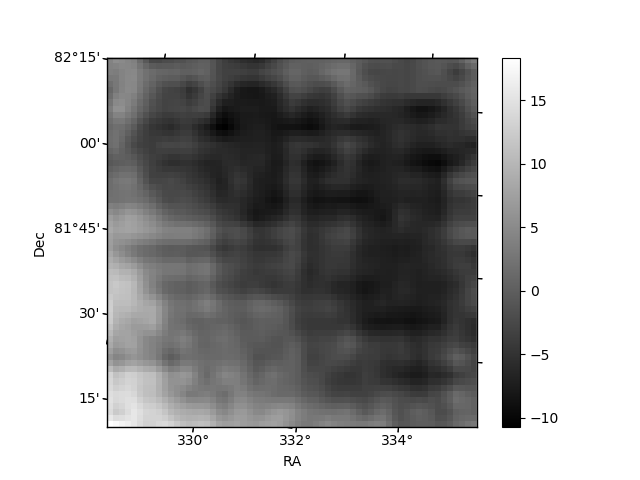
| Quadrant A | 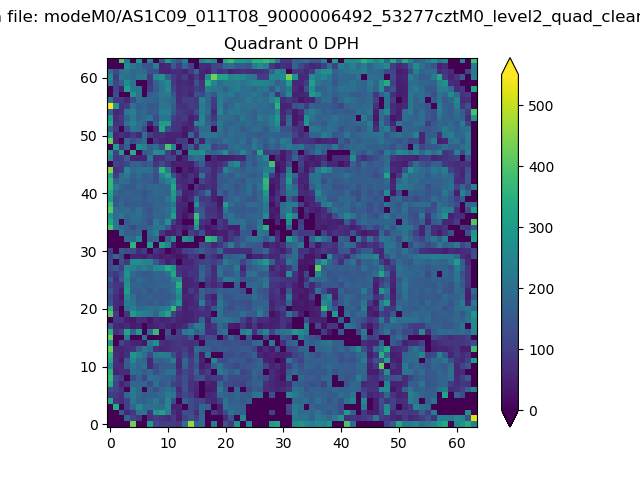 |
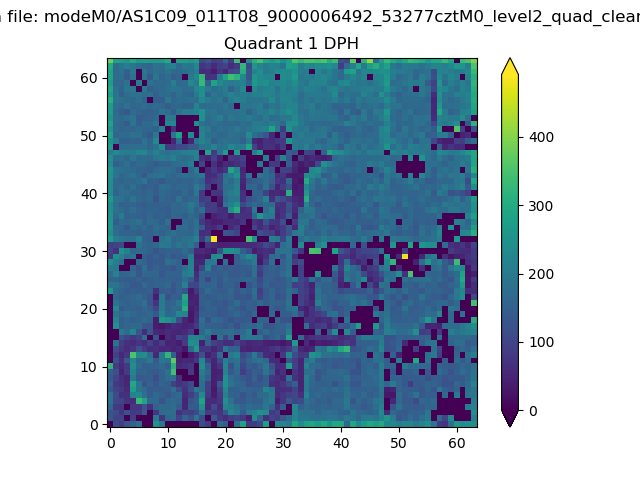 |
Quadrant B |
|---|---|---|---|
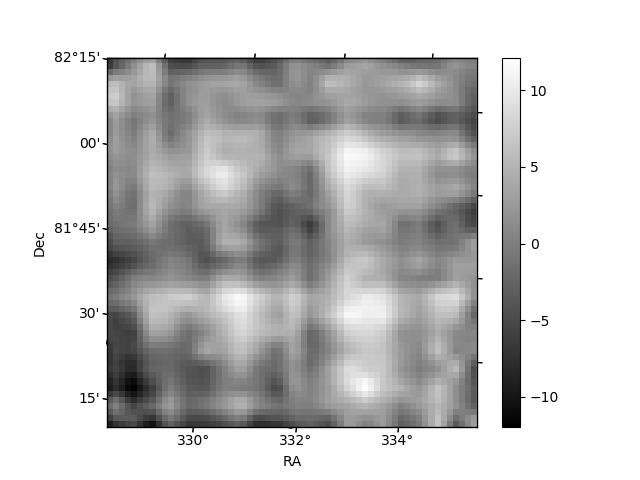
| Quadrant D | 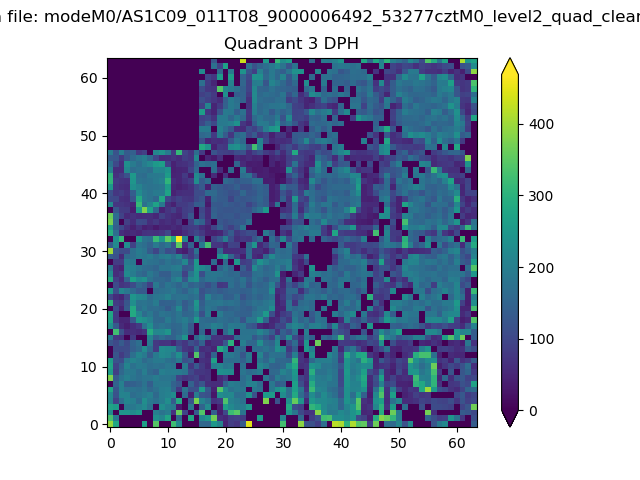 |
 |
Quadrant C |
| Plot type | Count rate plots | Images |
|---|---|---|
| Comparison with Poisson distribution Blue bars denote a histogram of data divided into 1 sec bins. Red curve is a Poisson curve with rate = median count rate of data. |
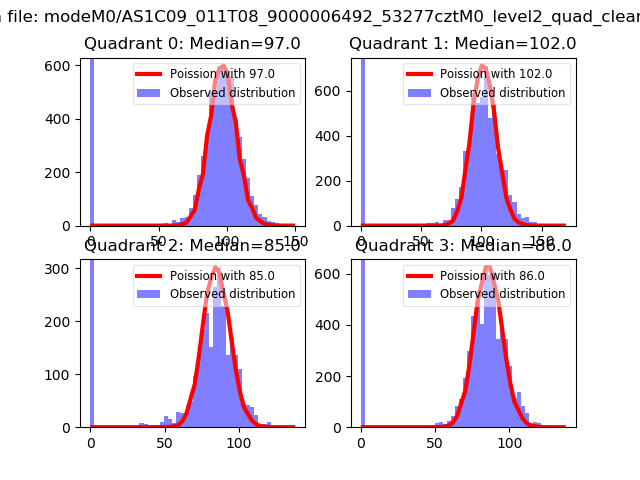 |
 |
| Quadrant-wise count rates Data is divided into 100 sec bins |
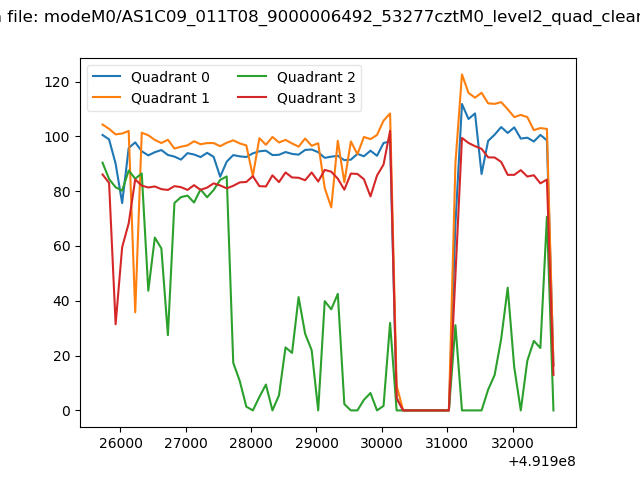 |
|
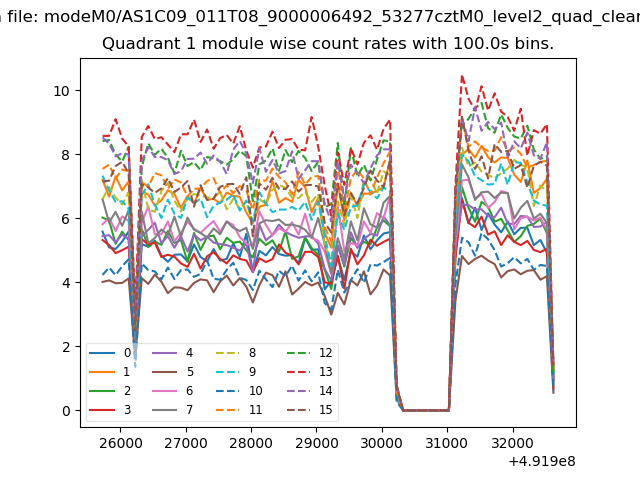
| Module-wise count rates for Quadrant A Data is divided into 100 sec bins |
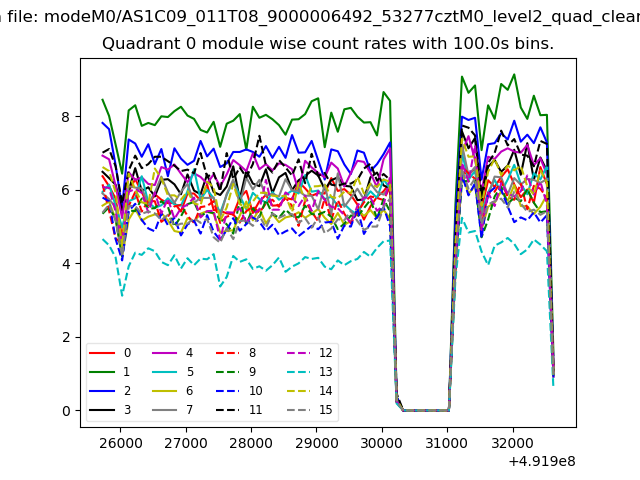 |
 |
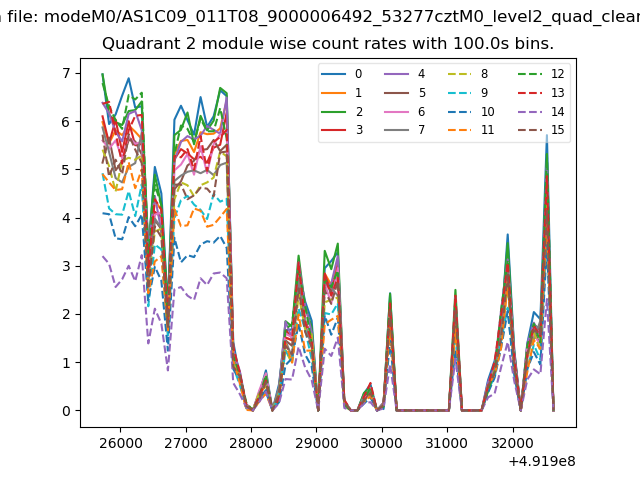
| Module-wise count rates for Quadrant B Data is divided into 100 sec bins |
 |
 |
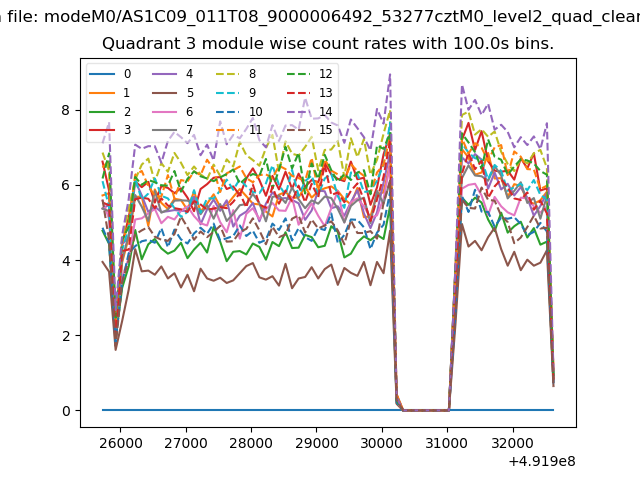
| Module-wise count rates for Quadrant C Data is divided into 100 sec bins |
 |
 |
| Module-wise count rates for Quadrant D Data is divided into 100 sec bins |
 |
 |
| Parameter | Plot |
|---|---|
| CZT HV Monitor | 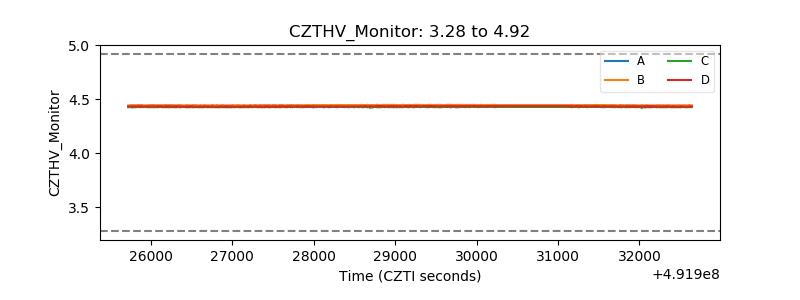 |
| D_VDD | 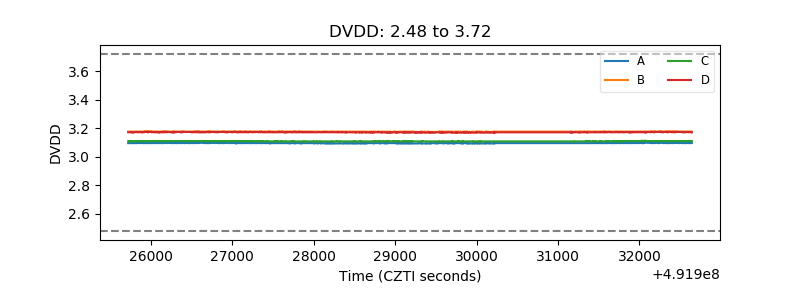 |
| Temperature 1 | 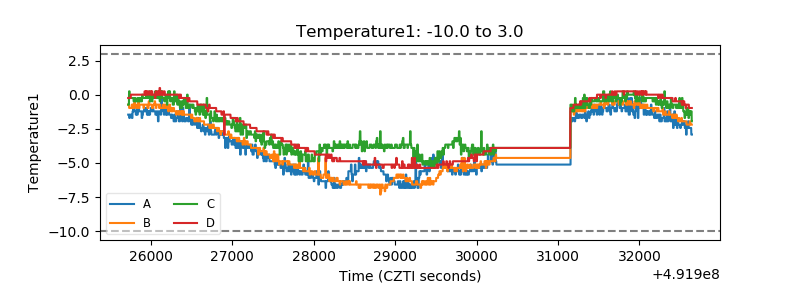 |
| Veto HV Monitor | 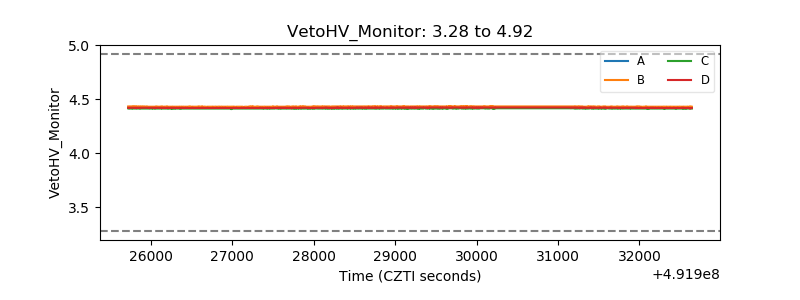 |
| Veto LLD | 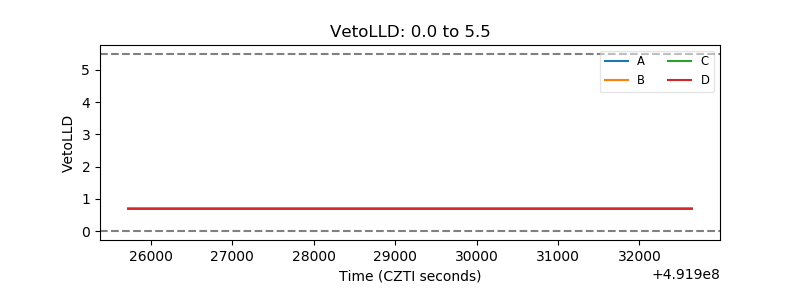 |
| Alpha Counter | 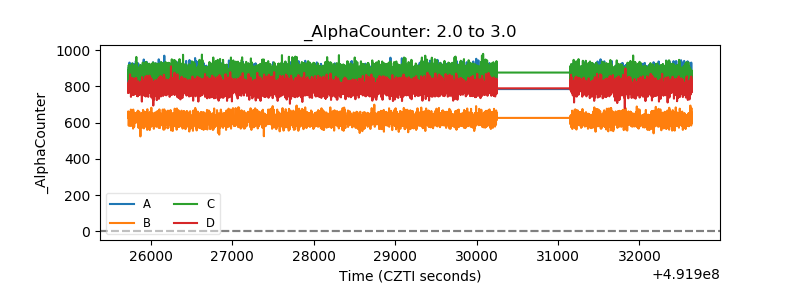 |
| _CPM_Rate | 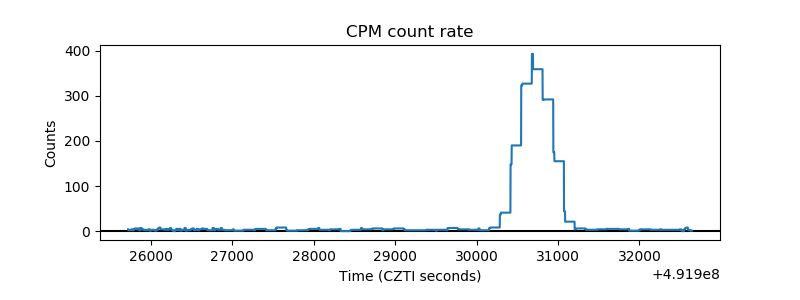 |
| CZT Counter | 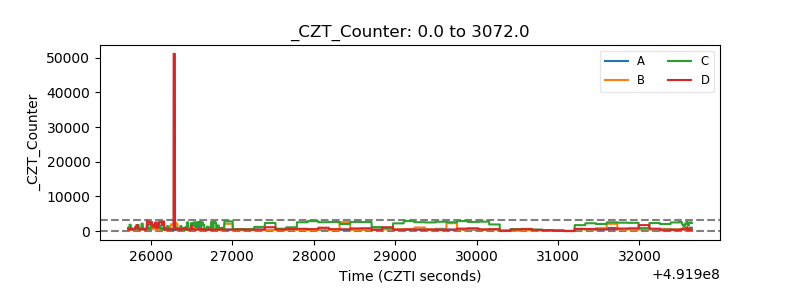 |
| +2.5 Volts monitor |  |
| +5 Volts monitor |  |
| _ROLL_ROT |  |
| _Roll_DEC | 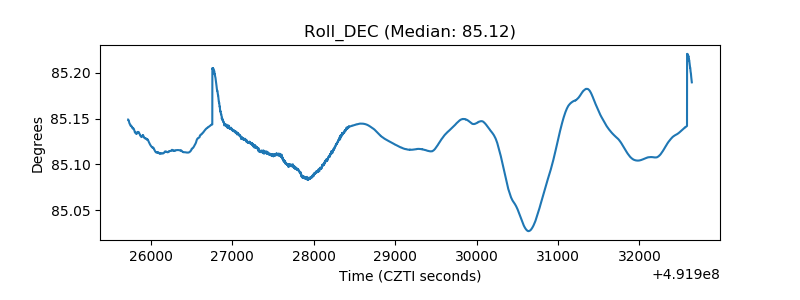 |
| _Roll_RA | 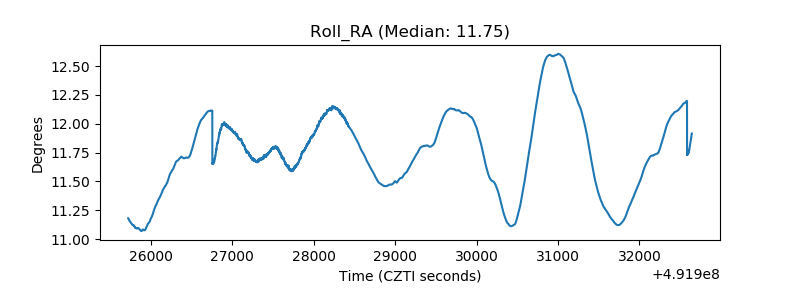 |
| Veto Counter | 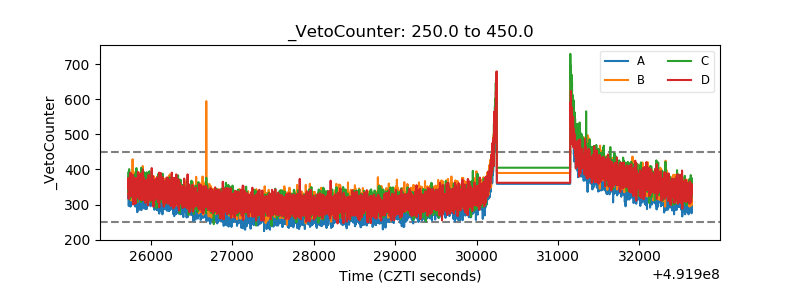 |