| Param | Original file | Final file |
|---|---|---|
| Filename | modeM0/AS1C09_011T08_9000006492_53279cztM0_level2.fits | modeM0/AS1C09_011T08_9000006492_53279cztM0_level2_quad_clean.evt |
| Size (bytes) | 528,978,240 | 91,149,120 |
| Size | 504.5 MB | 86.9 MB |
| Events in quadrant A | 3,453,371 | 622,145 |
| Events in quadrant B | 4,124,095 | 659,423 |
| Events in quadrant C | 7,701,231 | 469,084 |
| Events in quadrant D | 3,805,644 | 562,977 |
| Mode M0 | |||
|---|---|---|---|
| Quadrant | BADHDUFLAG | Total packets | Discarded packets |
| A | 0 | 14748 | 1 |
| B | 0 | 16662 | 1 |
| C | 0 | 27345 | 1 |
| D | 0 | 15934 | 1 |
| Mode M9 | |||
|---|---|---|---|
| Quadrant | BADHDUFLAG | Total packets | Discarded packets |
| A | 0 | 11 | 0 |
| B | 0 | 11 | 0 |
| C | 0 | 11 | 0 |
| D | 0 | 11 | 0 |
| Mode SS | |||
|---|---|---|---|
| Quadrant | BADHDUFLAG | Total packets | Discarded packets |
| A | 0 | 130 | 0 |
| B | 0 | 130 | 0 |
| C | 0 | 130 | 0 |
| D | 0 | 130 | 0 |
| Quadrant | Total seconds | Saturated seconds | Saturation percentage |
|---|---|---|---|
| A | 6396 | 136 | 2.126329% |
| B | 6396 | 215 | 3.361476% |
| C | 6395 | 1495 | 23.377639% |
| D | 6395 | 162 | 2.533229% |
Noise dominated data is calculated using 1-second bins in cleaned event files. If a bin has >2000 counts, and if more than 50% of those come from <1% of pixels, then it is considered to be noise-dominated and hence unusable.
| Quadrant | # 1 sec bins | Bins with >0 counts | Bins with >2000 counts | High rate bins dominated by noise | Noise dominated (total time) | Noise dominated (detector-on time) | Marked lightcurve |
|---|---|---|---|---|---|---|---|
| A | 7441 | 6396 | 70 | 70 | 0.94% | 1.09% | 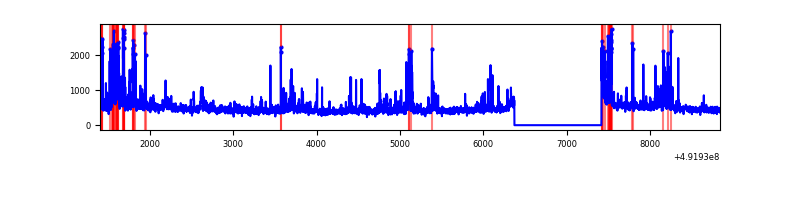 |
| B | 7440 | 6395 | 140 | 140 | 1.88% | 2.19% | 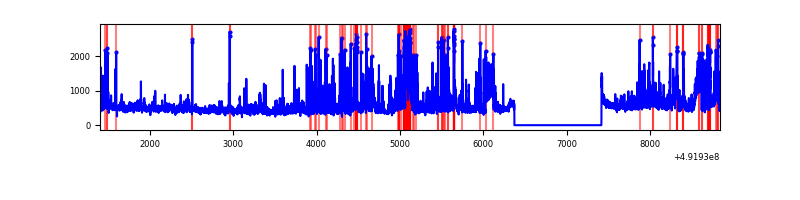 |
| C | 7440 | 6395 | 1434 | 1434 | 19.27% | 22.42% | 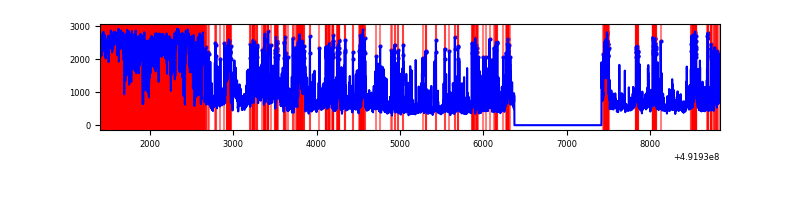 |
| D | 7440 | 6395 | 122 | 122 | 1.64% | 1.91% | 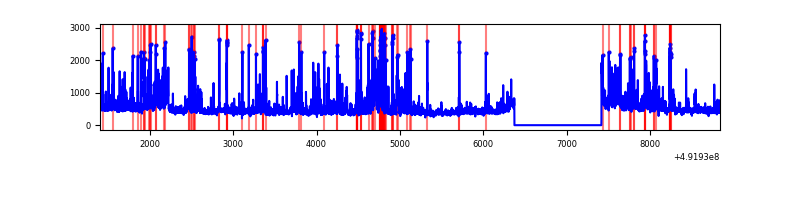 |
Top three noisy pixels from each quadrant. If the there are fewer than three noisy pixels in the level2.evt file, extra rows are filled as -1
| Pixel properties | Quadrant properties | ||||||
|---|---|---|---|---|---|---|---|
| Quadrant | DetID | PixID | Counts | Sigma | Mean | Median | Sigma |
| A | 3 | 14 | 202671 | 1180.44 | 680 | 663 | 171.1 |
| A | 4 | 249 | 128550 | 747.31 | 680 | 663 | 171.1 |
| A | 3 | 62 | 102018 | 592.27 | 680 | 663 | 171.1 |
| B | 10 | 28 | 389455 | 2709.93 | 672 | 649 | 143.5 |
| B | 2 | 249 | 326519 | 2271.27 | 672 | 649 | 143.5 |
| B | 4 | 81 | 236224 | 1641.93 | 672 | 649 | 143.5 |
| C | 1 | 241 | 1855369 | 11210.62 | 596 | 590 | 165.4 |
| C | 10 | 22 | 1036057 | 6258.55 | 596 | 590 | 165.4 |
| C | 15 | 224 | 956367 | 5776.89 | 596 | 590 | 165.4 |
| D | 3 | 12 | 328168 | 1745.56 | 662 | 634 | 187.6 |
| D | 11 | 245 | 189643 | 1007.3 | 662 | 634 | 187.6 |
| D | 6 | 239 | 142263 | 754.8 | 662 | 634 | 187.6 |
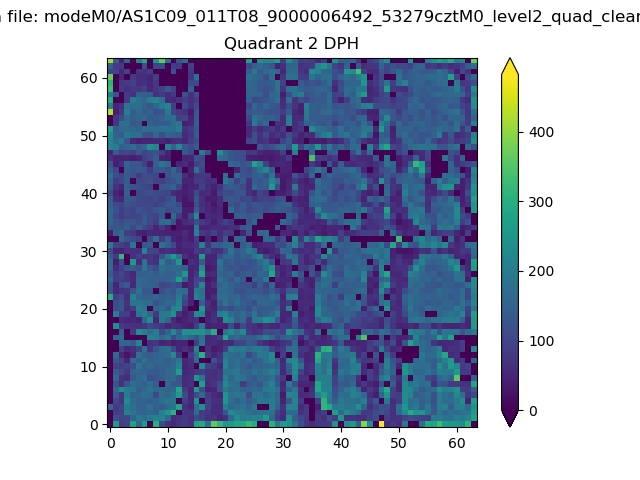
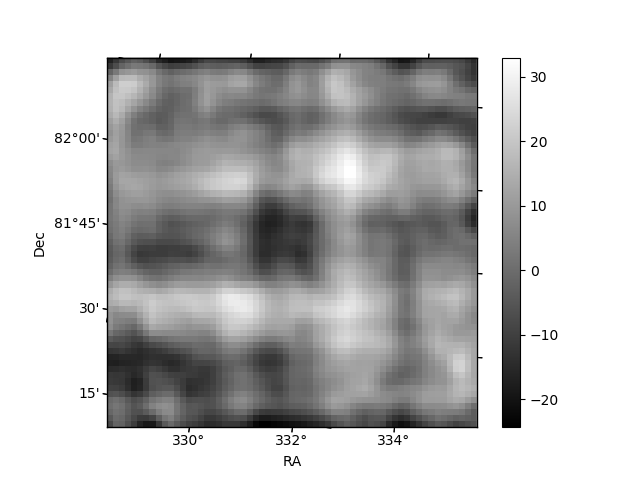
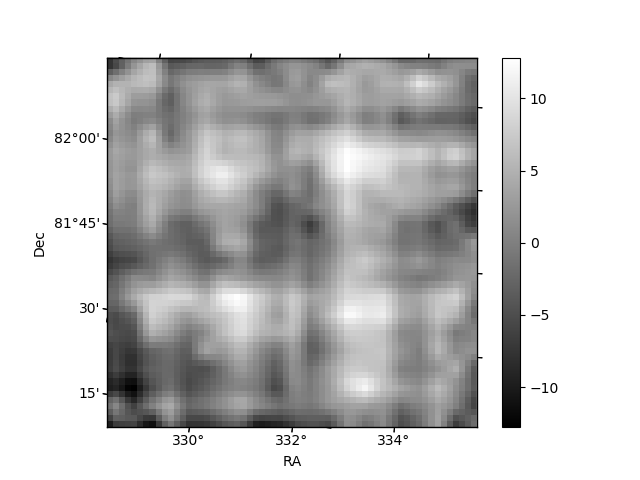
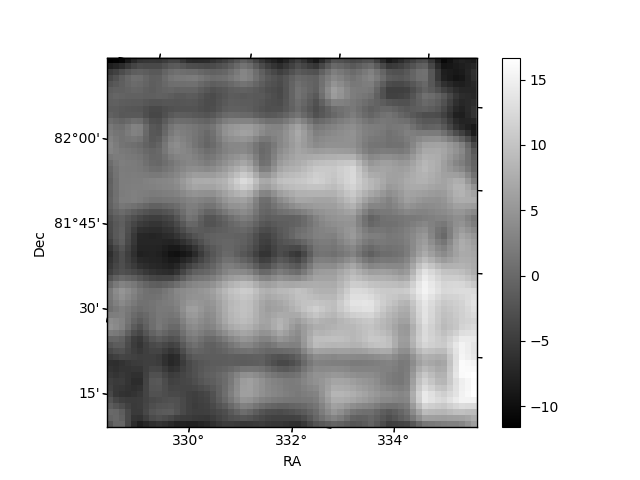
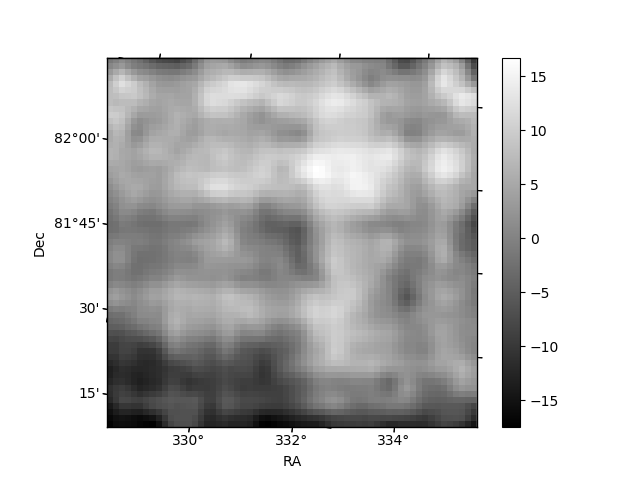
Histogram calculated using DETX and DETY for each event in the final _common_clean file
| Quadrant A | 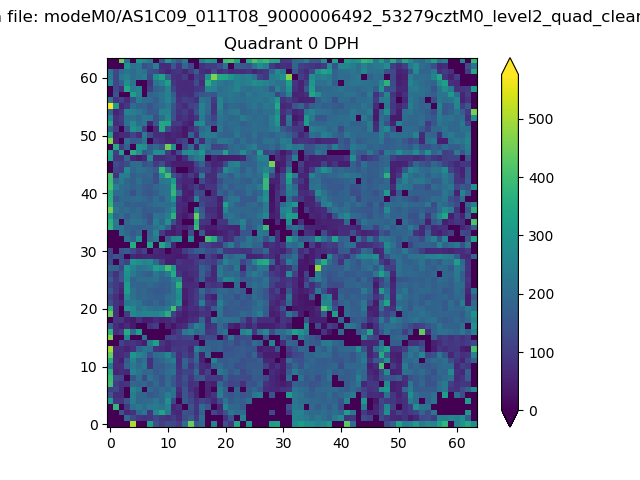 |
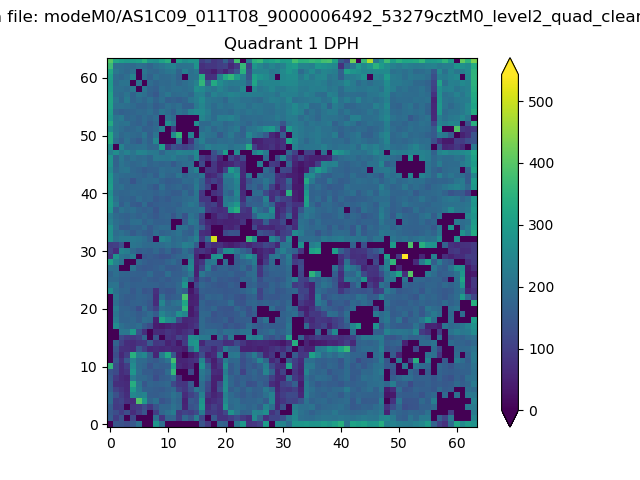 |
Quadrant B |
|---|---|---|---|
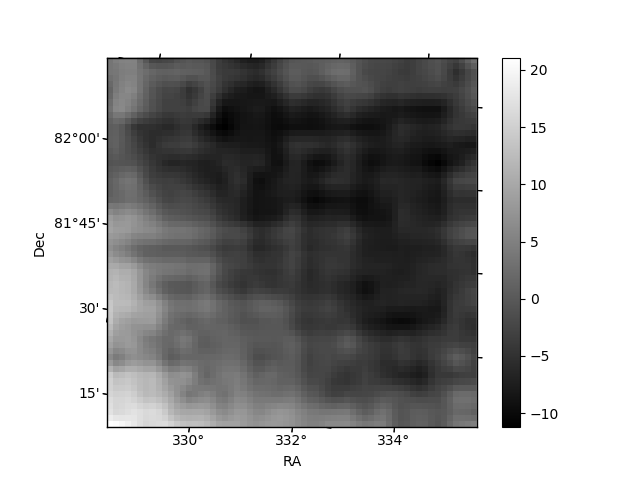
| Quadrant D | 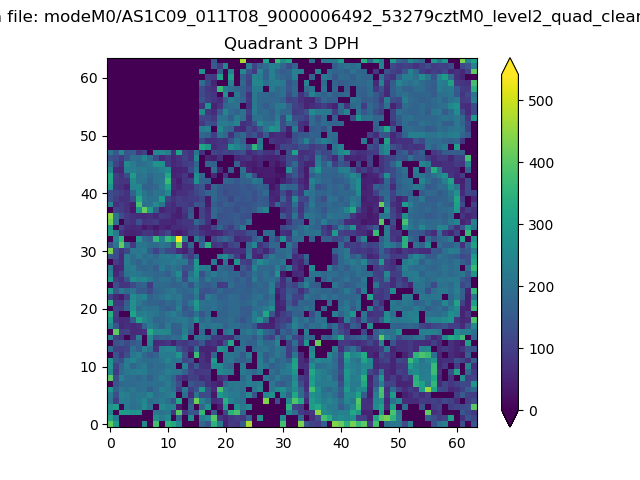 |
 |
Quadrant C |
| Plot type | Count rate plots | Images |
|---|---|---|
| Comparison with Poisson distribution Blue bars denote a histogram of data divided into 1 sec bins. Red curve is a Poisson curve with rate = median count rate of data. |
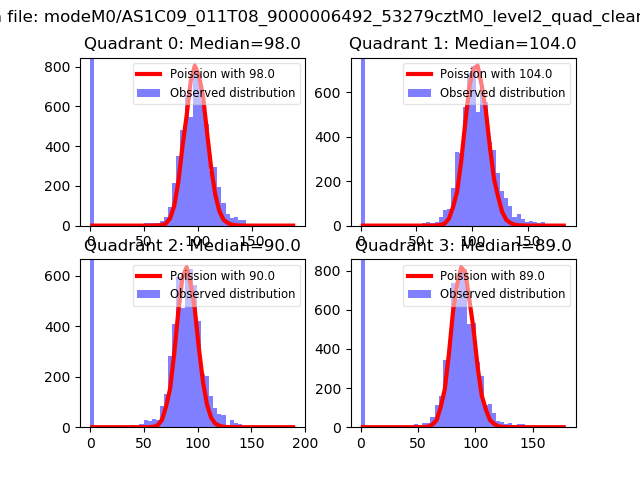 |
 |
| Quadrant-wise count rates Data is divided into 100 sec bins |
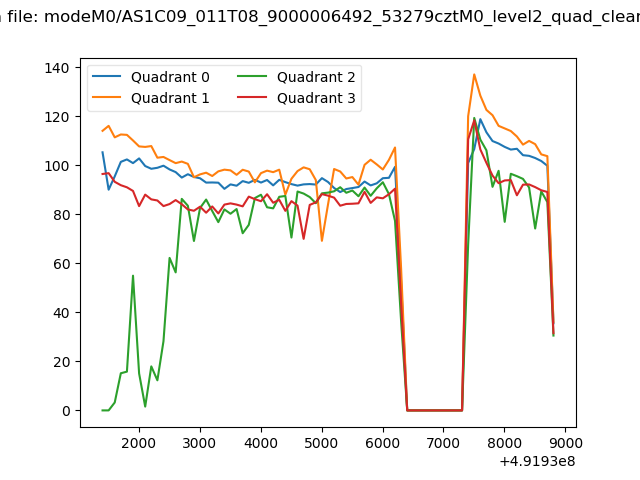 |
|
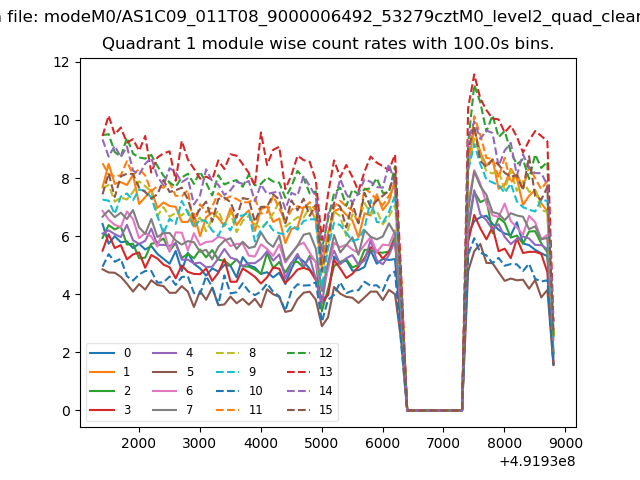
| Module-wise count rates for Quadrant A Data is divided into 100 sec bins |
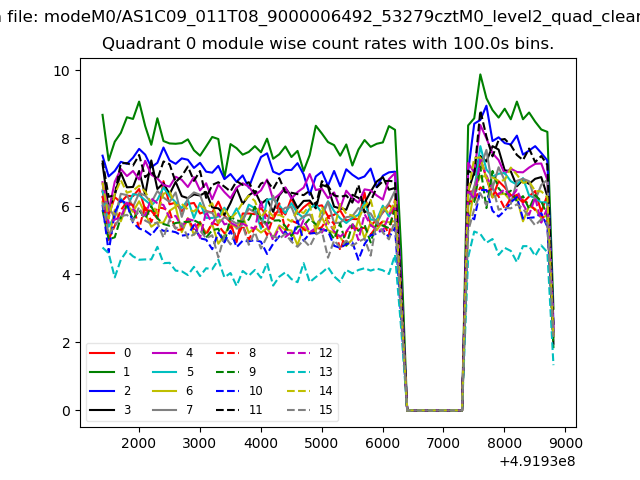 |
 |
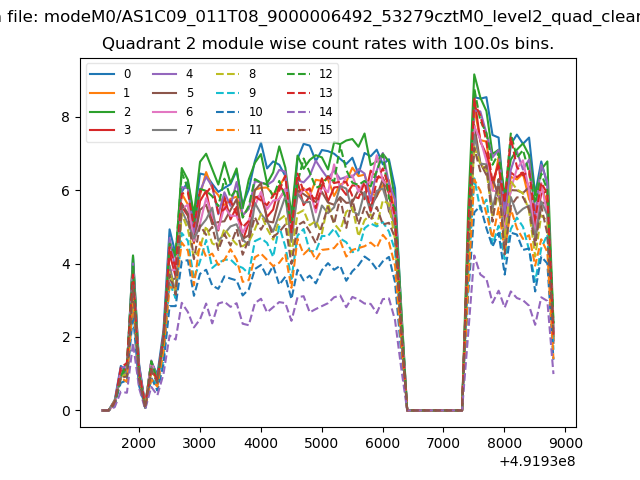
| Module-wise count rates for Quadrant B Data is divided into 100 sec bins |
 |
 |
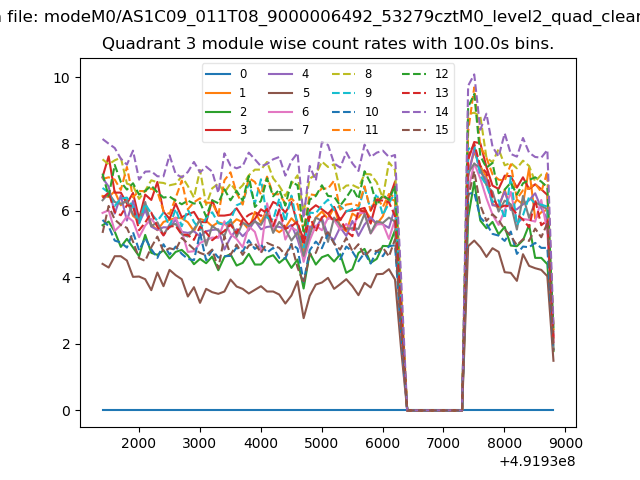
| Module-wise count rates for Quadrant C Data is divided into 100 sec bins |
 |
 |
| Module-wise count rates for Quadrant D Data is divided into 100 sec bins |
 |
 |
| Parameter | Plot |
|---|---|
| CZT HV Monitor | 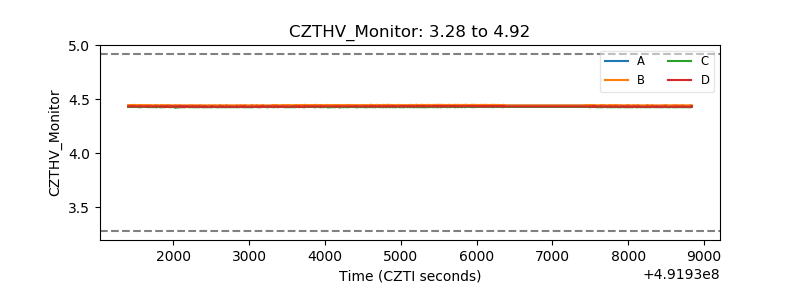 |
| D_VDD | 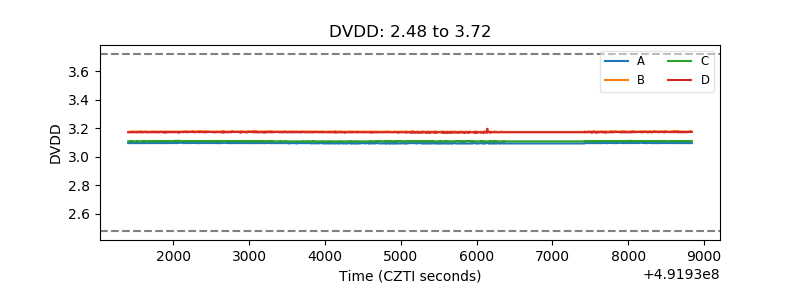 |
| Temperature 1 | 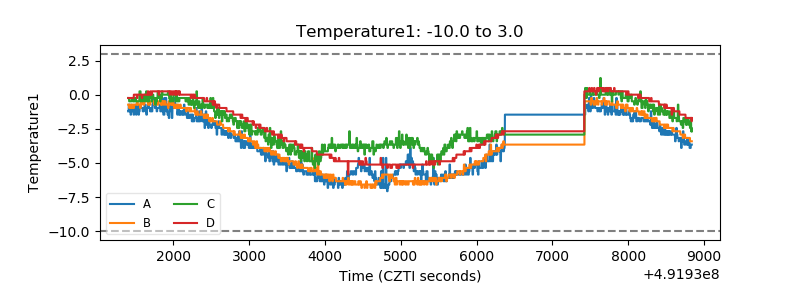 |
| Veto HV Monitor | 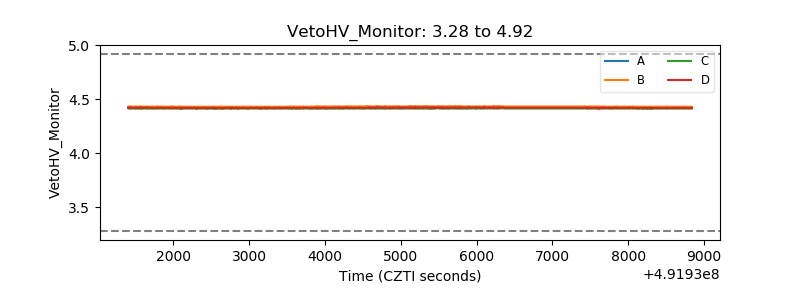 |
| Veto LLD | 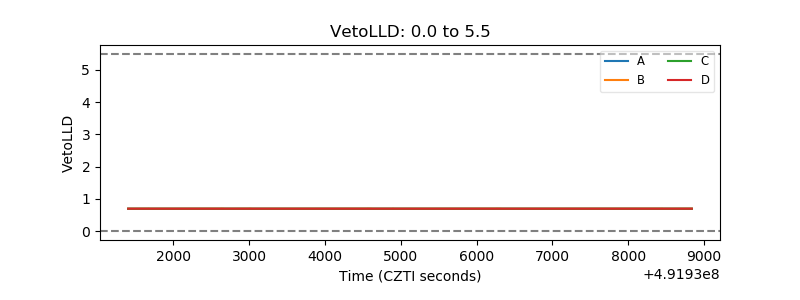 |
| Alpha Counter | 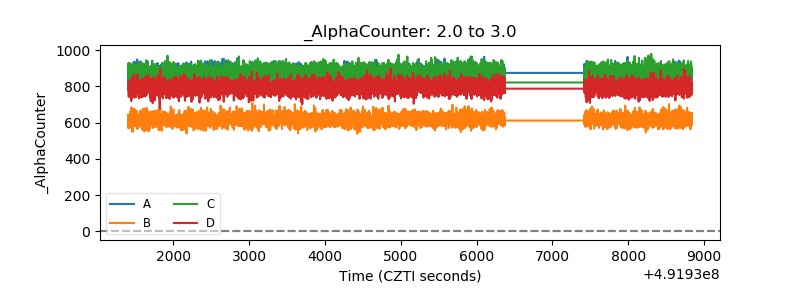 |
| _CPM_Rate | 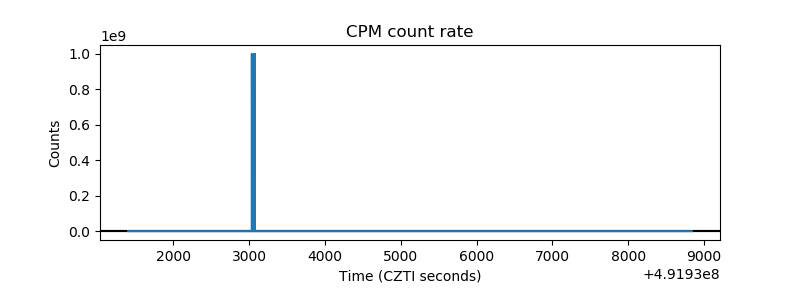 |
| CZT Counter | 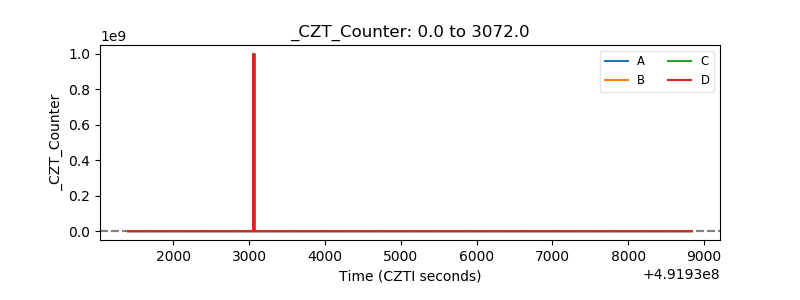 |
| +2.5 Volts monitor | 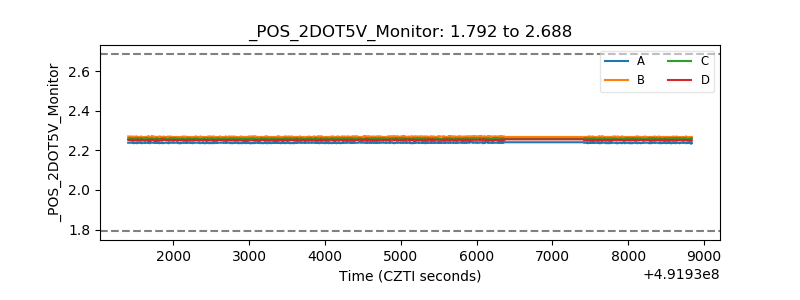 |
| +5 Volts monitor | 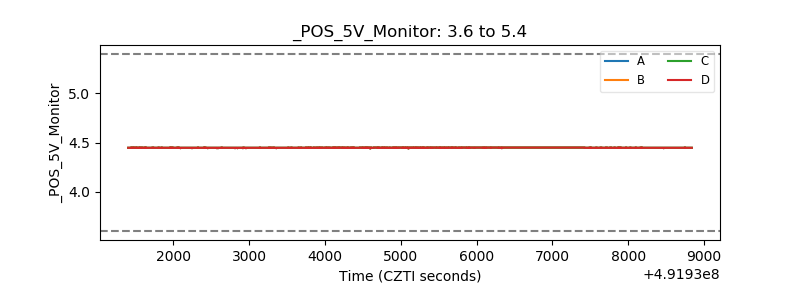 |
| _ROLL_ROT | 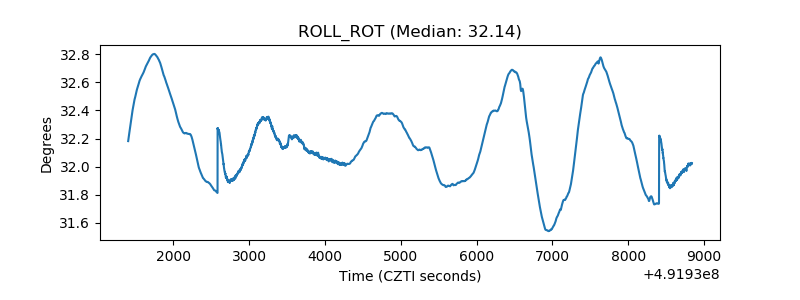 |
| _Roll_DEC | 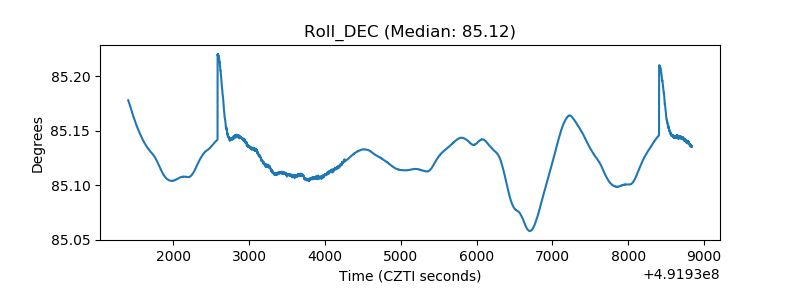 |
| _Roll_RA | 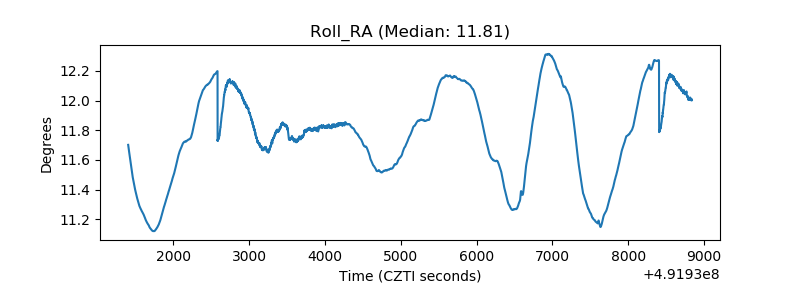 |
| Veto Counter | 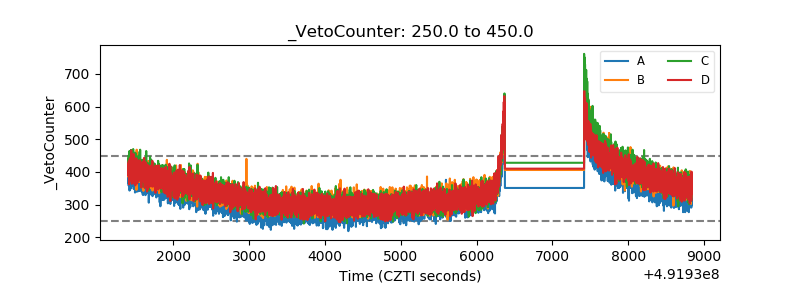 |