| Param | Original file | Final file |
|---|---|---|
| Filename | modeM0/AS1C09_011T08_9000006492_53280cztM0_level2.fits | modeM0/AS1C09_011T08_9000006492_53280cztM0_level2_quad_clean.evt |
| Size (bytes) | 585,400,320 | 91,500,480 |
| Size | 558.3 MB | 87.3 MB |
| Events in quadrant A | 3,266,503 | 636,246 |
| Events in quadrant B | 4,660,867 | 674,839 |
| Events in quadrant C | 9,088,090 | 442,974 |
| Events in quadrant D | 4,159,788 | 572,132 |
| Mode M0 | |||
|---|---|---|---|
| Quadrant | BADHDUFLAG | Total packets | Discarded packets |
| A | 0 | 14386 | 2 |
| B | 0 | 18154 | 2 |
| C | 0 | 31367 | 2 |
| D | 0 | 16905 | 2 |
| Mode M9 | |||
|---|---|---|---|
| Quadrant | BADHDUFLAG | Total packets | Discarded packets |
| A | 0 | 12 | 0 |
| B | 0 | 12 | 0 |
| C | 0 | 13 | 0 |
| D | 0 | 13 | 0 |
| Mode SS | |||
|---|---|---|---|
| Quadrant | BADHDUFLAG | Total packets | Discarded packets |
| A | 0 | 128 | 0 |
| B | 0 | 128 | 0 |
| C | 0 | 128 | 0 |
| D | 0 | 128 | 0 |
| Quadrant | Total seconds | Saturated seconds | Saturation percentage |
|---|---|---|---|
| A | 6372 | 126 | 1.977401% |
| B | 6372 | 292 | 4.582549% |
| C | 6372 | 1947 | 30.555556% |
| D | 6372 | 232 | 3.640929% |
Noise dominated data is calculated using 1-second bins in cleaned event files. If a bin has >2000 counts, and if more than 50% of those come from <1% of pixels, then it is considered to be noise-dominated and hence unusable.
| Quadrant | # 1 sec bins | Bins with >0 counts | Bins with >2000 counts | High rate bins dominated by noise | Noise dominated (total time) | Noise dominated (detector-on time) | Marked lightcurve |
|---|---|---|---|---|---|---|---|
| A | 7521 | 6371 | 76 | 76 | 1.01% | 1.19% | 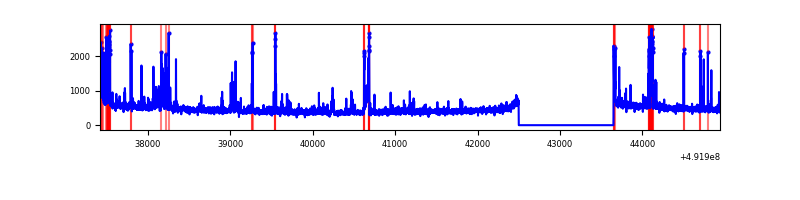 |
| B | 7521 | 6371 | 198 | 198 | 2.63% | 3.11% | 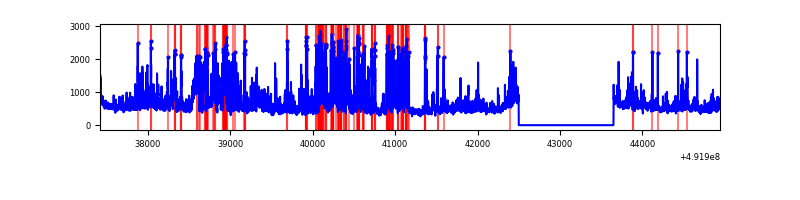 |
| C | 7521 | 6372 | 1937 | 1937 | 25.75% | 30.40% | 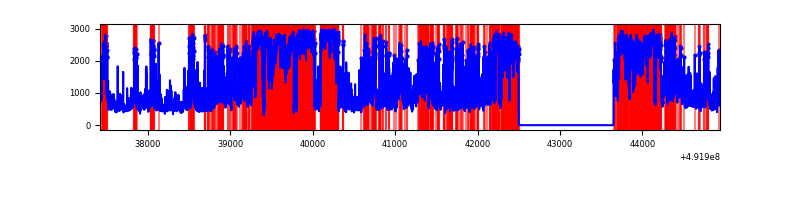 |
| D | 7521 | 6372 | 170 | 170 | 2.26% | 2.67% | 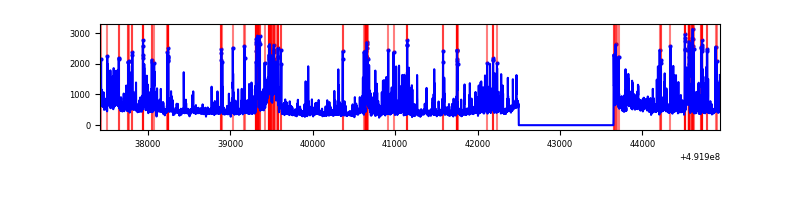 |
Top three noisy pixels from each quadrant. If the there are fewer than three noisy pixels in the level2.evt file, extra rows are filled as -1
| Pixel properties | Quadrant properties | ||||||
|---|---|---|---|---|---|---|---|
| Quadrant | DetID | PixID | Counts | Sigma | Mean | Median | Sigma |
| A | 0 | 8 | 137090 | 788.67 | 687 | 671 | 173.0 |
| A | 4 | 249 | 119778 | 688.59 | 687 | 671 | 173.0 |
| A | 3 | 14 | 78546 | 450.22 | 687 | 671 | 173.0 |
| B | 10 | 28 | 601679 | 4237.81 | 679 | 657 | 141.8 |
| B | 2 | 249 | 482571 | 3397.98 | 679 | 657 | 141.8 |
| B | 0 | 213 | 179348 | 1259.95 | 679 | 657 | 141.8 |
| C | 1 | 241 | 3325746 | 20846.38 | 580 | 575 | 159.5 |
| C | 10 | 22 | 1156035 | 7243.89 | 580 | 575 | 159.5 |
| C | 15 | 224 | 631374 | 3954.65 | 580 | 575 | 159.5 |
| D | 3 | 12 | 486249 | 2516.88 | 669 | 637 | 192.9 |
| D | 10 | 172 | 221314 | 1143.75 | 669 | 637 | 192.9 |
| D | 8 | 240 | 172898 | 892.81 | 669 | 637 | 192.9 |
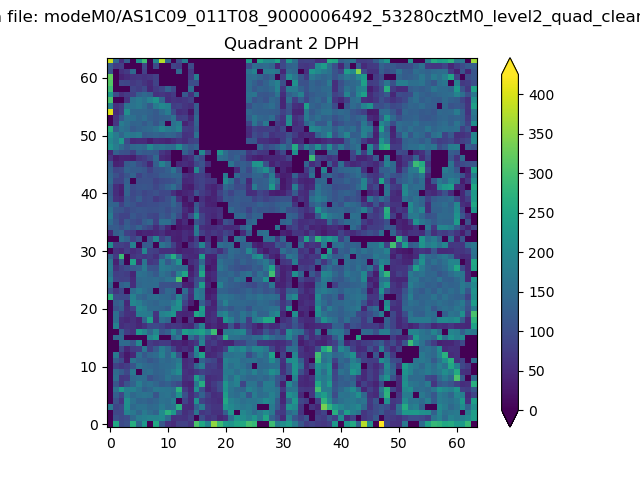
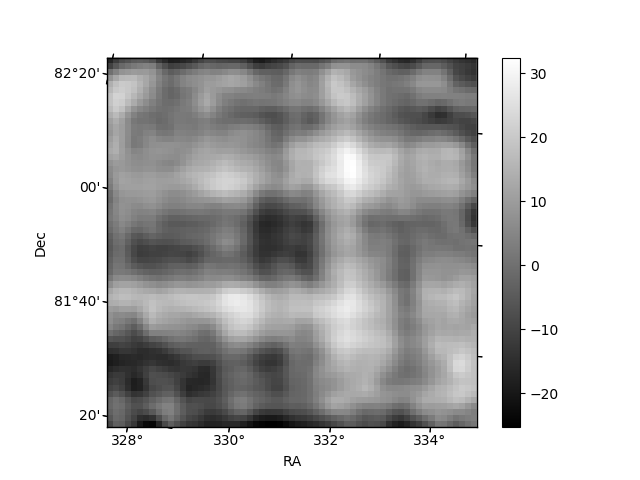
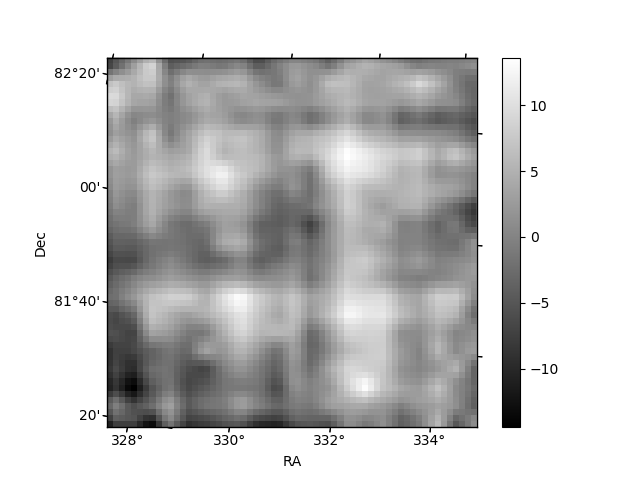
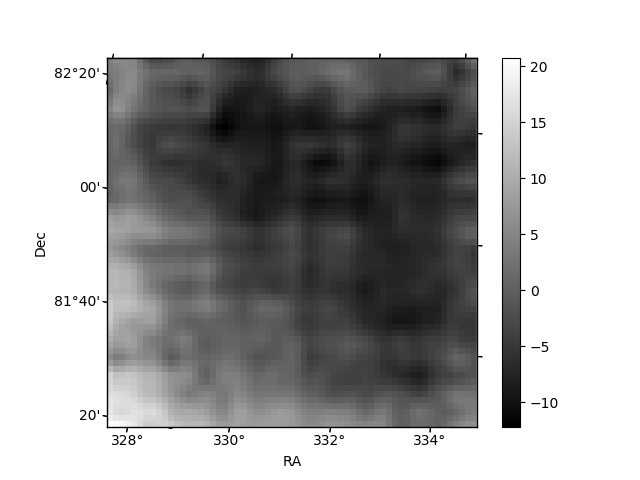
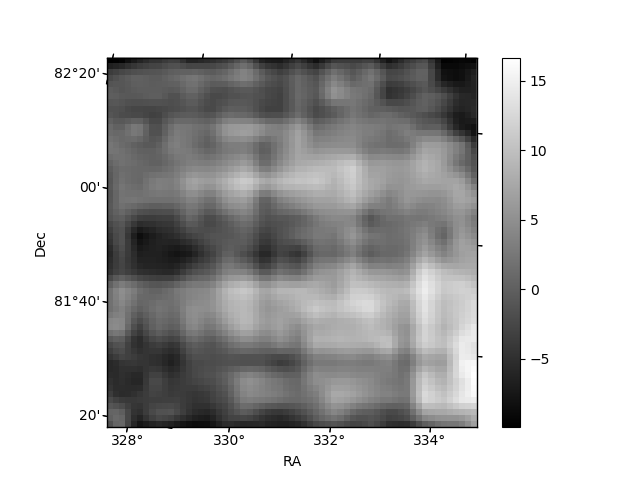
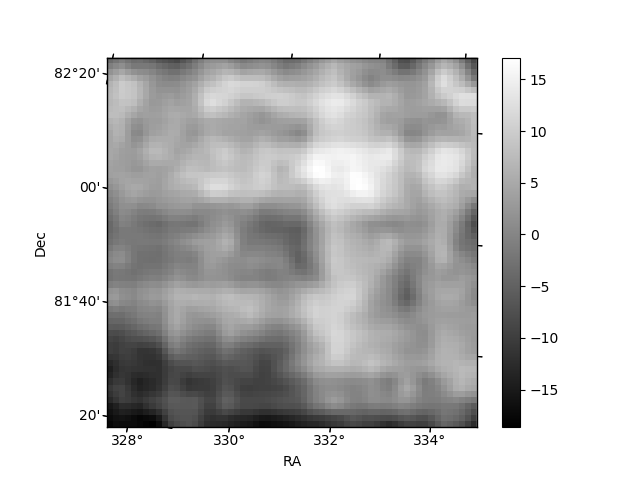
Histogram calculated using DETX and DETY for each event in the final _common_clean file
| Quadrant A | 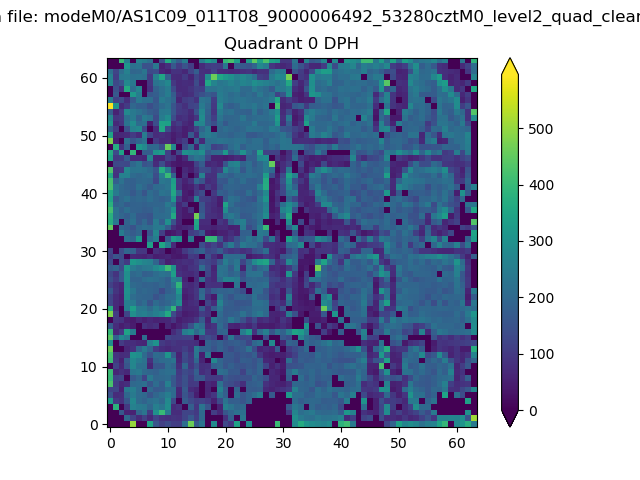 |
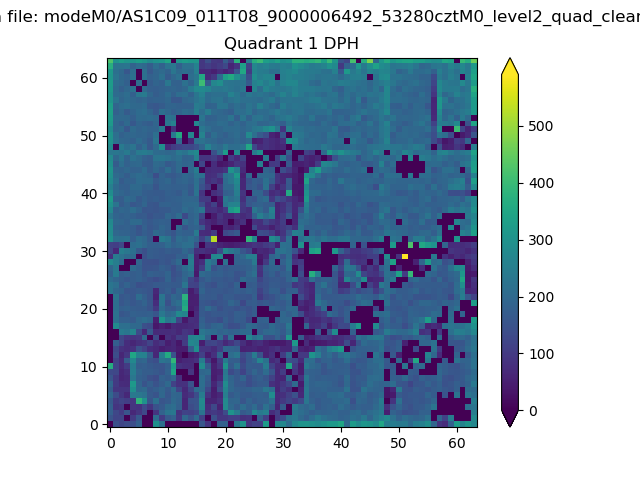 |
Quadrant B |
|---|---|---|---|
| Quadrant D | 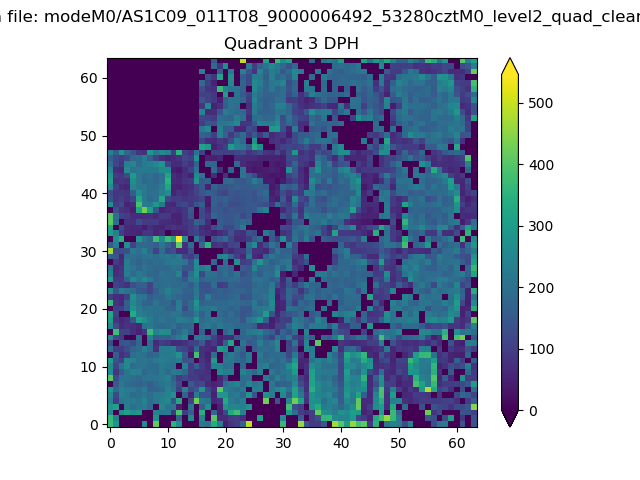 |
 |
Quadrant C |
| Plot type | Count rate plots | Images |
|---|---|---|
| Comparison with Poisson distribution Blue bars denote a histogram of data divided into 1 sec bins. Red curve is a Poisson curve with rate = median count rate of data. |
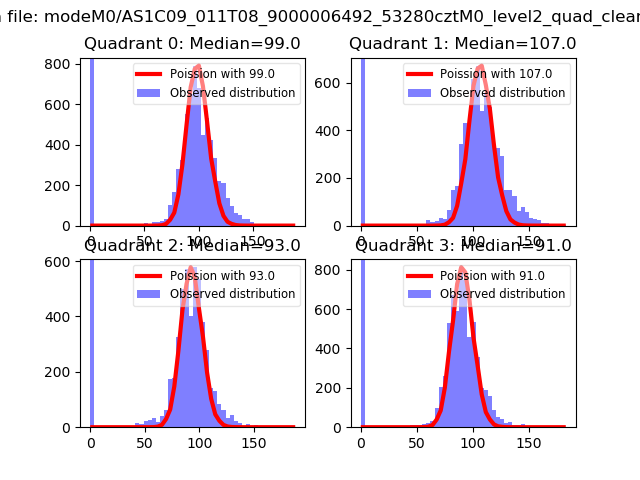 |
 |
| Quadrant-wise count rates Data is divided into 100 sec bins |
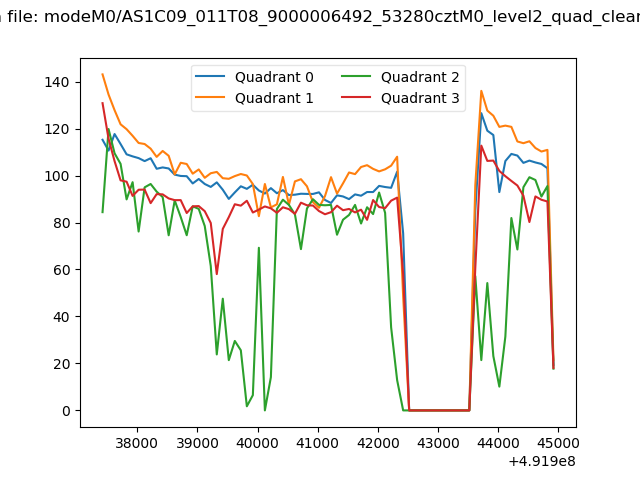 |
|
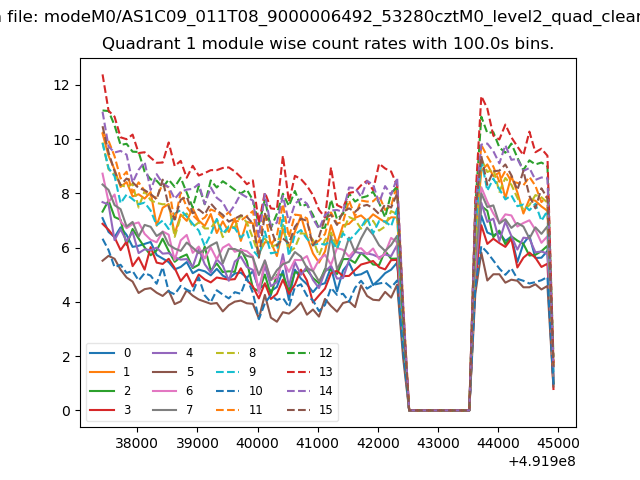
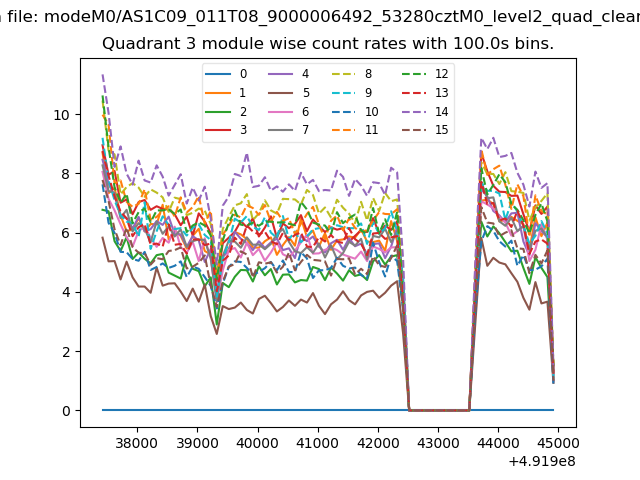
| Module-wise count rates for Quadrant A Data is divided into 100 sec bins |
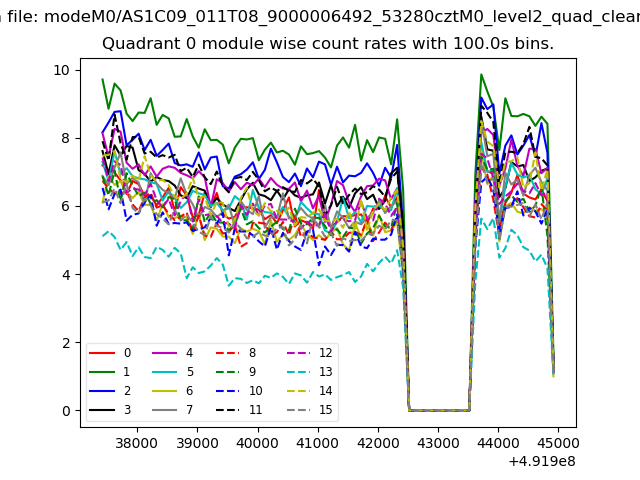 |
 |
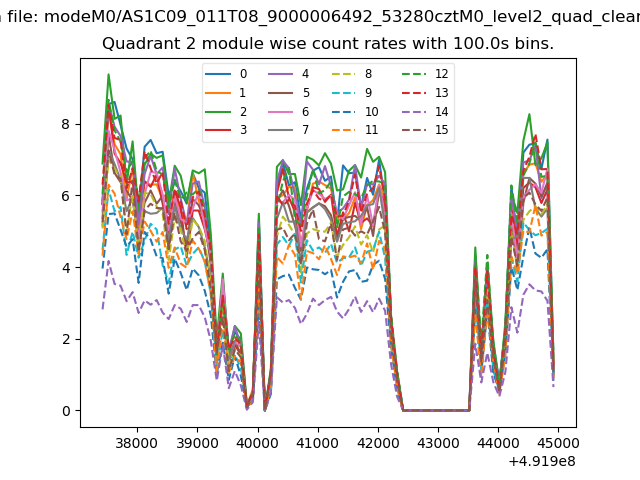
| Module-wise count rates for Quadrant B Data is divided into 100 sec bins |
 |
 |
| Module-wise count rates for Quadrant C Data is divided into 100 sec bins |
 |
 |
| Module-wise count rates for Quadrant D Data is divided into 100 sec bins |
 |
 |
| Parameter | Plot |
|---|---|
| CZT HV Monitor | 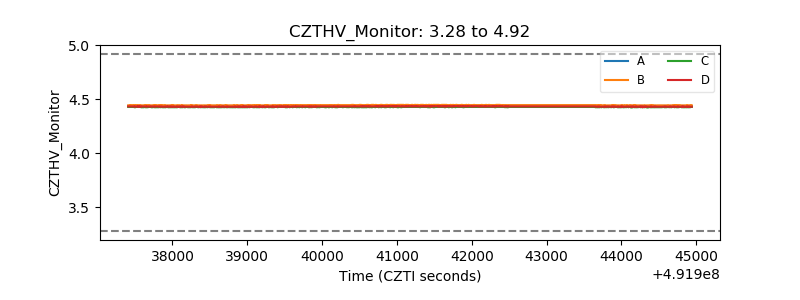 |
| D_VDD | 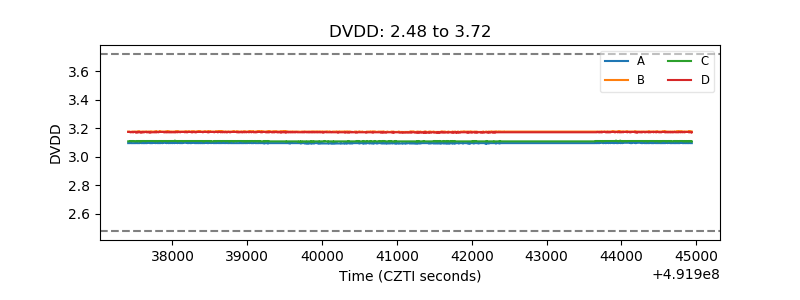 |
| Temperature 1 | 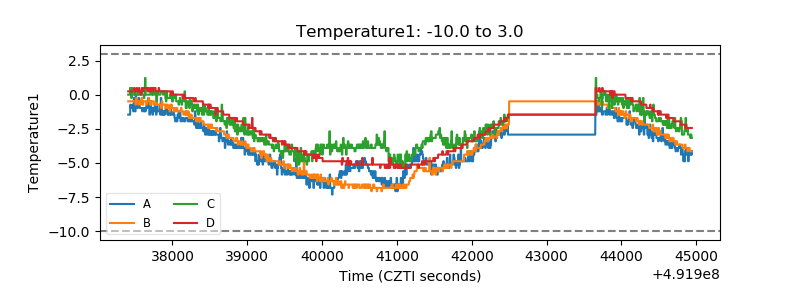 |
| Veto HV Monitor | 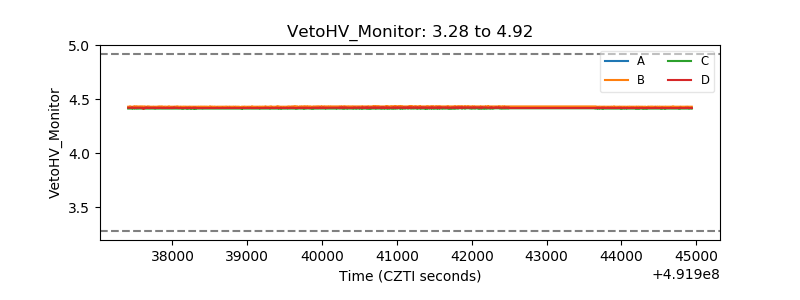 |
| Veto LLD | 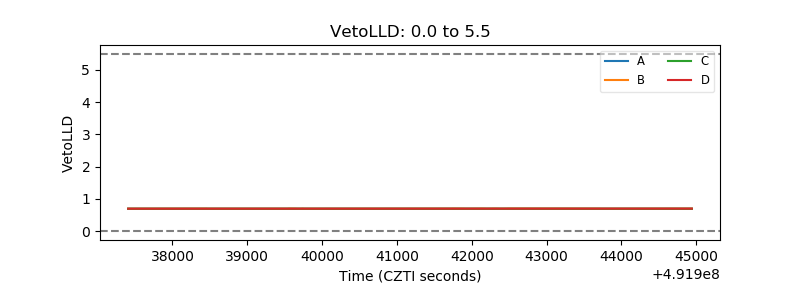 |
| Alpha Counter | 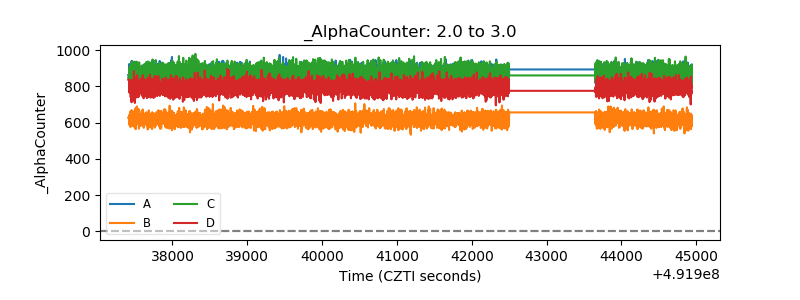 |
| _CPM_Rate | 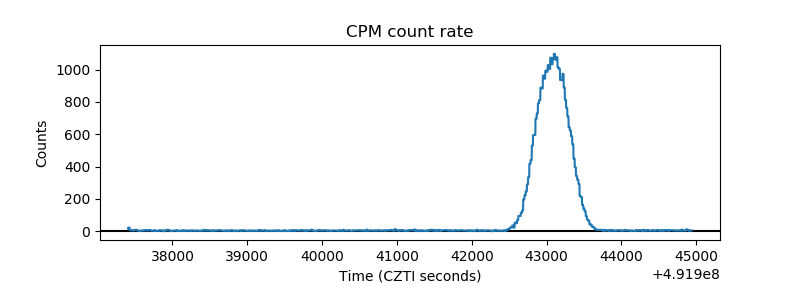 |
| CZT Counter |  |
| +2.5 Volts monitor |  |
| +5 Volts monitor |  |
| _ROLL_ROT | 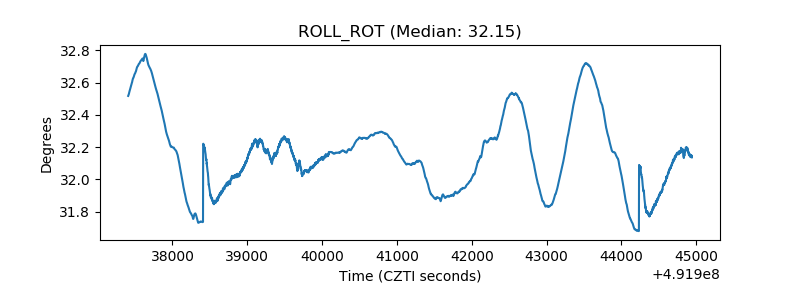 |
| _Roll_DEC | 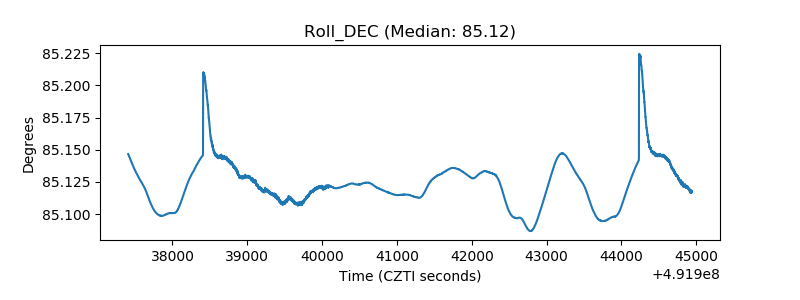 |
| _Roll_RA | 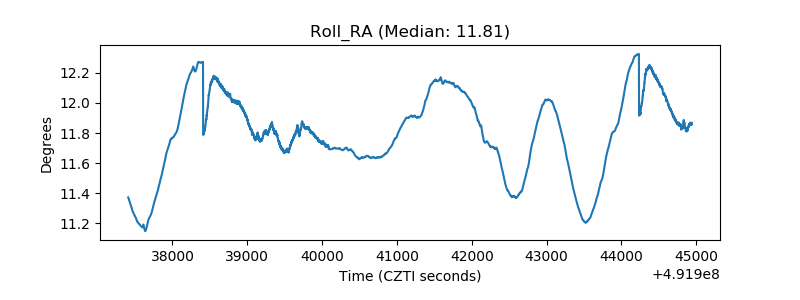 |
| Veto Counter | 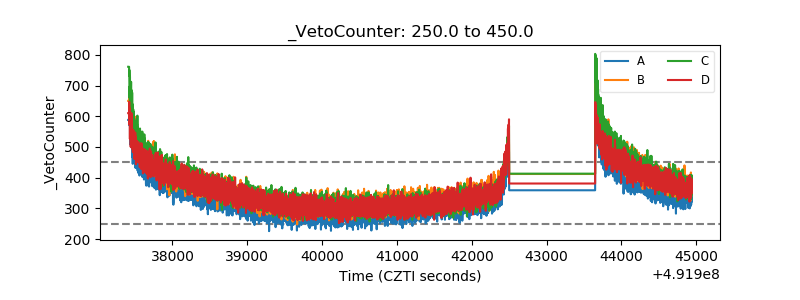 |