| Param | Original file | Final file |
|---|---|---|
| Filename | modeM0/AS1C09_011T08_9000006492_53281cztM0_level2.fits | modeM0/AS1C09_011T08_9000006492_53281cztM0_level2_quad_clean.evt |
| Size (bytes) | 685,569,600 | 86,230,080 |
| Size | 653.8 MB | 82.2 MB |
| Events in quadrant A | 3,455,922 | 633,085 |
| Events in quadrant B | 4,212,565 | 681,827 |
| Events in quadrant C | 11,954,334 | 314,800 |
| Events in quadrant D | 5,262,518 | 538,327 |
| Mode M0 | |||
|---|---|---|---|
| Quadrant | BADHDUFLAG | Total packets | Discarded packets |
| A | 0 | 14860 | 2 |
| B | 0 | 16970 | 2 |
| C | 0 | 39839 | 4 |
| D | 0 | 20029 | 2 |
| Mode M9 | |||
|---|---|---|---|
| Quadrant | BADHDUFLAG | Total packets | Discarded packets |
| A | 0 | 16 | 0 |
| B | 0 | 16 | 0 |
| C | 0 | 17 | 0 |
| D | 0 | 17 | 0 |
| Mode SS | |||
|---|---|---|---|
| Quadrant | BADHDUFLAG | Total packets | Discarded packets |
| A | 0 | 128 | 0 |
| B | 0 | 128 | 0 |
| C | 0 | 128 | 0 |
| D | 0 | 128 | 0 |
| Quadrant | Total seconds | Saturated seconds | Saturation percentage |
|---|---|---|---|
| A | 6347 | 177 | 2.788719% |
| B | 6347 | 239 | 3.765559% |
| C | 6346 | 3417 | 53.844942% |
| D | 6346 | 628 | 9.895997% |
Noise dominated data is calculated using 1-second bins in cleaned event files. If a bin has >2000 counts, and if more than 50% of those come from <1% of pixels, then it is considered to be noise-dominated and hence unusable.
| Quadrant | # 1 sec bins | Bins with >0 counts | Bins with >2000 counts | High rate bins dominated by noise | Noise dominated (total time) | Noise dominated (detector-on time) | Marked lightcurve |
|---|---|---|---|---|---|---|---|
| A | 7551 | 6347 | 134 | 134 | 1.77% | 2.11% | 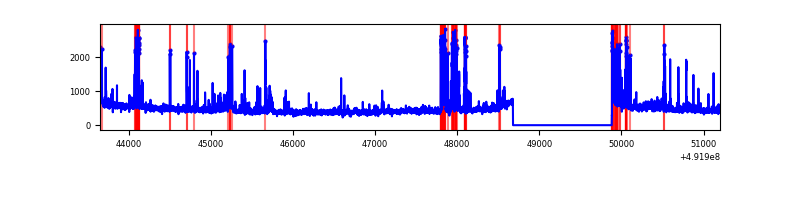 |
| B | 7551 | 6347 | 161 | 161 | 2.13% | 2.54% | 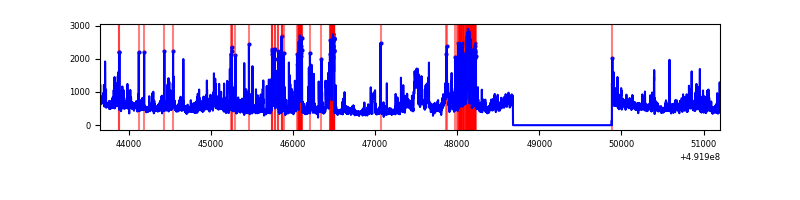 |
| C | 7551 | 6347 | 3258 | 3258 | 43.15% | 51.33% | 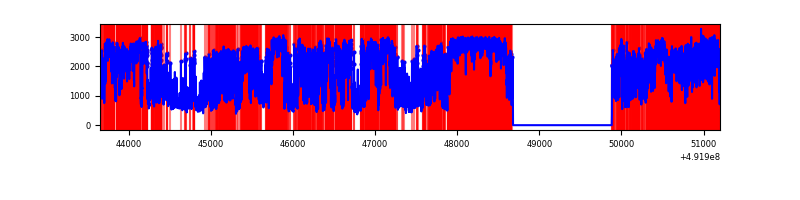 |
| D | 7551 | 6347 | 563 | 563 | 7.46% | 8.87% | 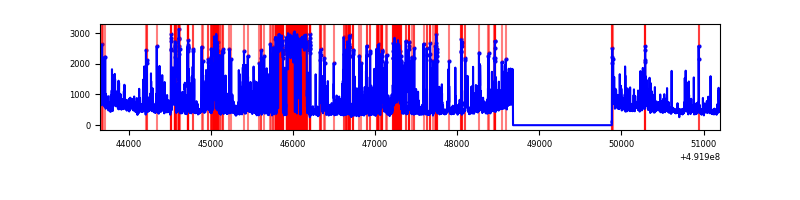 |
Top three noisy pixels from each quadrant. If the there are fewer than three noisy pixels in the level2.evt file, extra rows are filled as -1
| Pixel properties | Quadrant properties | ||||||
|---|---|---|---|---|---|---|---|
| Quadrant | DetID | PixID | Counts | Sigma | Mean | Median | Sigma |
| A | 0 | 8 | 538977 | 3181.52 | 679 | 663 | 169.2 |
| A | 3 | 14 | 72904 | 426.96 | 679 | 663 | 169.2 |
| A | 4 | 159 | 31715 | 183.52 | 679 | 663 | 169.2 |
| B | 2 | 249 | 510268 | 3558.75 | 678 | 654 | 143.2 |
| B | 10 | 28 | 343238 | 2392.34 | 678 | 654 | 143.2 |
| B | 0 | 213 | 185646 | 1291.84 | 678 | 654 | 143.2 |
| C | 1 | 241 | 5153250 | 38839.57 | 476 | 473 | 132.7 |
| C | 10 | 22 | 1301066 | 9803.35 | 476 | 473 | 132.7 |
| C | 0 | 177 | 1010864 | 7615.92 | 476 | 473 | 132.7 |
| D | 9 | 19 | 795992 | 4360.58 | 639 | 610 | 182.4 |
| D | 3 | 12 | 700152 | 3835.15 | 639 | 610 | 182.4 |
| D | 12 | 3 | 339442 | 1857.6 | 639 | 610 | 182.4 |
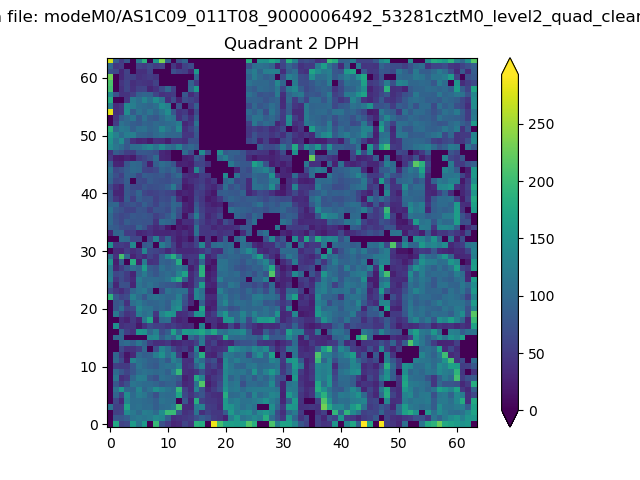
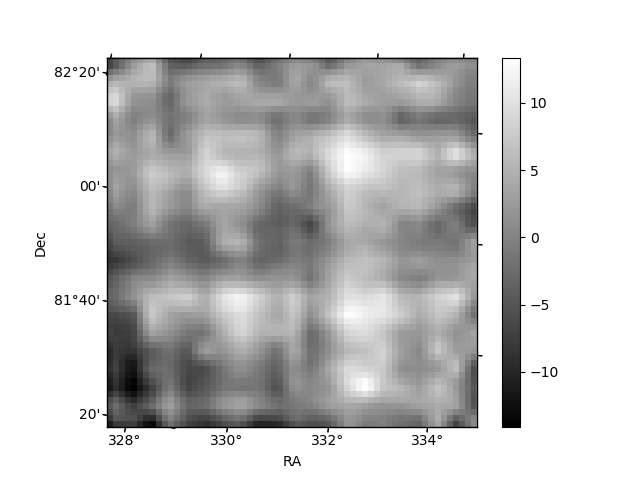
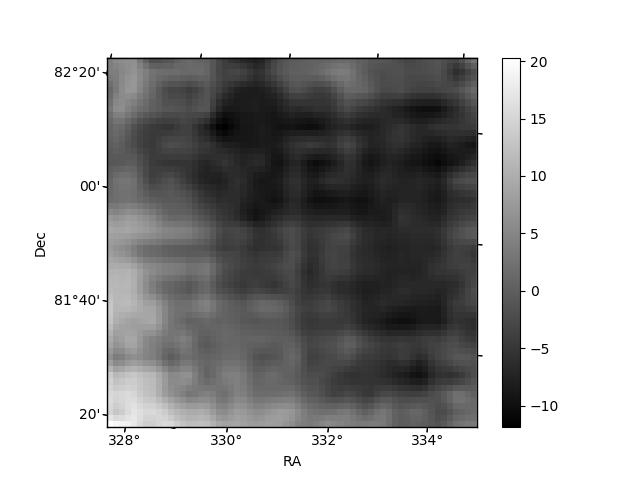
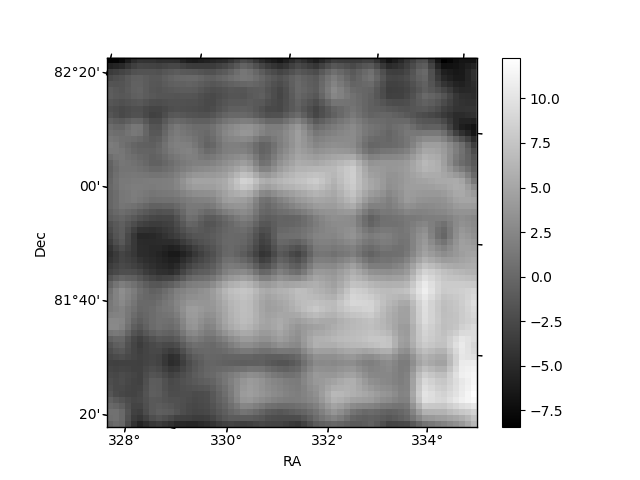
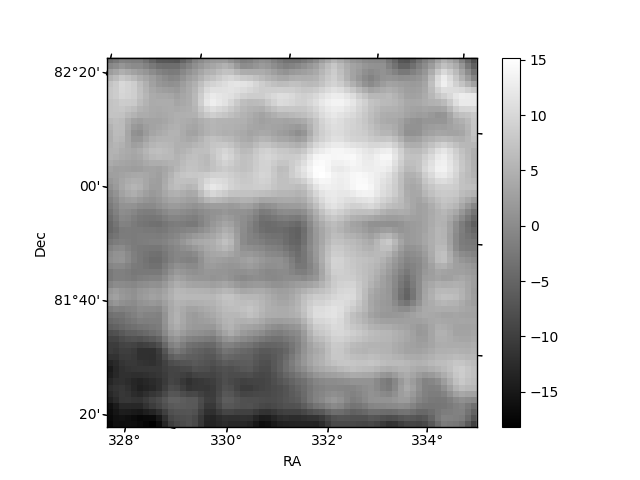
Histogram calculated using DETX and DETY for each event in the final _common_clean file
| Quadrant A | 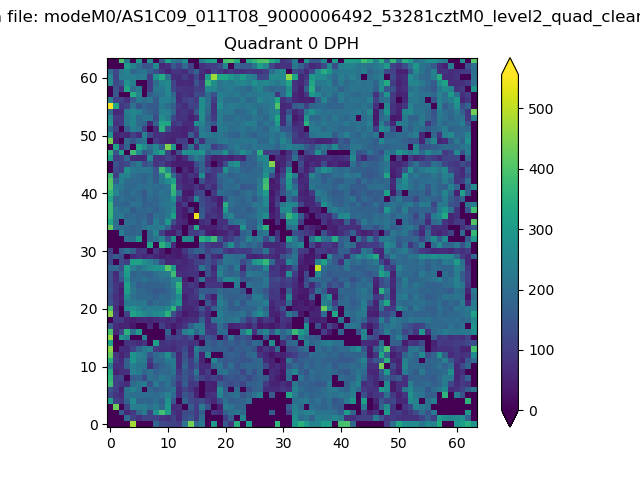 |
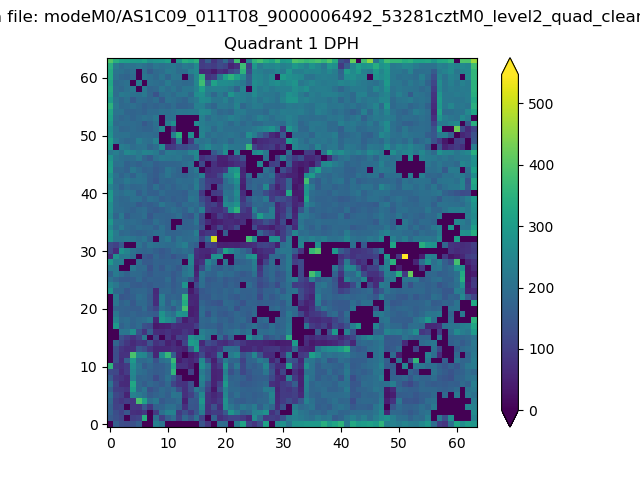 |
Quadrant B |
|---|---|---|---|
| Quadrant D | 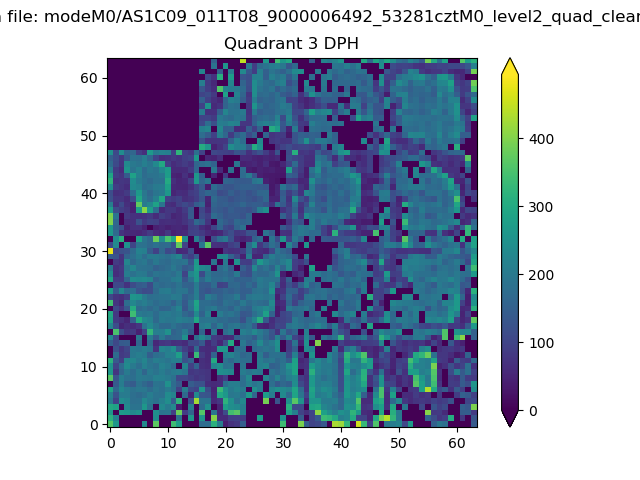 |
 |
Quadrant C |
| Plot type | Count rate plots | Images |
|---|---|---|
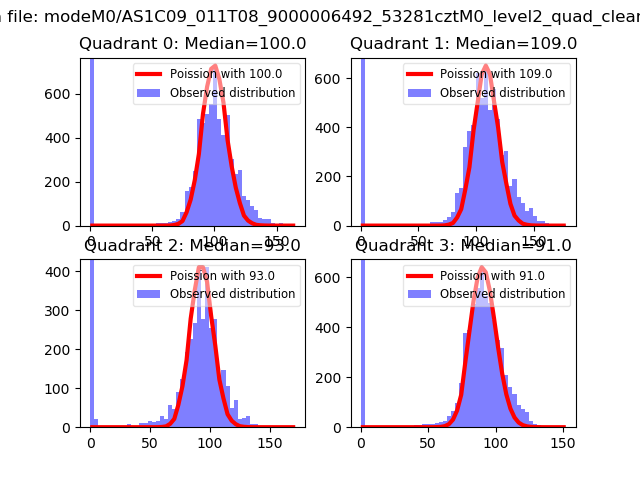
| Comparison with Poisson distribution Blue bars denote a histogram of data divided into 1 sec bins. Red curve is a Poisson curve with rate = median count rate of data. |
 |
 |
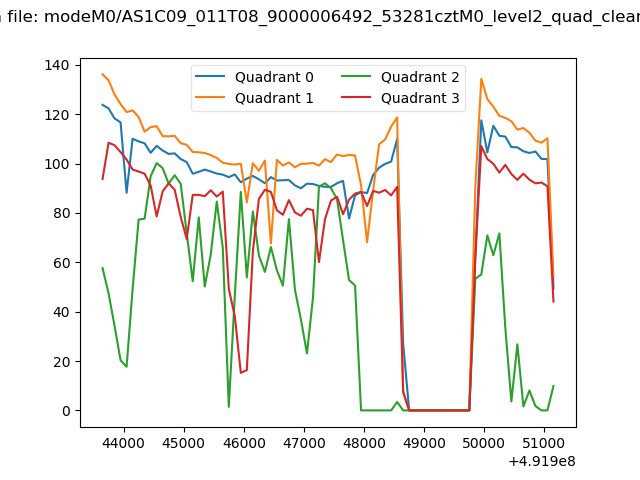
| Quadrant-wise count rates Data is divided into 100 sec bins |
 |
|
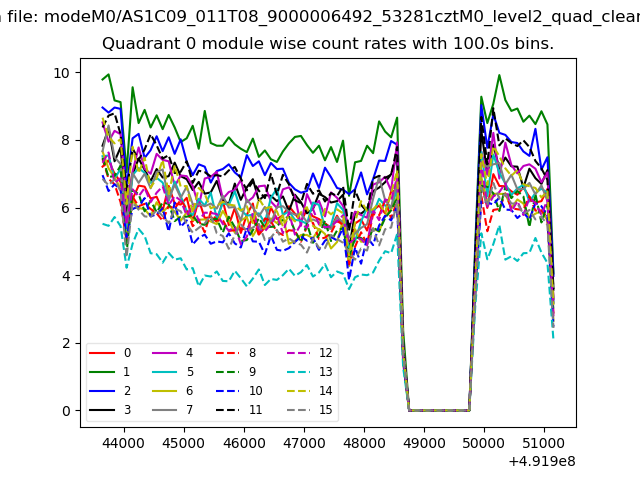
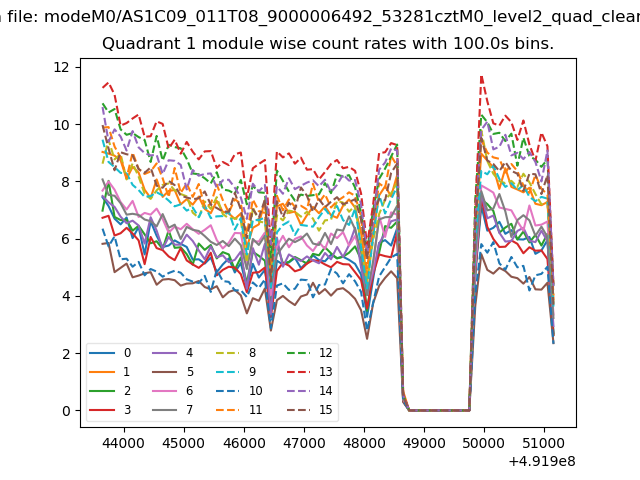
| Module-wise count rates for Quadrant A Data is divided into 100 sec bins |
 |
 |
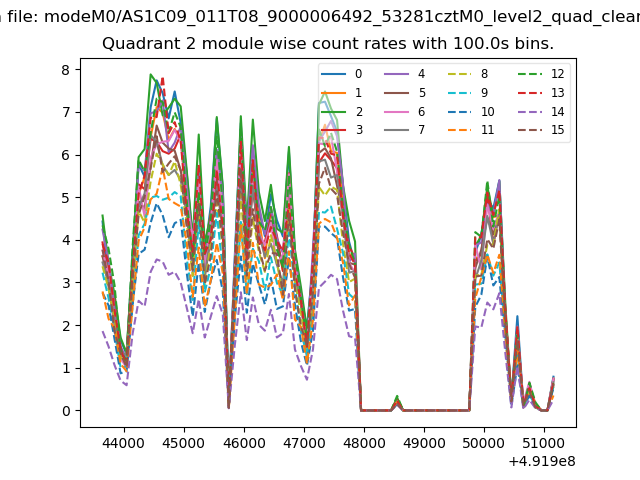
| Module-wise count rates for Quadrant B Data is divided into 100 sec bins |
 |
 |
| Module-wise count rates for Quadrant C Data is divided into 100 sec bins |
 |
 |
| Module-wise count rates for Quadrant D Data is divided into 100 sec bins |
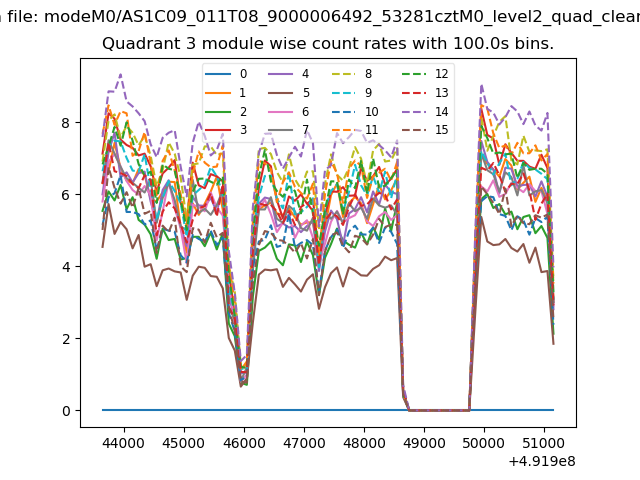 |
 |
| Parameter | Plot |
|---|---|
| CZT HV Monitor | 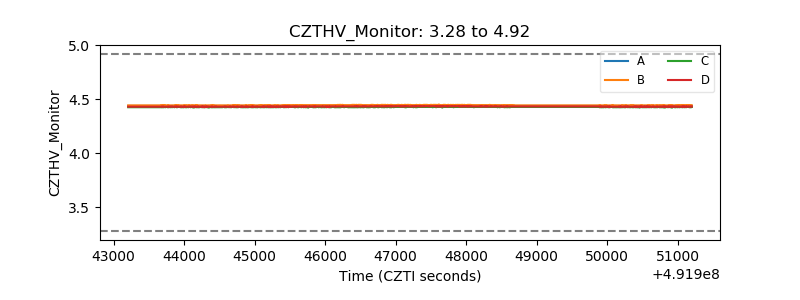 |
| D_VDD | 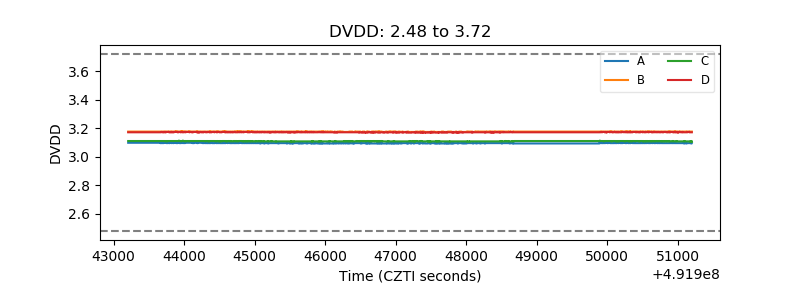 |
| Temperature 1 | 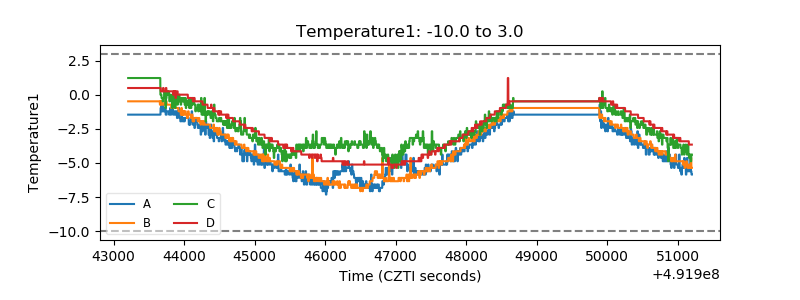 |
| Veto HV Monitor | 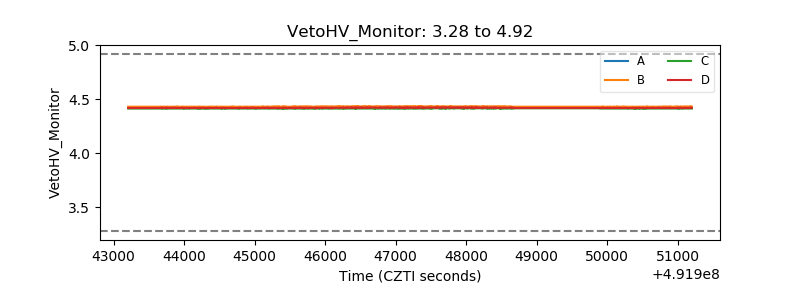 |
| Veto LLD | 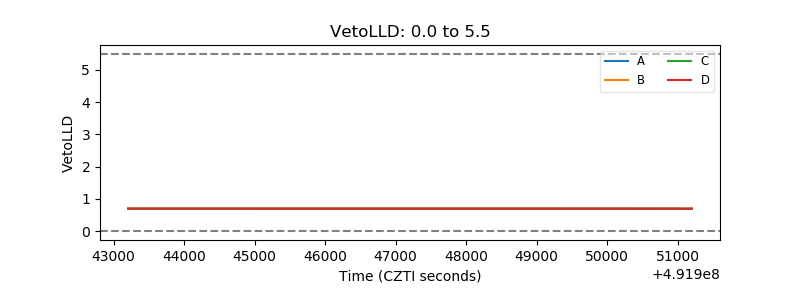 |
| Alpha Counter | 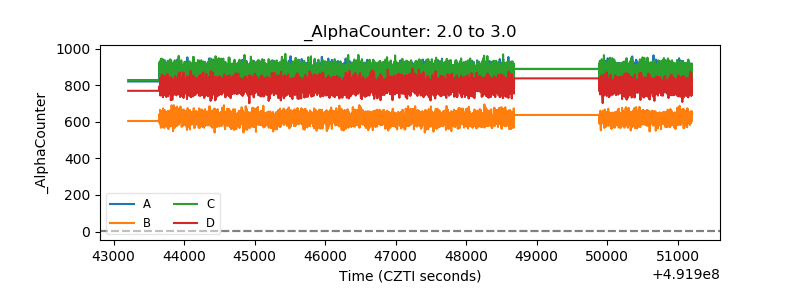 |
| _CPM_Rate |  |
| CZT Counter | 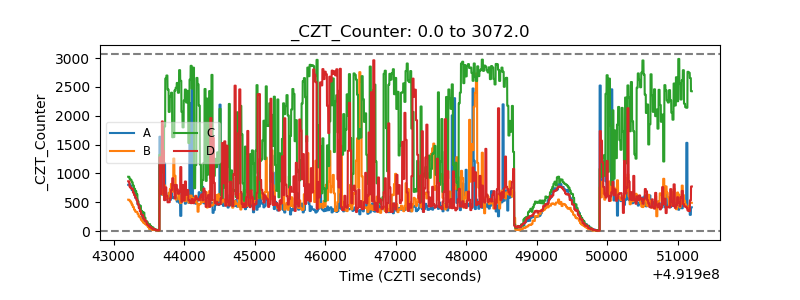 |
| +2.5 Volts monitor |  |
| +5 Volts monitor | 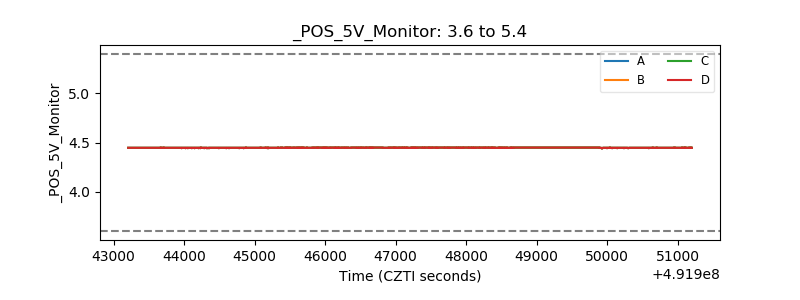 |
| _ROLL_ROT |  |
| _Roll_DEC | 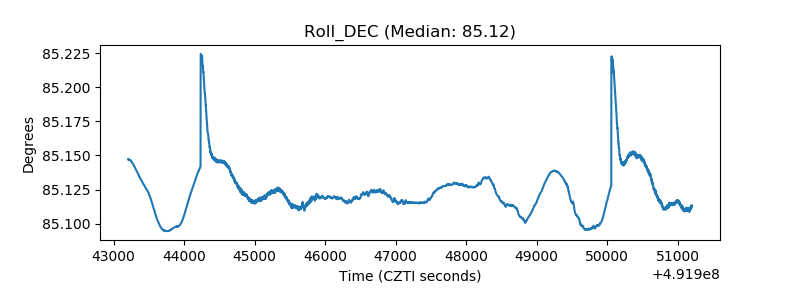 |
| _Roll_RA | 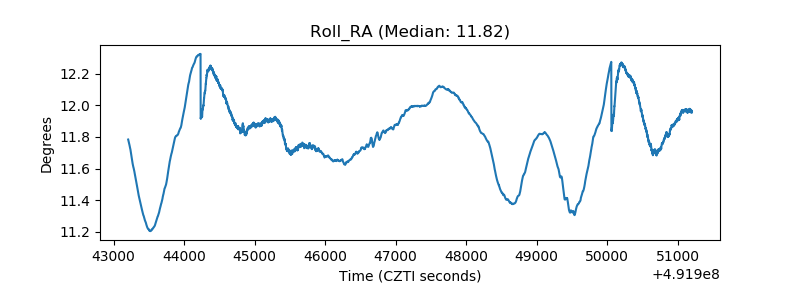 |
| Veto Counter | 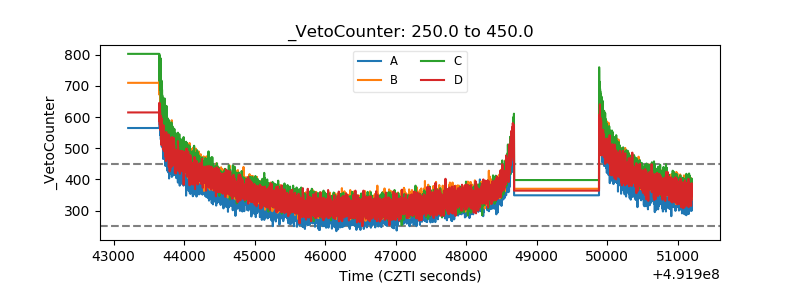 |