| Param | Original file | Final file |
|---|---|---|
| Filename | modeM0/AS1C09_011T08_9000006492_53283cztM0_level2.fits | modeM0/AS1C09_011T08_9000006492_53283cztM0_level2_quad_clean.evt |
| Size (bytes) | 745,755,840 | 85,150,080 |
| Size | 711.2 MB | 81.2 MB |
| Events in quadrant A | 4,460,069 | 599,967 |
| Events in quadrant B | 5,120,501 | 660,262 |
| Events in quadrant C | 12,794,403 | 307,824 |
| Events in quadrant D | 4,723,755 | 553,867 |
| Mode M0 | |||
|---|---|---|---|
| Quadrant | BADHDUFLAG | Total packets | Discarded packets |
| A | 0 | 18129 | 2 |
| B | 0 | 20013 | 2 |
| C | 0 | 42389 | 2 |
| D | 0 | 18762 | 3 |
| Mode M9 | |||
|---|---|---|---|
| Quadrant | BADHDUFLAG | Total packets | Discarded packets |
| A | 0 | 16 | 0 |
| B | 0 | 17 | 0 |
| C | 0 | 17 | 0 |
| D | 0 | 17 | 0 |
| Mode SS | |||
|---|---|---|---|
| Quadrant | BADHDUFLAG | Total packets | Discarded packets |
| A | 0 | 132 | 0 |
| B | 0 | 132 | 0 |
| C | 0 | 132 | 0 |
| D | 0 | 132 | 0 |
| Quadrant | Total seconds | Saturated seconds | Saturation percentage |
|---|---|---|---|
| A | 6541 | 415 | 6.344596% |
| B | 6541 | 399 | 6.099985% |
| C | 6541 | 3693 | 56.459257% |
| D | 6540 | 375 | 5.733945% |
Noise dominated data is calculated using 1-second bins in cleaned event files. If a bin has >2000 counts, and if more than 50% of those come from <1% of pixels, then it is considered to be noise-dominated and hence unusable.
| Quadrant | # 1 sec bins | Bins with >0 counts | Bins with >2000 counts | High rate bins dominated by noise | Noise dominated (total time) | Noise dominated (detector-on time) | Marked lightcurve |
|---|---|---|---|---|---|---|---|
| A | 7651 | 6542 | 387 | 387 | 5.06% | 5.92% | 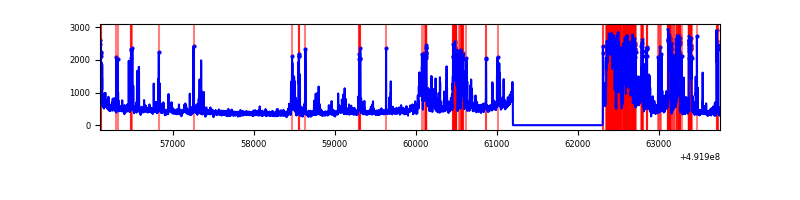 |
| B | 7651 | 6541 | 241 | 241 | 3.15% | 3.68% | 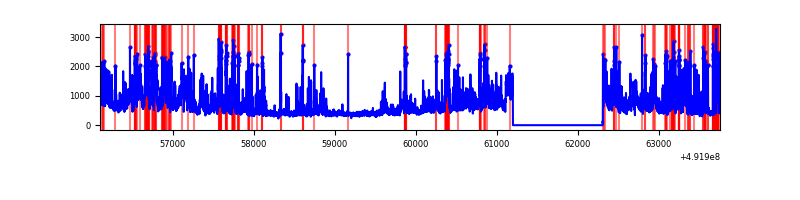 |
| C | 7651 | 6541 | 3553 | 3553 | 46.44% | 54.32% | 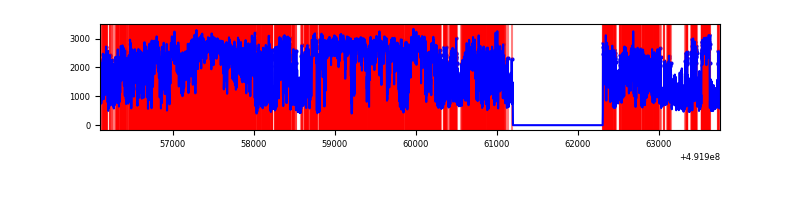 |
| D | 7650 | 6541 | 344 | 344 | 4.50% | 5.26% | 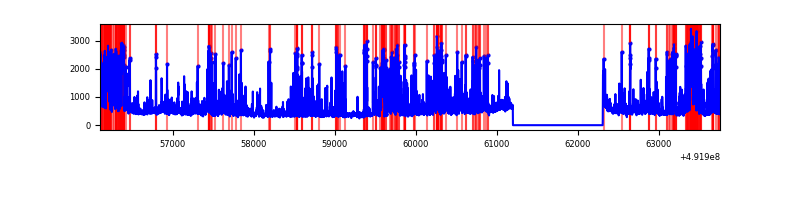 |
Top three noisy pixels from each quadrant. If the there are fewer than three noisy pixels in the level2.evt file, extra rows are filled as -1
| Pixel properties | Quadrant properties | ||||||
|---|---|---|---|---|---|---|---|
| Quadrant | DetID | PixID | Counts | Sigma | Mean | Median | Sigma |
| A | 12 | 115 | 1434690 | 8616.89 | 660 | 645 | 166.4 |
| A | 15 | 174 | 66389 | 395.04 | 660 | 645 | 166.4 |
| A | 4 | 159 | 64687 | 384.82 | 660 | 645 | 166.4 |
| B | 10 | 28 | 547130 | 3856.76 | 666 | 644 | 141.7 |
| B | 14 | 167 | 452382 | 3188.09 | 666 | 644 | 141.7 |
| B | 2 | 249 | 425575 | 2998.9 | 666 | 644 | 141.7 |
| C | 1 | 241 | 4817205 | 35516.71 | 491 | 487 | 135.6 |
| C | 10 | 22 | 2369265 | 17466.5 | 491 | 487 | 135.6 |
| C | 15 | 224 | 1507774 | 11114.18 | 491 | 487 | 135.6 |
| D | 6 | 239 | 738238 | 4042.45 | 640 | 611 | 182.5 |
| D | 3 | 12 | 572955 | 3136.65 | 640 | 611 | 182.5 |
| D | 11 | 176 | 246430 | 1347.17 | 640 | 611 | 182.5 |
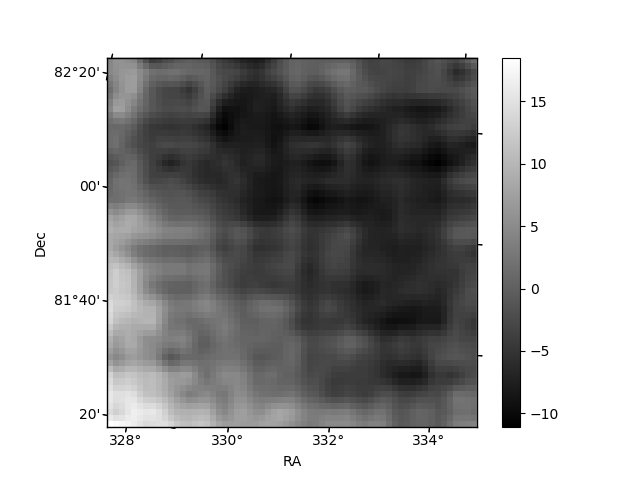
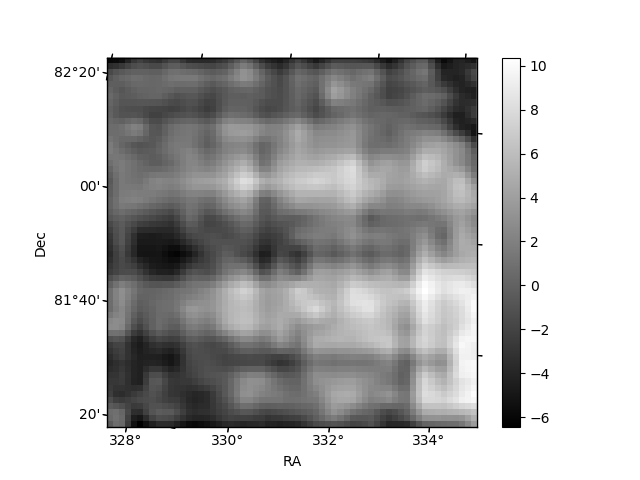
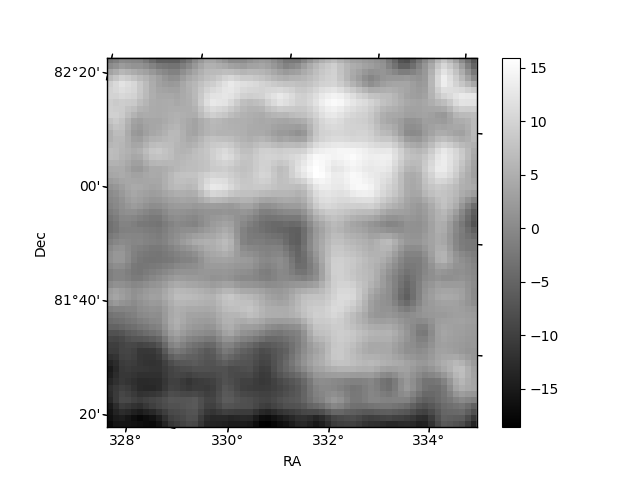
Histogram calculated using DETX and DETY for each event in the final _common_clean file
| Quadrant A | 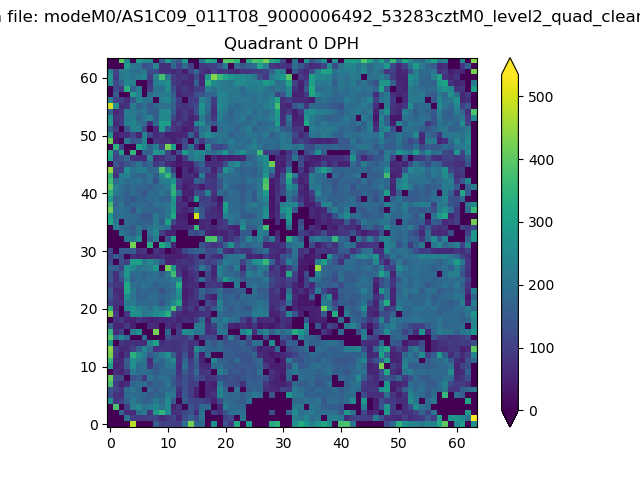 |
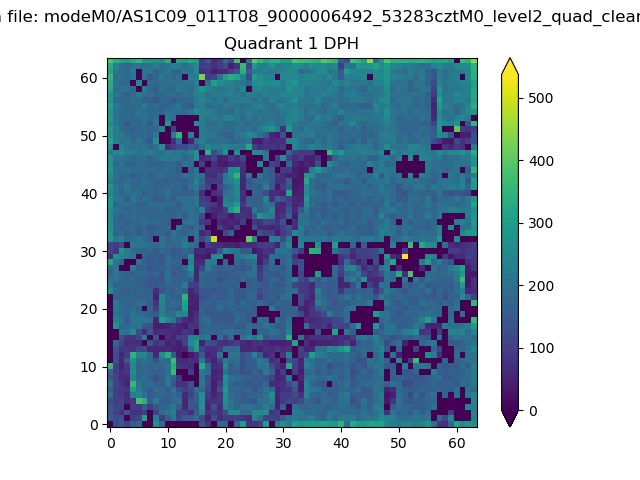 |
Quadrant B |
|---|---|---|---|
| Quadrant D | 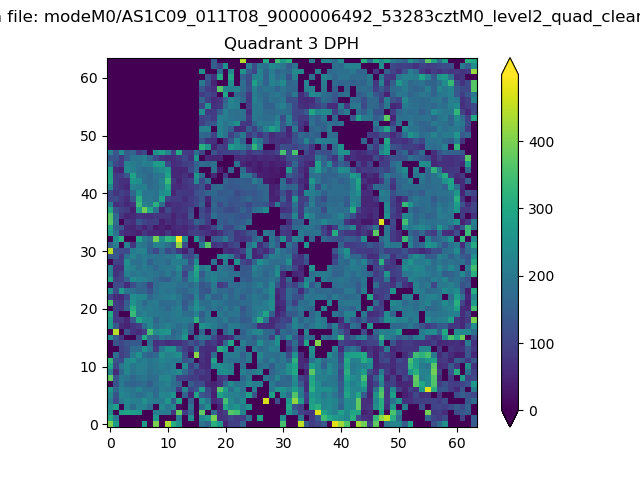 |
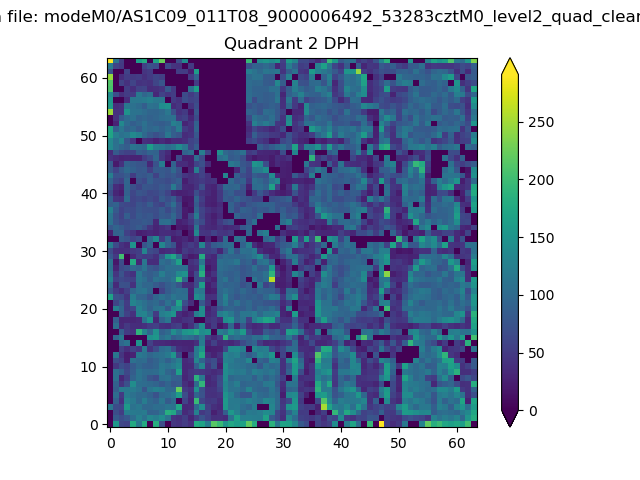 |
Quadrant C |
| Plot type | Count rate plots | Images |
|---|---|---|
| Comparison with Poisson distribution Blue bars denote a histogram of data divided into 1 sec bins. Red curve is a Poisson curve with rate = median count rate of data. |
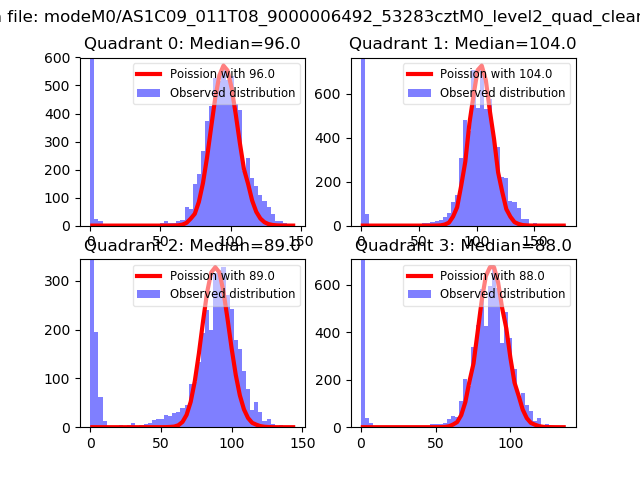 |
 |
| Quadrant-wise count rates Data is divided into 100 sec bins |
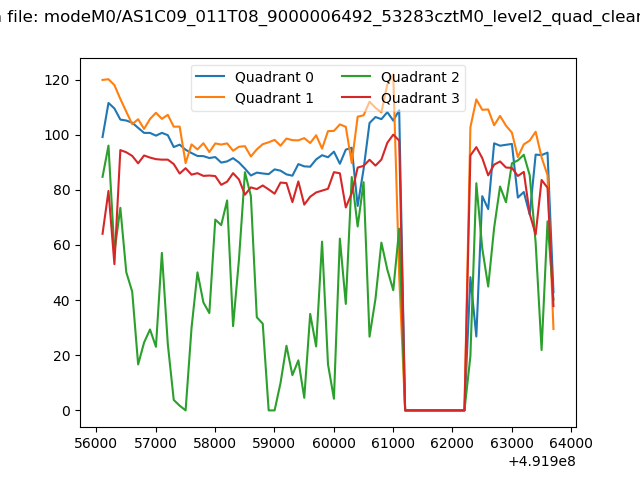 |
|
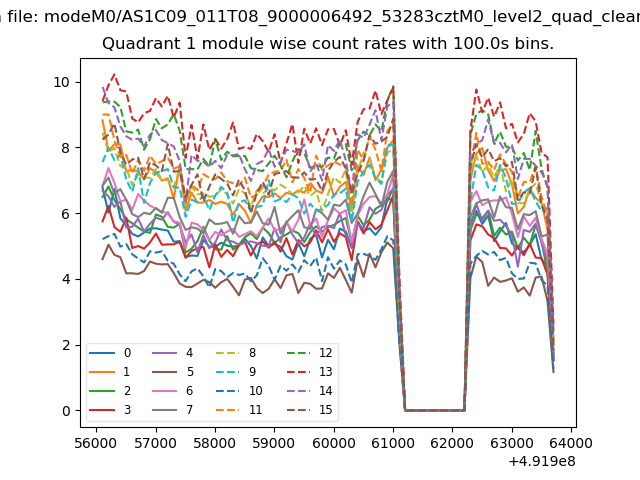
| Module-wise count rates for Quadrant A Data is divided into 100 sec bins |
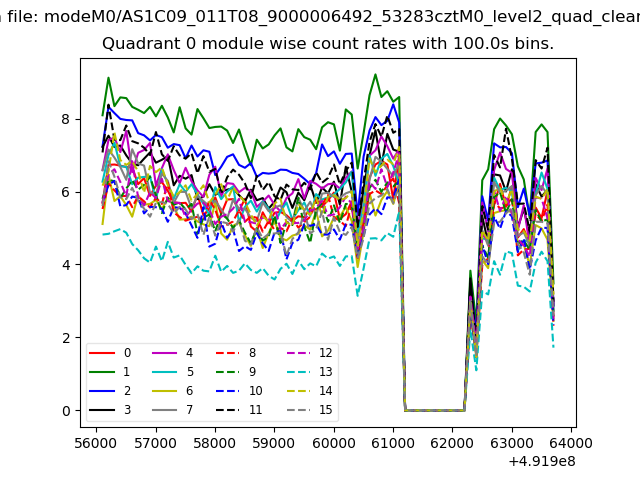 |
 |
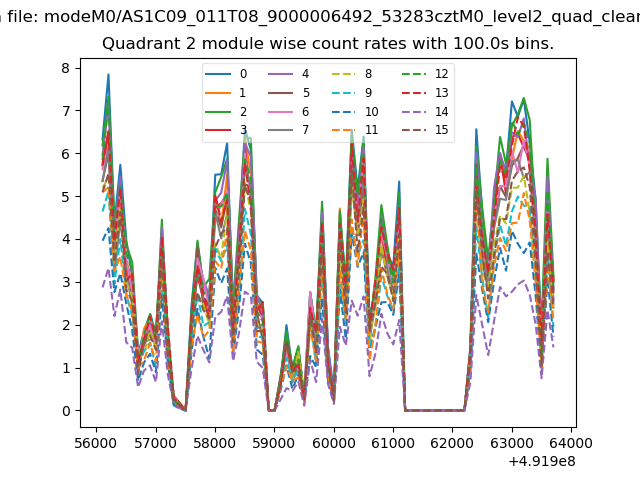
| Module-wise count rates for Quadrant B Data is divided into 100 sec bins |
 |
 |
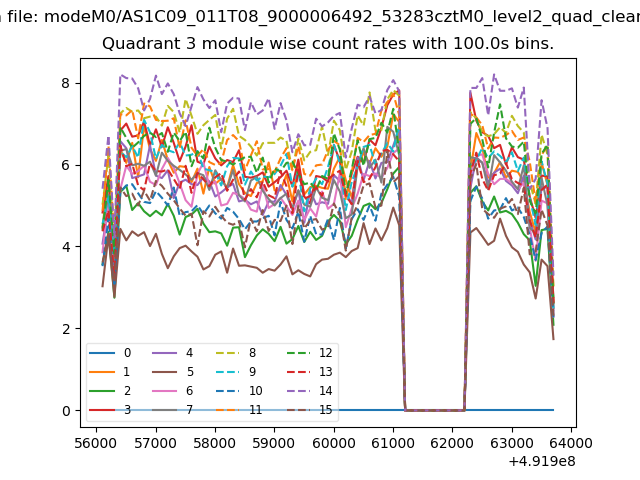
| Module-wise count rates for Quadrant C Data is divided into 100 sec bins |
 |
 |
| Module-wise count rates for Quadrant D Data is divided into 100 sec bins |
 |
 |
| Parameter | Plot |
|---|---|
| CZT HV Monitor | 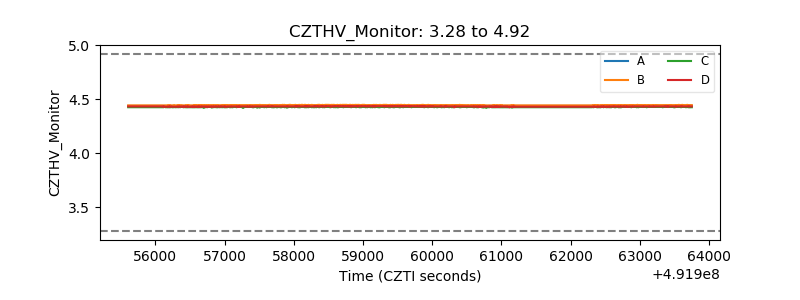 |
| D_VDD | 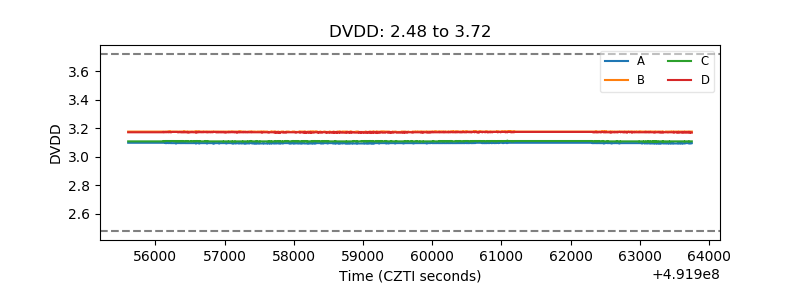 |
| Temperature 1 | 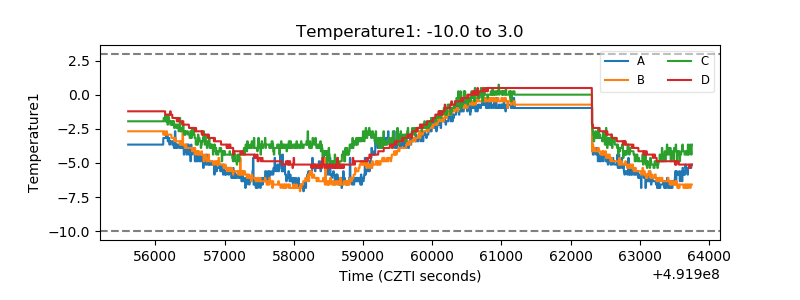 |
| Veto HV Monitor | 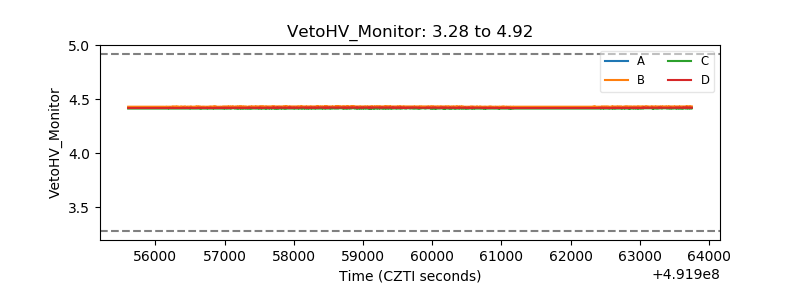 |
| Veto LLD | 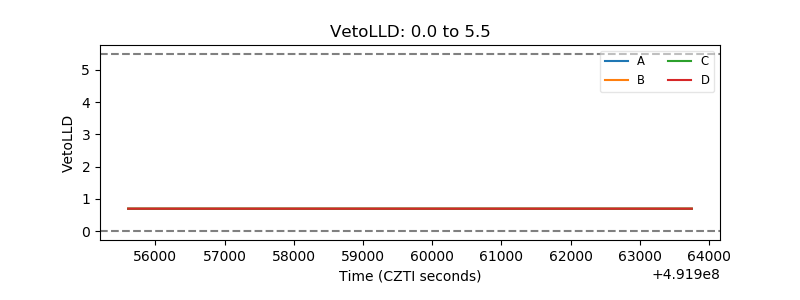 |
| Alpha Counter |  |
| _CPM_Rate | 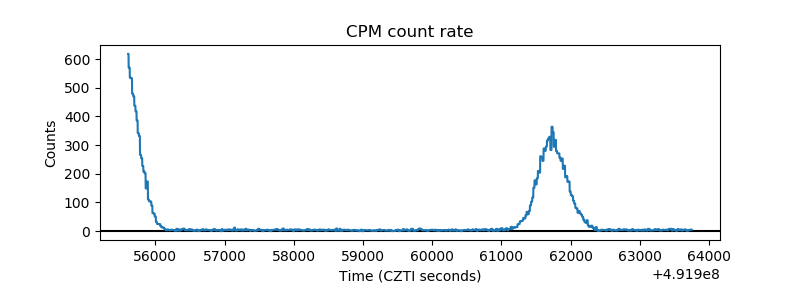 |
| CZT Counter | 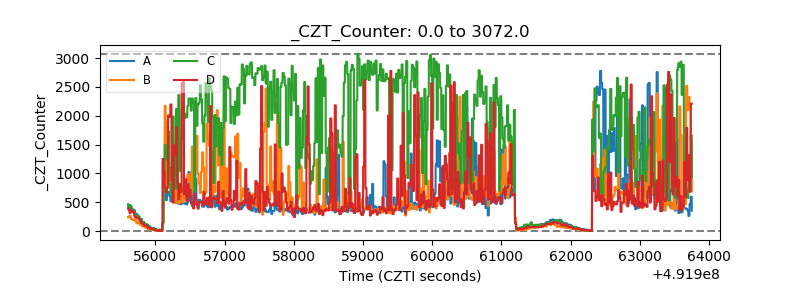 |
| +2.5 Volts monitor | 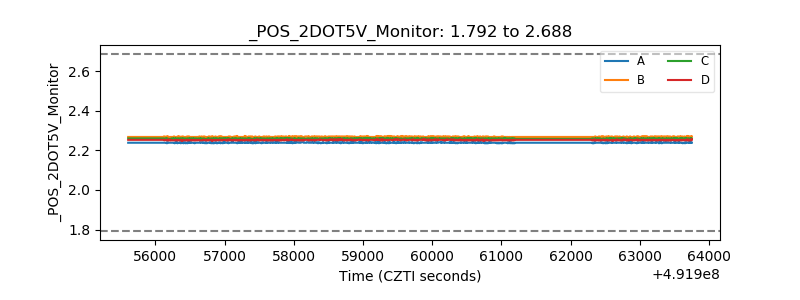 |
| +5 Volts monitor | 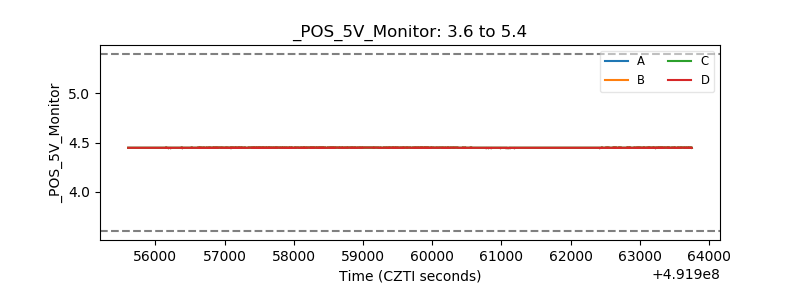 |
| _ROLL_ROT |  |
| _Roll_DEC | 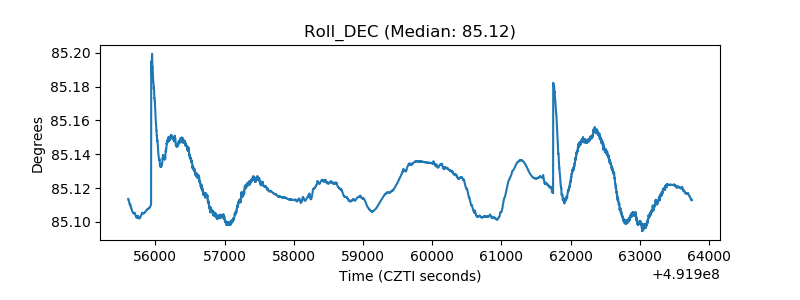 |
| _Roll_RA | 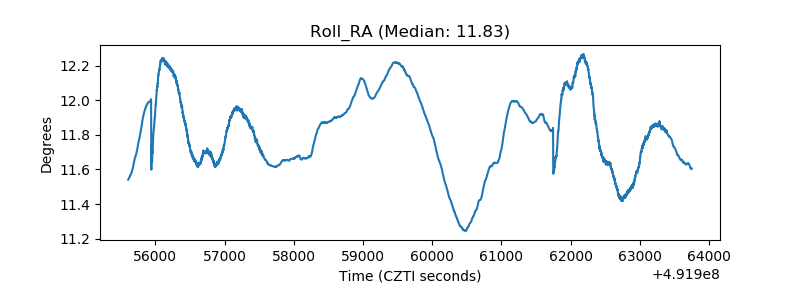 |
| Veto Counter | 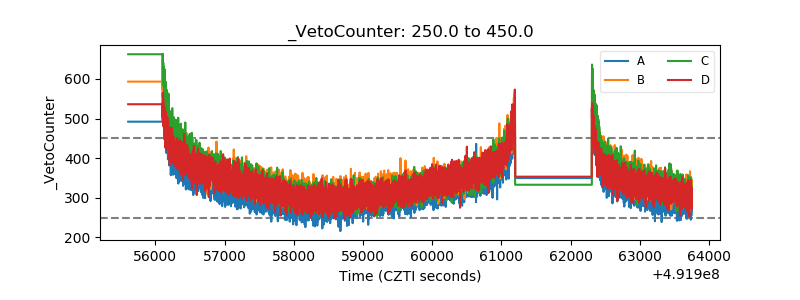 |