| Param | Original file | Final file |
|---|---|---|
| Filename | modeM0/AS1C09_011T08_9000006492_53284cztM0_level2.fits | modeM0/AS1C09_011T08_9000006492_53284cztM0_level2_quad_clean.evt |
| Size (bytes) | 746,069,760 | 90,627,840 |
| Size | 711.5 MB | 86.4 MB |
| Events in quadrant A | 4,678,399 | 628,855 |
| Events in quadrant B | 4,578,144 | 689,769 |
| Events in quadrant C | 13,331,997 | 354,385 |
| Events in quadrant D | 4,490,086 | 586,225 |
| Mode M0 | |||
|---|---|---|---|
| Quadrant | BADHDUFLAG | Total packets | Discarded packets |
| A | 0 | 19000 | 1 |
| B | 0 | 18759 | 1 |
| C | 0 | 44401 | 5 |
| D | 0 | 18259 | 1 |
| Mode M9 | |||
|---|---|---|---|
| Quadrant | BADHDUFLAG | Total packets | Discarded packets |
| A | 0 | 8 | 0 |
| B | 0 | 8 | 0 |
| C | 0 | 8 | 0 |
| D | 0 | 8 | 0 |
| Mode SS | |||
|---|---|---|---|
| Quadrant | BADHDUFLAG | Total packets | Discarded packets |
| A | 0 | 142 | 0 |
| B | 0 | 142 | 0 |
| C | 0 | 142 | 0 |
| D | 0 | 142 | 0 |
| Quadrant | Total seconds | Saturated seconds | Saturation percentage |
|---|---|---|---|
| A | 6952 | 359 | 5.163982% |
| B | 6952 | 307 | 4.415995% |
| C | 6951 | 3433 | 49.388577% |
| D | 6951 | 224 | 3.222558% |
Noise dominated data is calculated using 1-second bins in cleaned event files. If a bin has >2000 counts, and if more than 50% of those come from <1% of pixels, then it is considered to be noise-dominated and hence unusable.
| Quadrant | # 1 sec bins | Bins with >0 counts | Bins with >2000 counts | High rate bins dominated by noise | Noise dominated (total time) | Noise dominated (detector-on time) | Marked lightcurve |
|---|---|---|---|---|---|---|---|
| A | 7787 | 6953 | 356 | 356 | 4.57% | 5.12% | 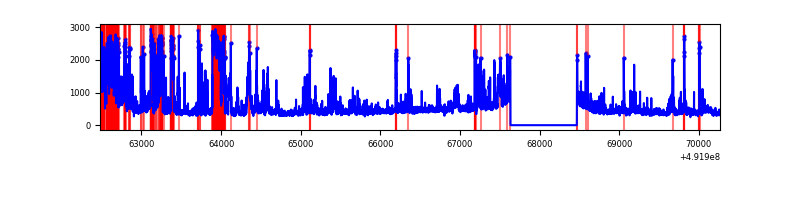 |
| B | 7787 | 6953 | 212 | 212 | 2.72% | 3.05% | 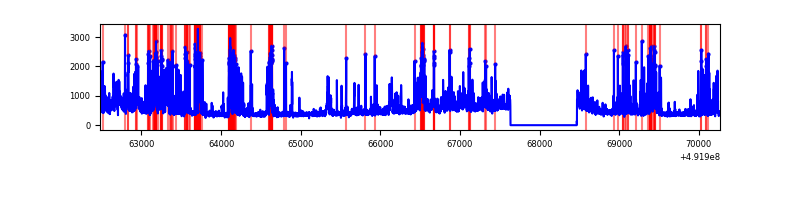 |
| C | 7786 | 6952 | 3554 | 3554 | 45.65% | 51.12% | 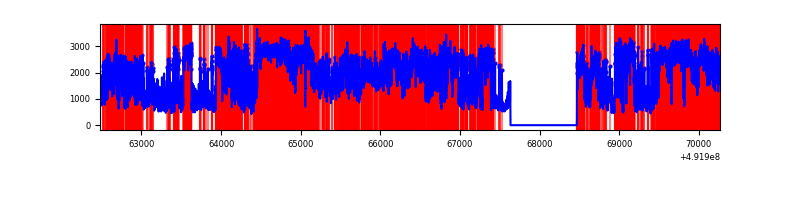 |
| D | 7786 | 6952 | 221 | 221 | 2.84% | 3.18% | 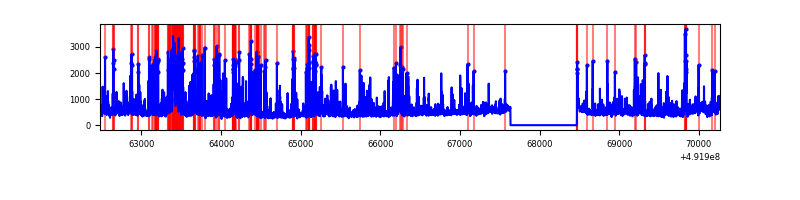 |
Top three noisy pixels from each quadrant. If the there are fewer than three noisy pixels in the level2.evt file, extra rows are filled as -1
| Pixel properties | Quadrant properties | ||||||
|---|---|---|---|---|---|---|---|
| Quadrant | DetID | PixID | Counts | Sigma | Mean | Median | Sigma |
| A | 12 | 115 | 1259493 | 7262.81 | 693 | 675 | 173.3 |
| A | 7 | 206 | 182618 | 1049.73 | 693 | 675 | 173.3 |
| A | 3 | 62 | 134830 | 774.01 | 693 | 675 | 173.3 |
| B | 2 | 249 | 472803 | 3245.78 | 695 | 672 | 145.5 |
| B | 4 | 81 | 340100 | 2333.48 | 695 | 672 | 145.5 |
| B | 14 | 167 | 214608 | 1470.76 | 695 | 672 | 145.5 |
| C | 1 | 241 | 5865977 | 39629.83 | 534 | 529 | 148.0 |
| C | 10 | 22 | 1573938 | 10630.72 | 534 | 529 | 148.0 |
| C | 15 | 224 | 877723 | 5926.75 | 534 | 529 | 148.0 |
| D | 3 | 12 | 616443 | 3153.26 | 674 | 643 | 195.3 |
| D | 6 | 239 | 463149 | 2368.31 | 674 | 643 | 195.3 |
| D | 11 | 176 | 224971 | 1148.69 | 674 | 643 | 195.3 |
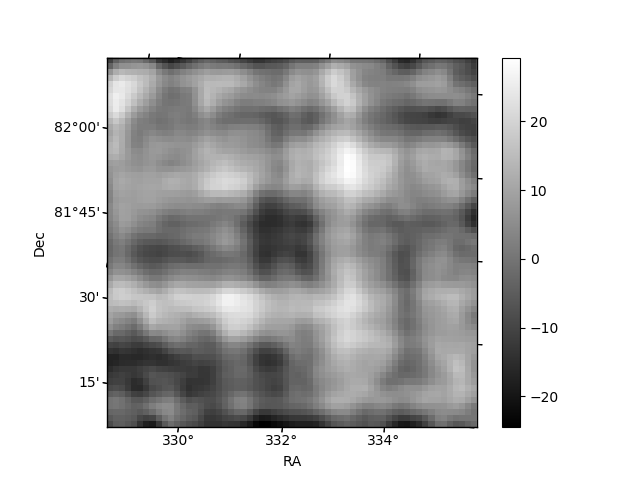
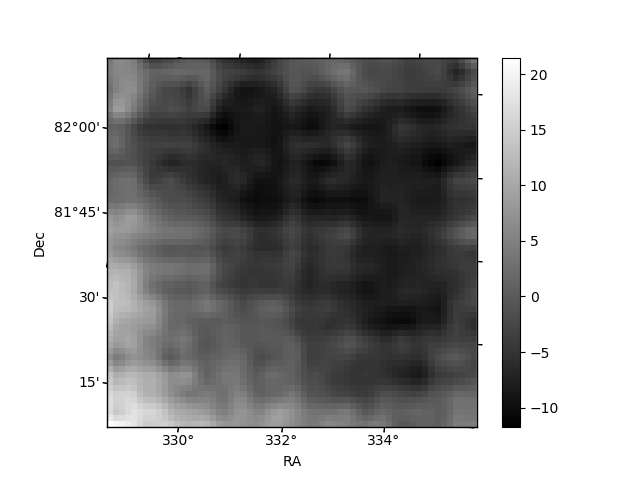
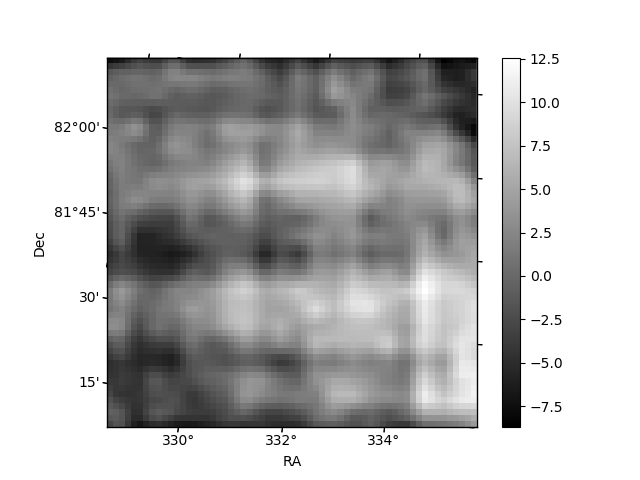
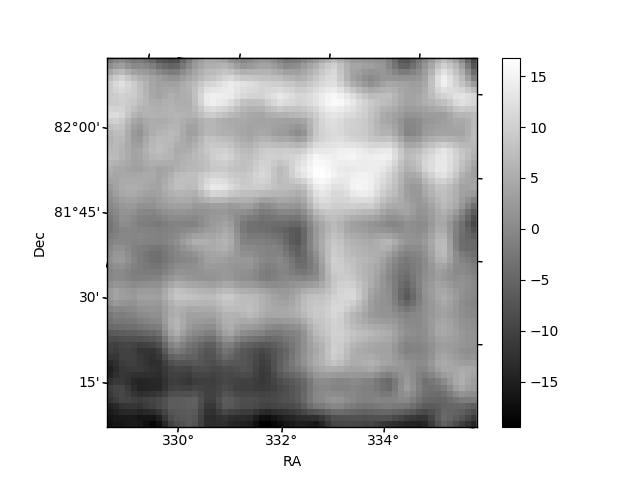
Histogram calculated using DETX and DETY for each event in the final _common_clean file
| Quadrant A | 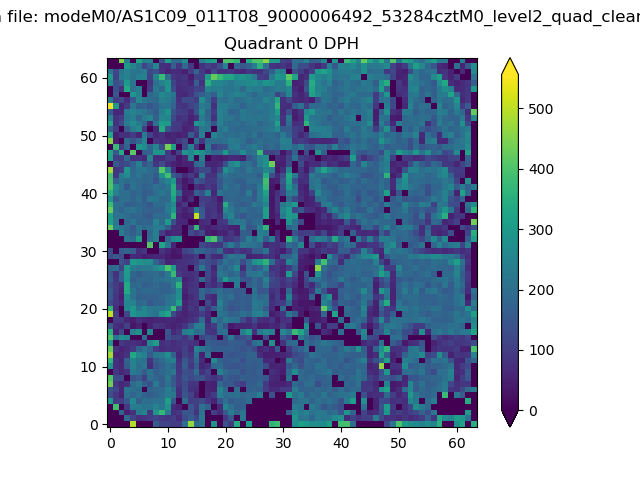 |
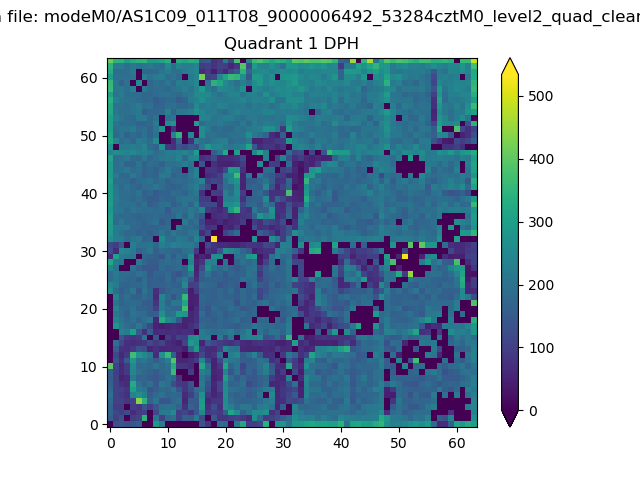 |
Quadrant B |
|---|---|---|---|
| Quadrant D | 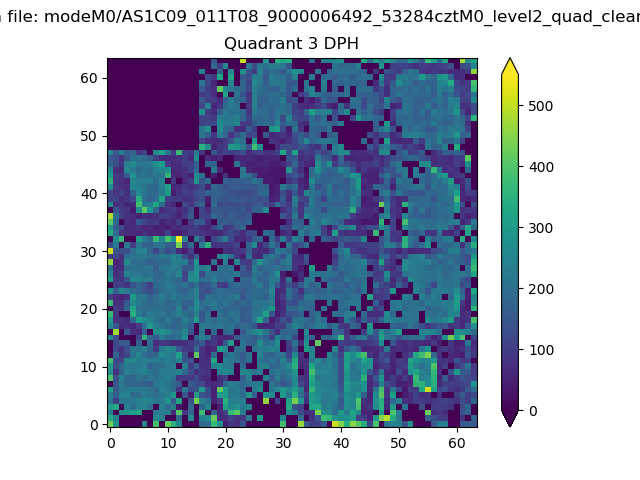 |
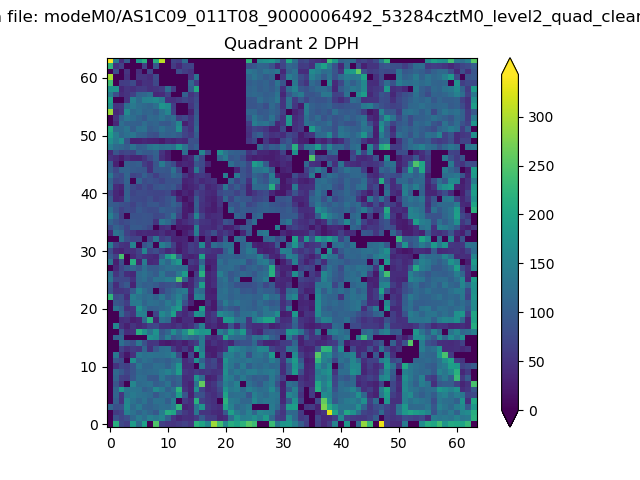 |
Quadrant C |
| Plot type | Count rate plots | Images |
|---|---|---|
| Comparison with Poisson distribution Blue bars denote a histogram of data divided into 1 sec bins. Red curve is a Poisson curve with rate = median count rate of data. |
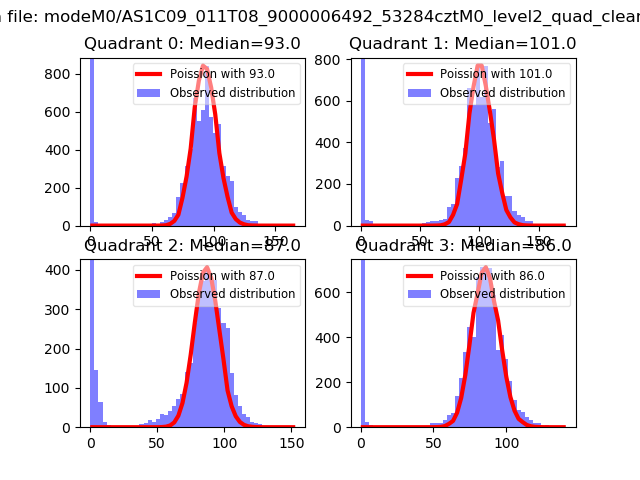 |
 |
| Quadrant-wise count rates Data is divided into 100 sec bins |
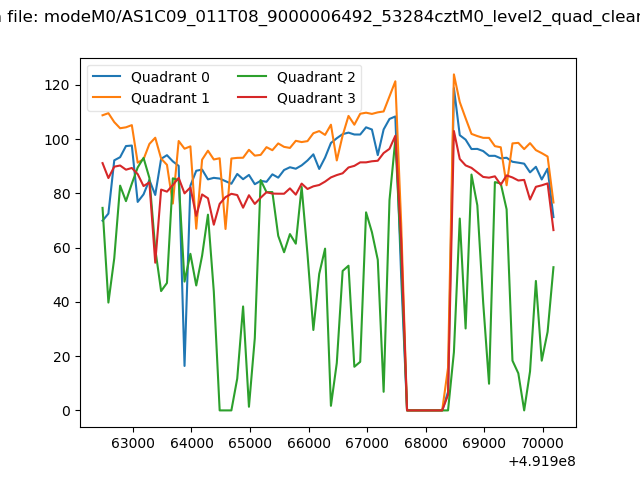 |
|
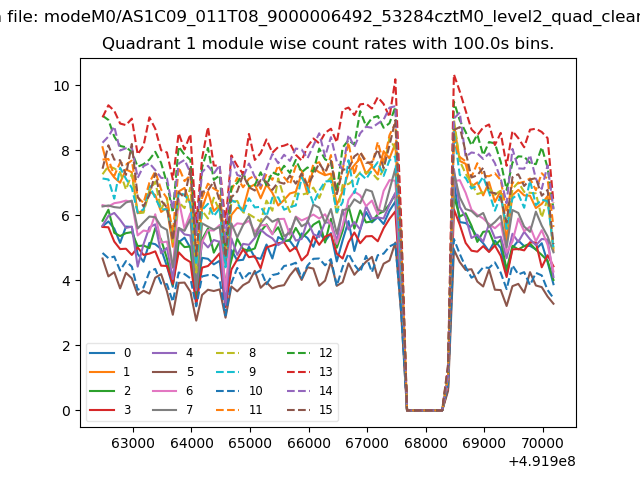
| Module-wise count rates for Quadrant A Data is divided into 100 sec bins |
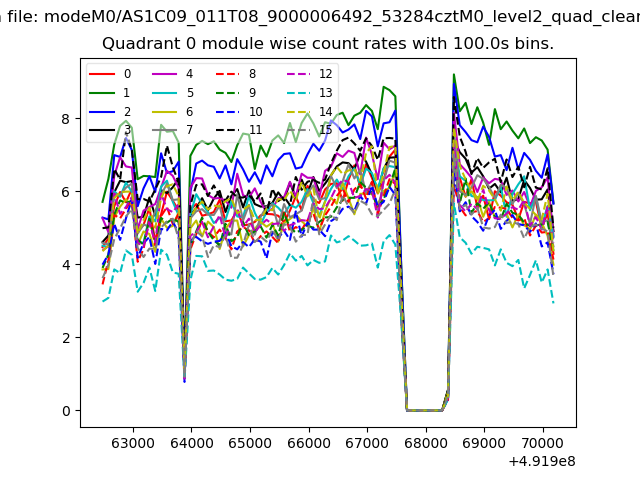 |
 |
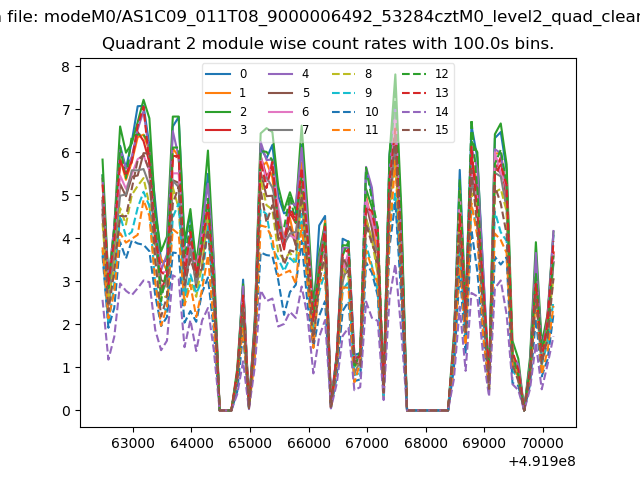
| Module-wise count rates for Quadrant B Data is divided into 100 sec bins |
 |
 |
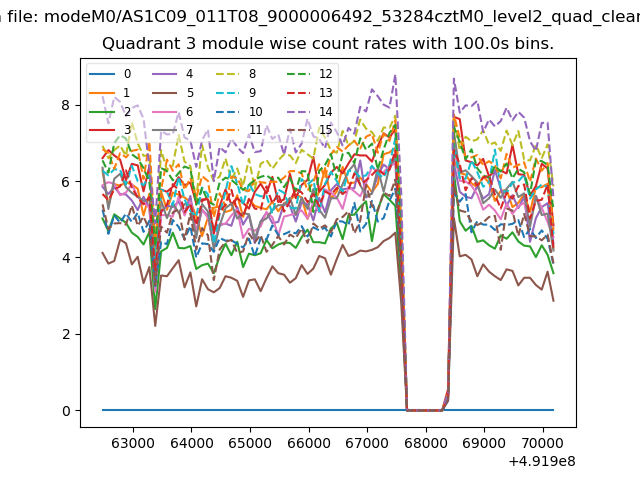
| Module-wise count rates for Quadrant C Data is divided into 100 sec bins |
 |
 |
| Module-wise count rates for Quadrant D Data is divided into 100 sec bins |
 |
 |
| Parameter | Plot |
|---|---|
| CZT HV Monitor |  |
| D_VDD | 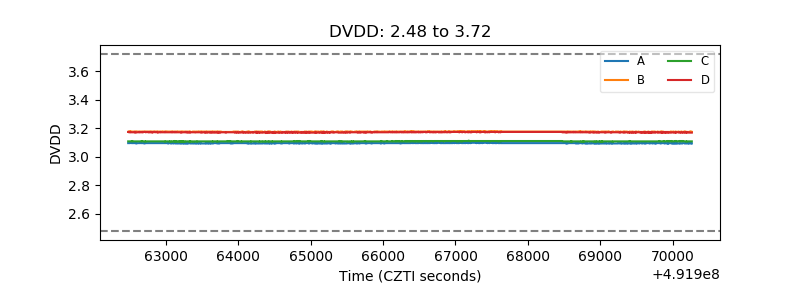 |
| Temperature 1 | 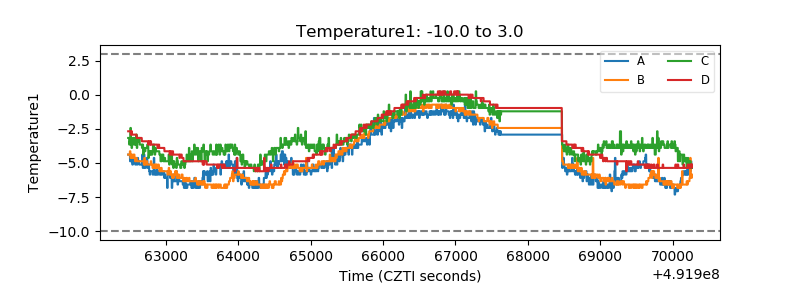 |
| Veto HV Monitor | 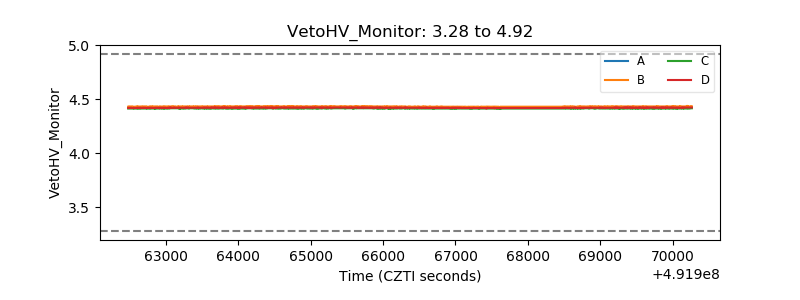 |
| Veto LLD | 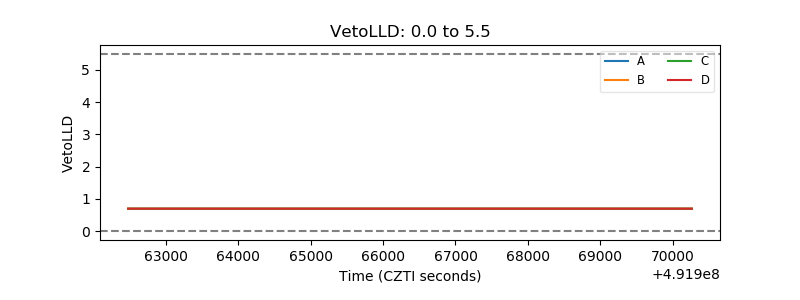 |
| Alpha Counter | 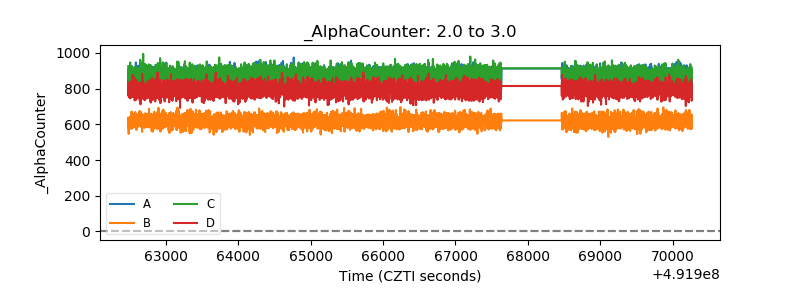 |
| _CPM_Rate | 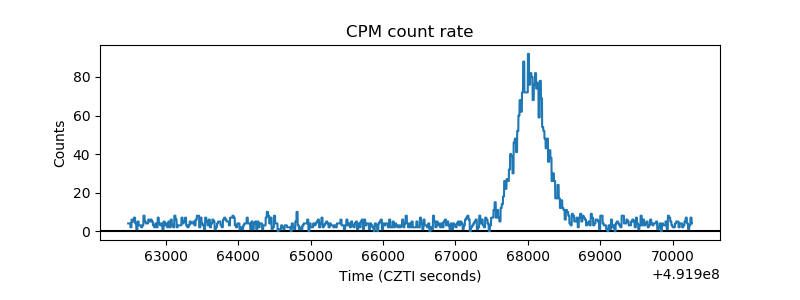 |
| CZT Counter | 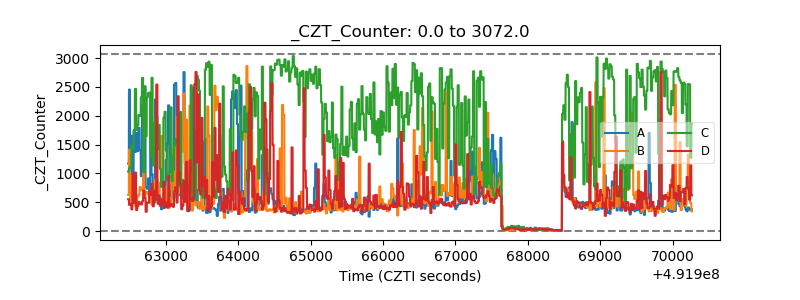 |
| +2.5 Volts monitor |  |
| +5 Volts monitor |  |
| _ROLL_ROT | 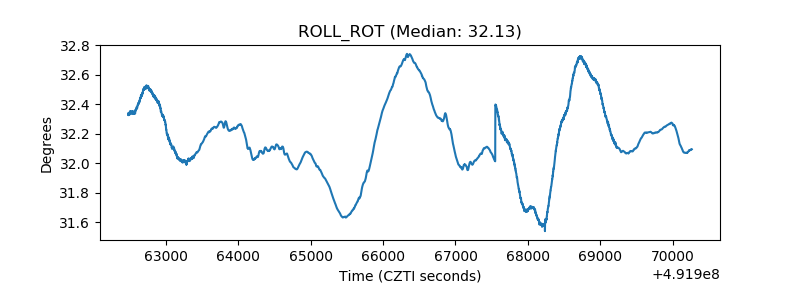 |
| _Roll_DEC | 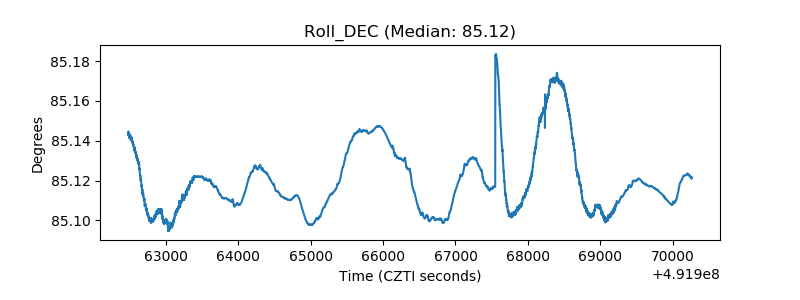 |
| _Roll_RA | 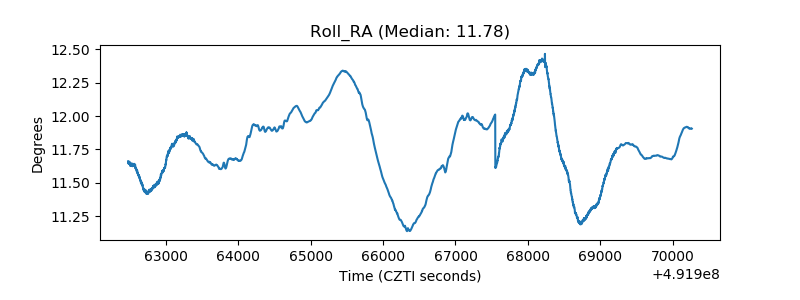 |
| Veto Counter | 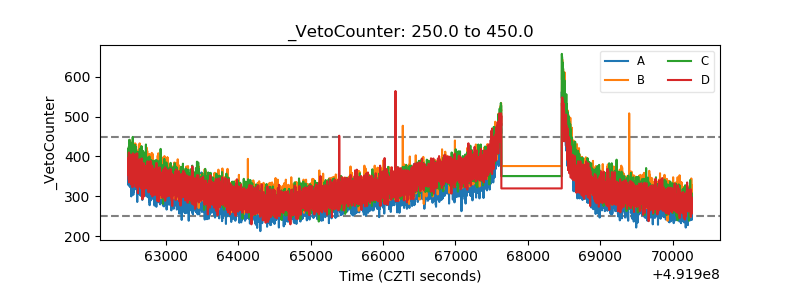 |