| Param | Original file | Final file |
|---|---|---|
| Filename | modeM0/AS1C09_011T08_9000006492_53285cztM0_level2.fits | modeM0/AS1C09_011T08_9000006492_53285cztM0_level2_quad_clean.evt |
| Size (bytes) | 731,934,720 | 88,225,920 |
| Size | 698.0 MB | 84.1 MB |
| Events in quadrant A | 3,450,021 | 643,521 |
| Events in quadrant B | 4,301,674 | 683,106 |
| Events in quadrant C | 14,457,642 | 278,690 |
| Events in quadrant D | 4,346,184 | 581,975 |
| Mode M0 | |||
|---|---|---|---|
| Quadrant | BADHDUFLAG | Total packets | Discarded packets |
| A | 0 | 15566 | 1 |
| B | 0 | 17945 | 1 |
| C | 0 | 47663 | 1 |
| D | 0 | 18077 | 1 |
| Mode M9 | |||
|---|---|---|---|
| Quadrant | BADHDUFLAG | Total packets | Discarded packets |
| A | 0 | 2 | 0 |
| B | 0 | 2 | 0 |
| C | 0 | 2 | 0 |
| D | 0 | 2 | 0 |
| Mode SS | |||
|---|---|---|---|
| Quadrant | BADHDUFLAG | Total packets | Discarded packets |
| A | 0 | 142 | 0 |
| B | 0 | 142 | 0 |
| C | 0 | 142 | 0 |
| D | 0 | 142 | 0 |
| Quadrant | Total seconds | Saturated seconds | Saturation percentage |
|---|---|---|---|
| A | 6939 | 120 | 1.729356% |
| B | 6939 | 265 | 3.818994% |
| C | 6940 | 4195 | 60.446686% |
| D | 6940 | 213 | 3.069164% |
Noise dominated data is calculated using 1-second bins in cleaned event files. If a bin has >2000 counts, and if more than 50% of those come from <1% of pixels, then it is considered to be noise-dominated and hence unusable.
| Quadrant | # 1 sec bins | Bins with >0 counts | Bins with >2000 counts | High rate bins dominated by noise | Noise dominated (total time) | Noise dominated (detector-on time) | Marked lightcurve |
|---|---|---|---|---|---|---|---|
| A | 7184 | 6940 | 42 | 42 | 0.58% | 0.61% | 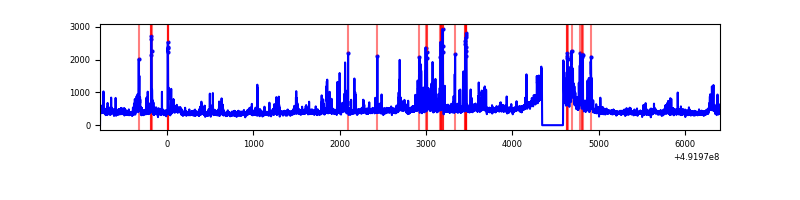 |
| B | 7184 | 6940 | 136 | 136 | 1.89% | 1.96% | 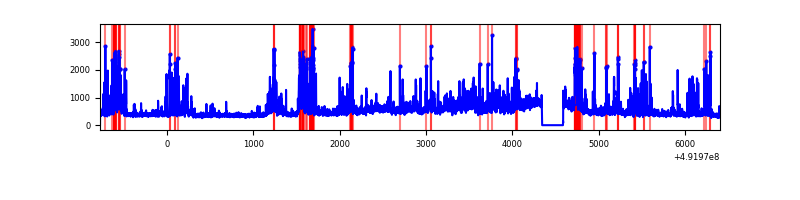 |
| C | 7185 | 6941 | 4282 | 4282 | 59.60% | 61.69% | 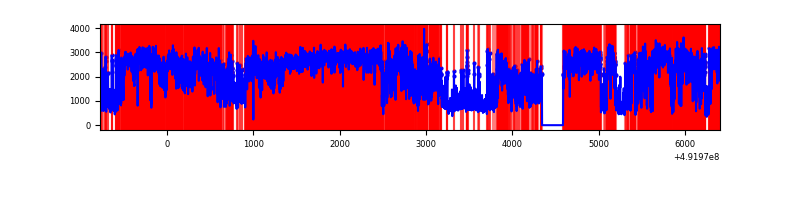 |
| D | 7185 | 6941 | 201 | 201 | 2.80% | 2.90% | 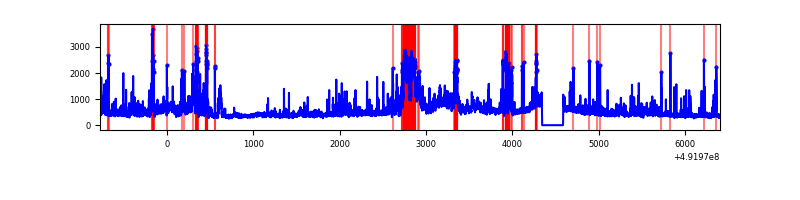 |
Top three noisy pixels from each quadrant. If the there are fewer than three noisy pixels in the level2.evt file, extra rows are filled as -1
| Pixel properties | Quadrant properties | ||||||
|---|---|---|---|---|---|---|---|
| Quadrant | DetID | PixID | Counts | Sigma | Mean | Median | Sigma |
| A | 12 | 115 | 128227 | 722.38 | 713 | 694 | 176.5 |
| A | 4 | 249 | 120877 | 680.75 | 713 | 694 | 176.5 |
| A | 3 | 27 | 77280 | 433.8 | 713 | 694 | 176.5 |
| B | 2 | 249 | 474931 | 3202.39 | 705 | 681 | 148.1 |
| B | 10 | 28 | 188635 | 1269.17 | 705 | 681 | 148.1 |
| B | 0 | 213 | 172894 | 1162.87 | 705 | 681 | 148.1 |
| C | 1 | 241 | 8250736 | 61946.74 | 479 | 474 | 133.2 |
| C | 15 | 224 | 1066386 | 8003.35 | 479 | 474 | 133.2 |
| C | 10 | 22 | 764826 | 5739.1 | 479 | 474 | 133.2 |
| D | 11 | 245 | 678111 | 3463.06 | 686 | 654 | 195.6 |
| D | 3 | 12 | 260648 | 1329.05 | 686 | 654 | 195.6 |
| D | 12 | 3 | 174354 | 887.93 | 686 | 654 | 195.6 |
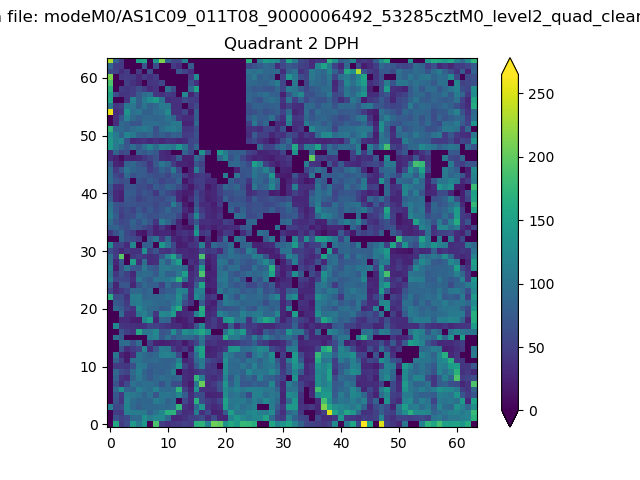
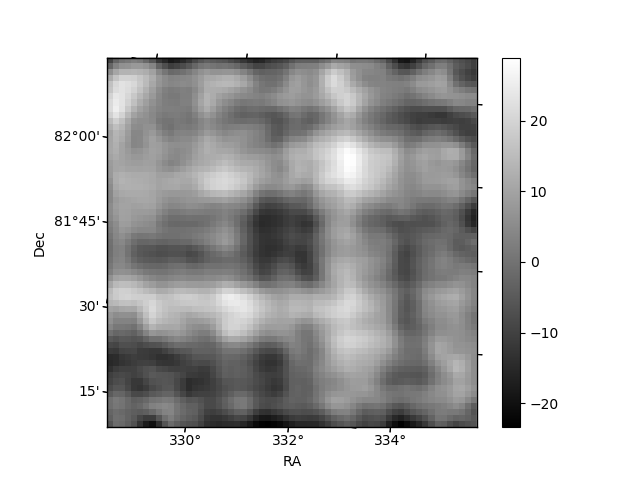
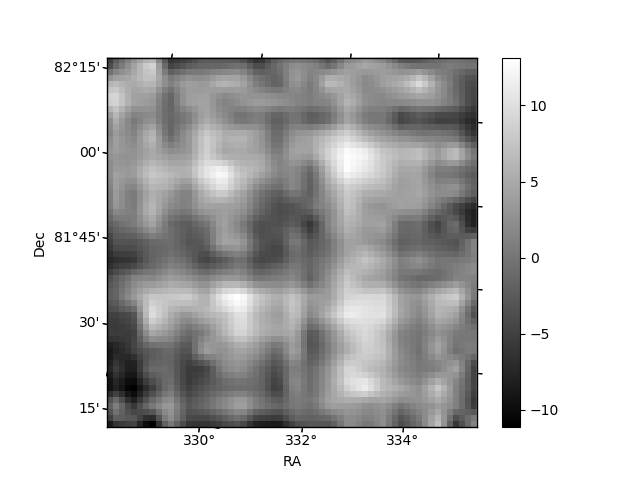
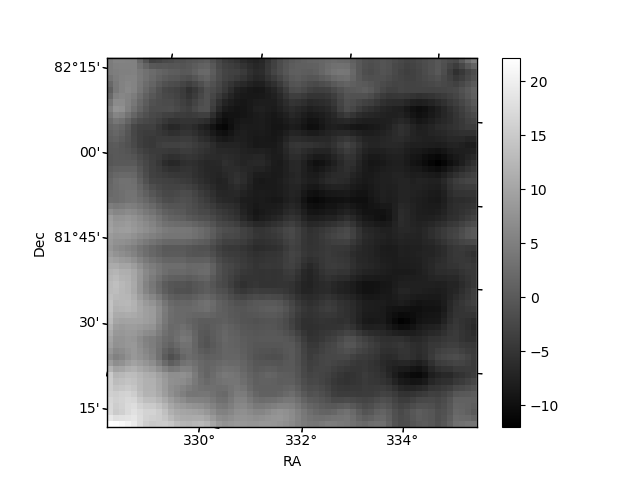
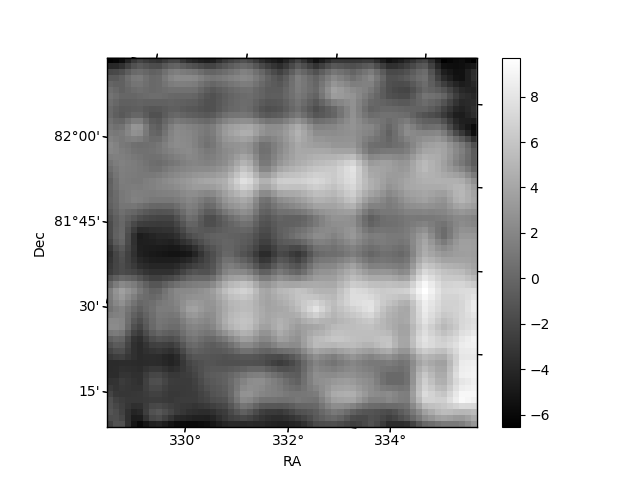
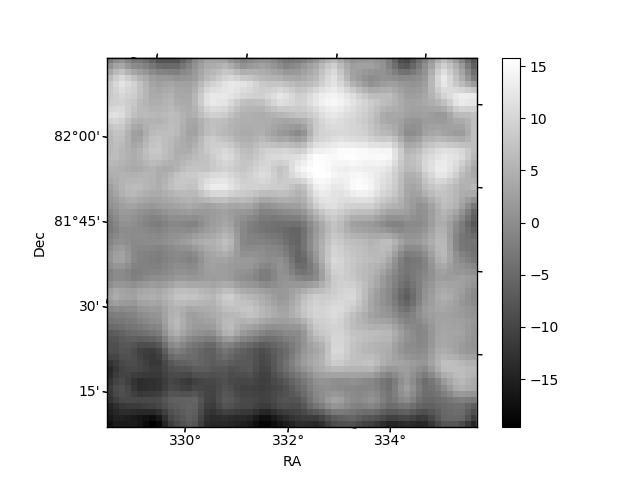
Histogram calculated using DETX and DETY for each event in the final _common_clean file
| Quadrant A | 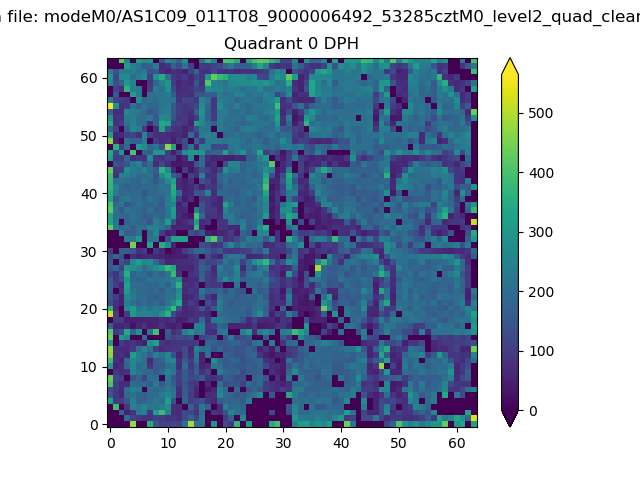 |
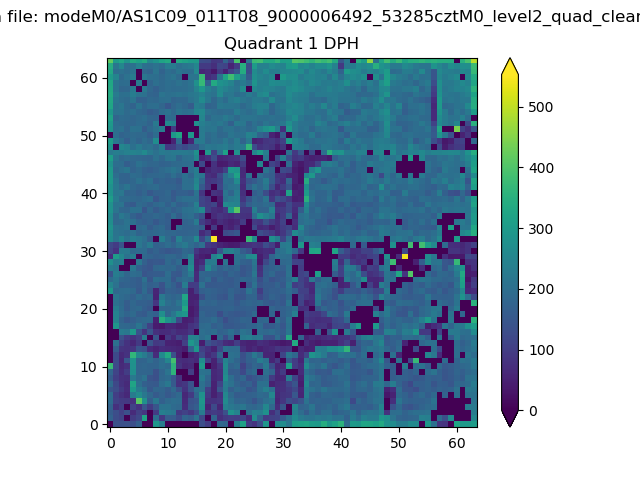 |
Quadrant B |
|---|---|---|---|
| Quadrant D | 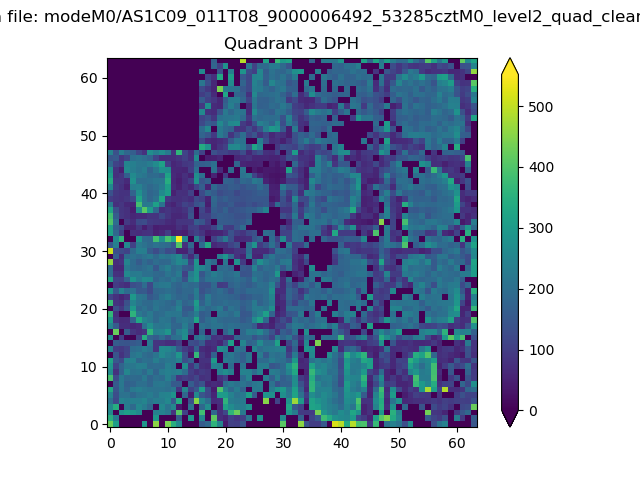 |
 |
Quadrant C |
| Plot type | Count rate plots | Images |
|---|---|---|
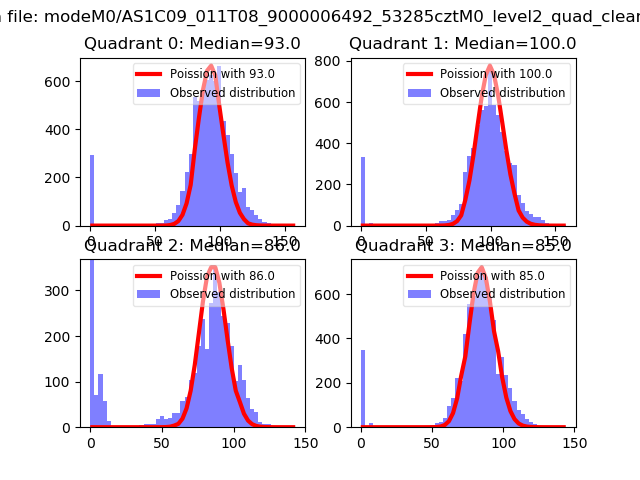
| Comparison with Poisson distribution Blue bars denote a histogram of data divided into 1 sec bins. Red curve is a Poisson curve with rate = median count rate of data. |
 |
 |
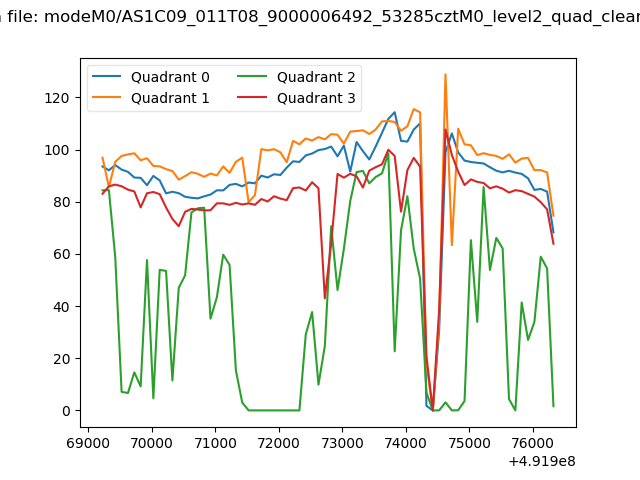
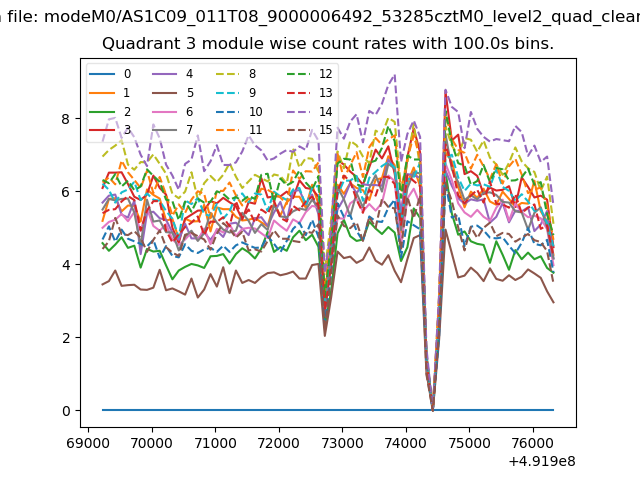
| Quadrant-wise count rates Data is divided into 100 sec bins |
 |
|
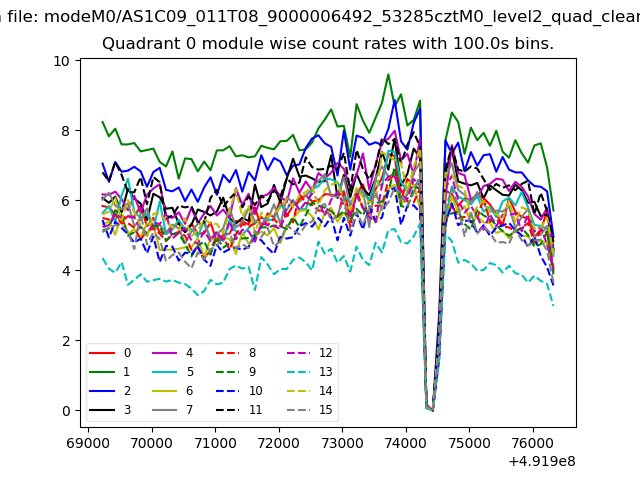
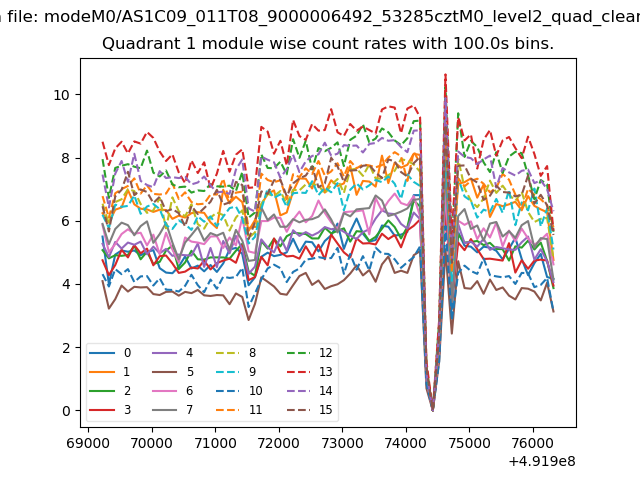
| Module-wise count rates for Quadrant A Data is divided into 100 sec bins |
 |
 |
| Module-wise count rates for Quadrant B Data is divided into 100 sec bins |
 |
 |
| Module-wise count rates for Quadrant C Data is divided into 100 sec bins |
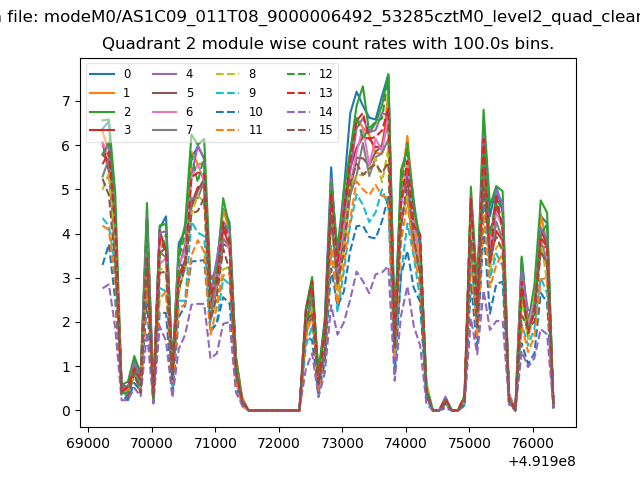 |
 |
| Module-wise count rates for Quadrant D Data is divided into 100 sec bins |
 |
 |
| Parameter | Plot |
|---|---|
| CZT HV Monitor | 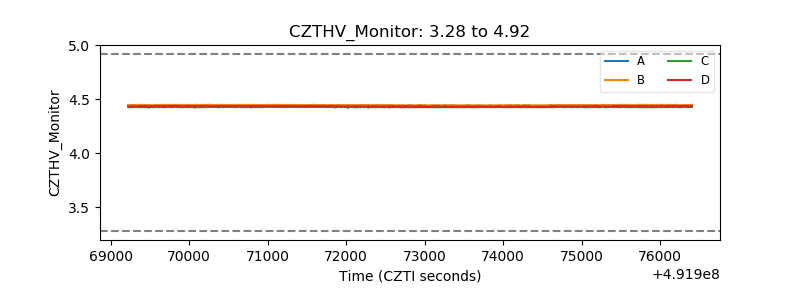 |
| D_VDD | 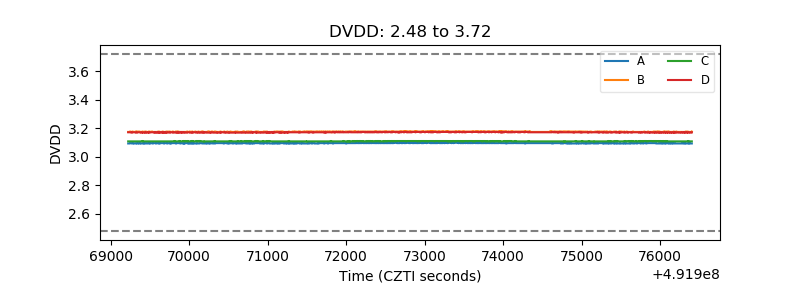 |
| Temperature 1 | 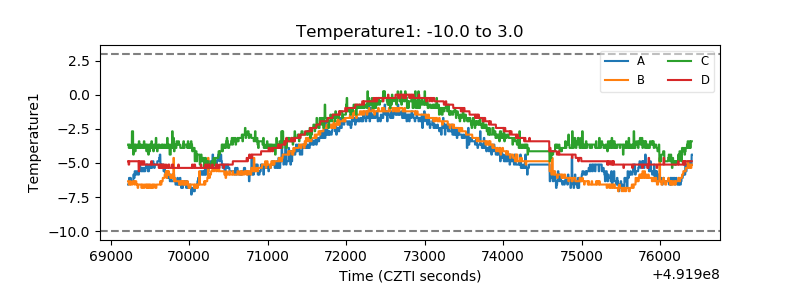 |
| Veto HV Monitor | 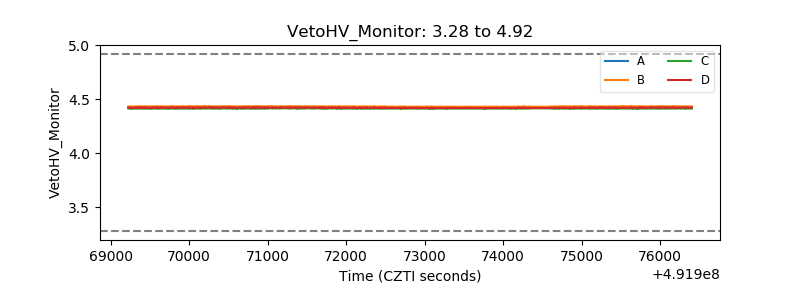 |
| Veto LLD | 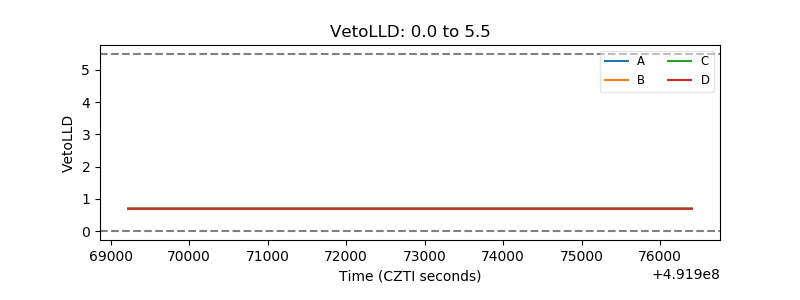 |
| Alpha Counter | 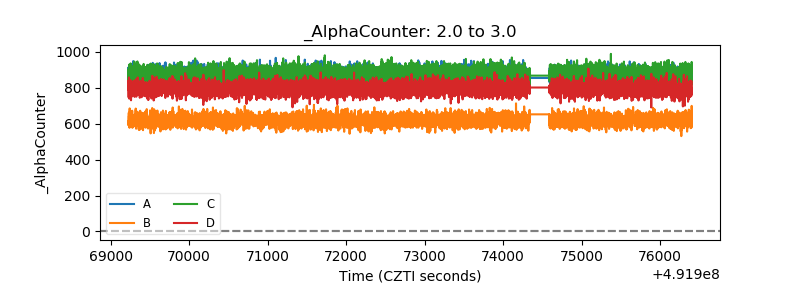 |
| _CPM_Rate | 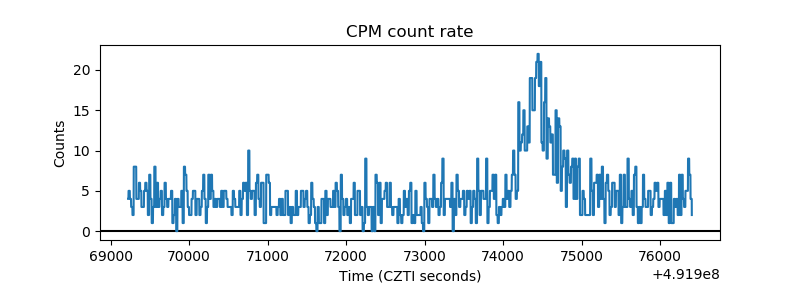 |
| CZT Counter | 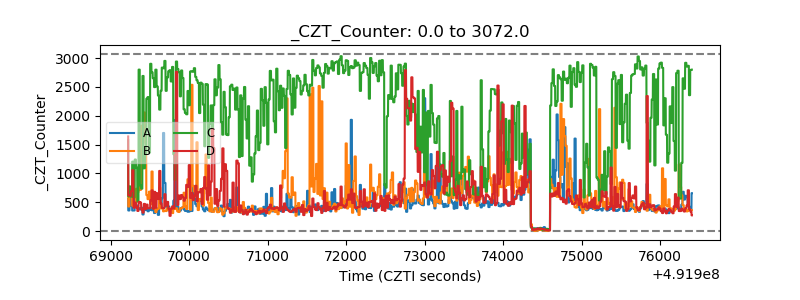 |
| +2.5 Volts monitor |  |
| +5 Volts monitor |  |
| _ROLL_ROT | 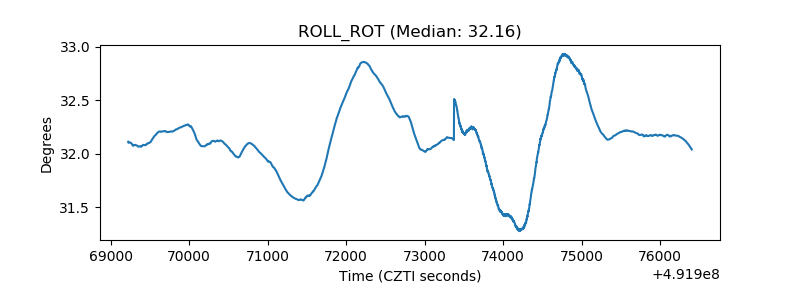 |
| _Roll_DEC | 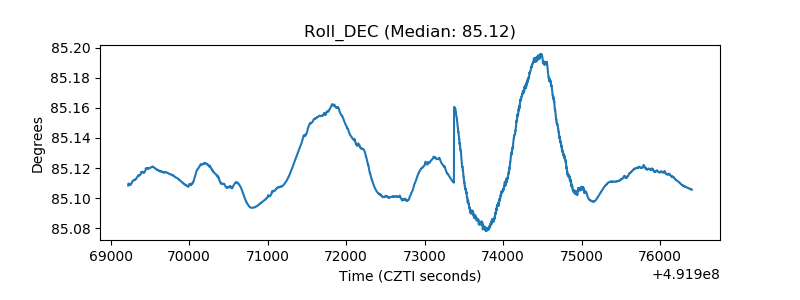 |
| _Roll_RA | 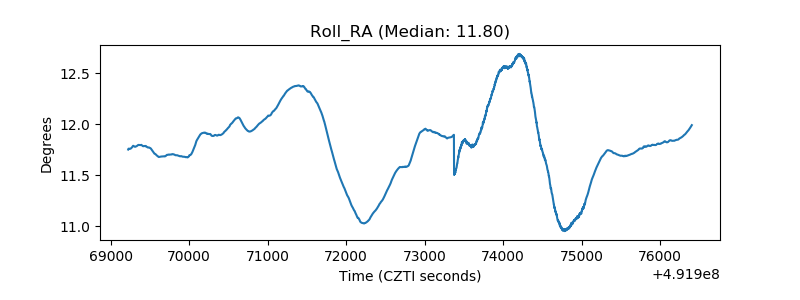 |
| Veto Counter | 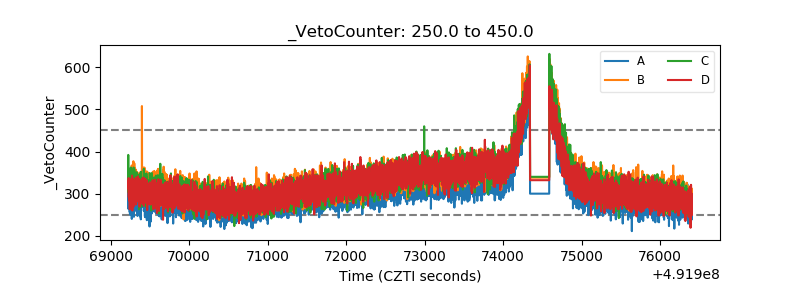 |