| Param | Original file | Final file |
|---|---|---|
| Filename | modeM0/AS1C09_011T08_9000006492_53286cztM0_level2.fits | modeM0/AS1C09_011T08_9000006492_53286cztM0_level2_quad_clean.evt |
| Size (bytes) | 814,959,360 | 83,064,960 |
| Size | 777.2 MB | 79.2 MB |
| Events in quadrant A | 3,329,438 | 652,430 |
| Events in quadrant B | 5,213,886 | 678,664 |
| Events in quadrant C | 17,487,020 | 96,546 |
| Events in quadrant D | 3,588,968 | 595,597 |
| Mode M0 | |||
|---|---|---|---|
| Quadrant | BADHDUFLAG | Total packets | Discarded packets |
| A | 0 | 15154 | 0 |
| B | 0 | 20551 | 0 |
| C | 0 | 56557 | 0 |
| D | 0 | 15842 | 0 |
| Mode SS | |||
|---|---|---|---|
| Quadrant | BADHDUFLAG | Total packets | Discarded packets |
| A | 0 | 142 | 0 |
| B | 0 | 142 | 0 |
| C | 0 | 142 | 0 |
| D | 0 | 142 | 0 |
| Quadrant | Total seconds | Saturated seconds | Saturation percentage |
|---|---|---|---|
| A | 7056 | 26 | 0.368481% |
| B | 7057 | 393 | 5.568939% |
| C | 7057 | 6114 | 86.637381% |
| D | 7057 | 56 | 0.793538% |
Noise dominated data is calculated using 1-second bins in cleaned event files. If a bin has >2000 counts, and if more than 50% of those come from <1% of pixels, then it is considered to be noise-dominated and hence unusable.
| Quadrant | # 1 sec bins | Bins with >0 counts | Bins with >2000 counts | High rate bins dominated by noise | Noise dominated (total time) | Noise dominated (detector-on time) | Marked lightcurve |
|---|---|---|---|---|---|---|---|
| A | 7056 | 7056 | 15 | 15 | 0.21% | 0.21% | 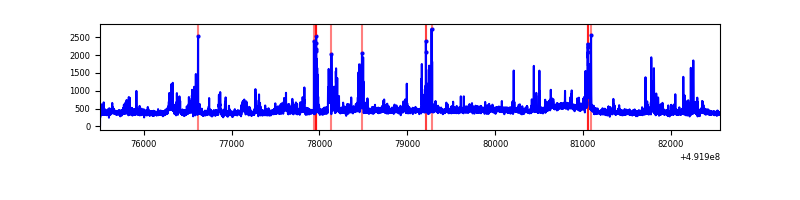 |
| B | 7057 | 7057 | 194 | 194 | 2.75% | 2.75% | 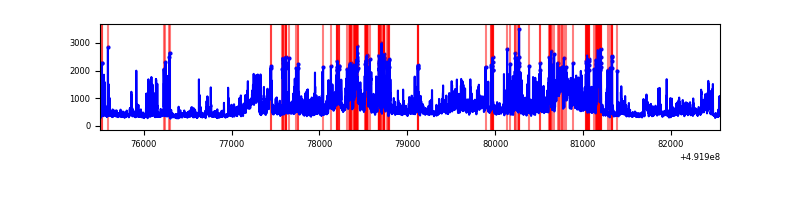 |
| C | 7057 | 7057 | 6074 | 6074 | 86.07% | 86.07% | 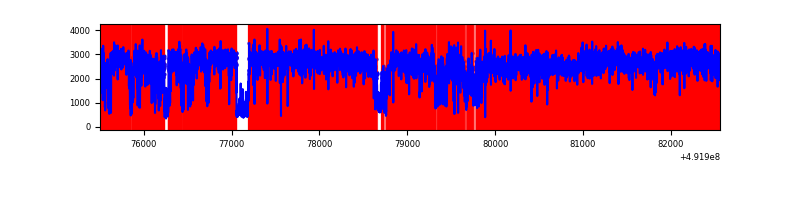 |
| D | 7057 | 7057 | 52 | 52 | 0.74% | 0.74% | 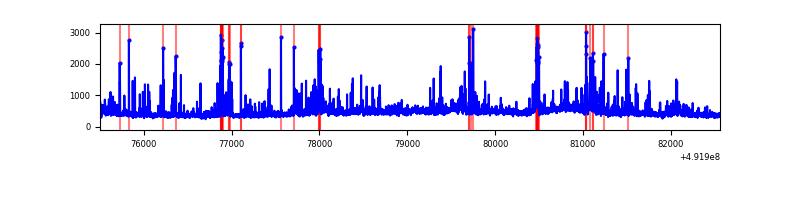 |
Top three noisy pixels from each quadrant. If the there are fewer than three noisy pixels in the level2.evt file, extra rows are filled as -1
| Pixel properties | Quadrant properties | ||||||
|---|---|---|---|---|---|---|---|
| Quadrant | DetID | PixID | Counts | Sigma | Mean | Median | Sigma |
| A | 7 | 206 | 156095 | 865.77 | 721 | 702 | 179.5 |
| A | 3 | 27 | 64928 | 357.84 | 721 | 702 | 179.5 |
| A | 4 | 159 | 54381 | 299.07 | 721 | 702 | 179.5 |
| B | 10 | 28 | 1404742 | 9260.83 | 710 | 685 | 151.6 |
| B | 4 | 81 | 253292 | 1666.14 | 710 | 685 | 151.6 |
| B | 2 | 249 | 201259 | 1322.94 | 710 | 685 | 151.6 |
| C | 1 | 241 | 12748878 | 139028.42 | 332 | 330 | 91.7 |
| C | 15 | 178 | 1174793 | 12808.03 | 332 | 330 | 91.7 |
| C | 15 | 224 | 1096286 | 11951.87 | 332 | 330 | 91.7 |
| D | 3 | 12 | 151253 | 755.55 | 701 | 672 | 199.3 |
| D | 12 | 3 | 144074 | 719.53 | 701 | 672 | 199.3 |
| D | 2 | 249 | 113336 | 565.3 | 701 | 672 | 199.3 |
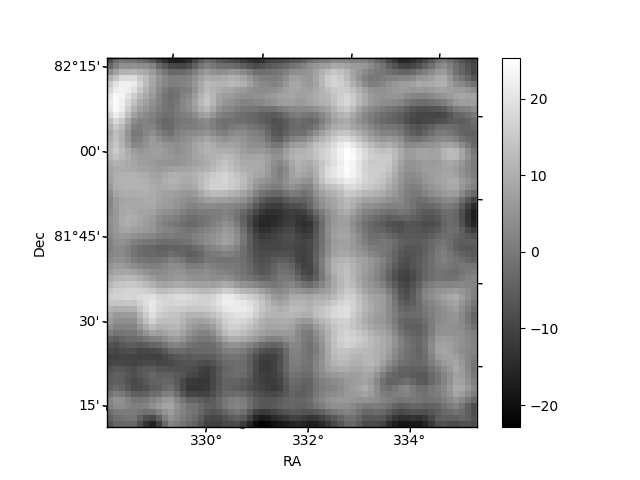
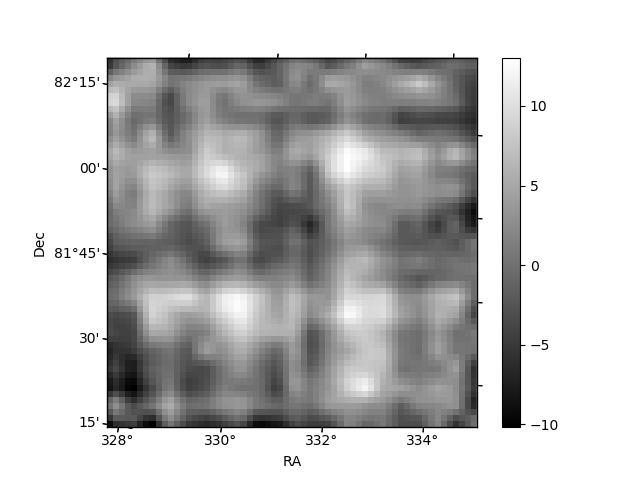
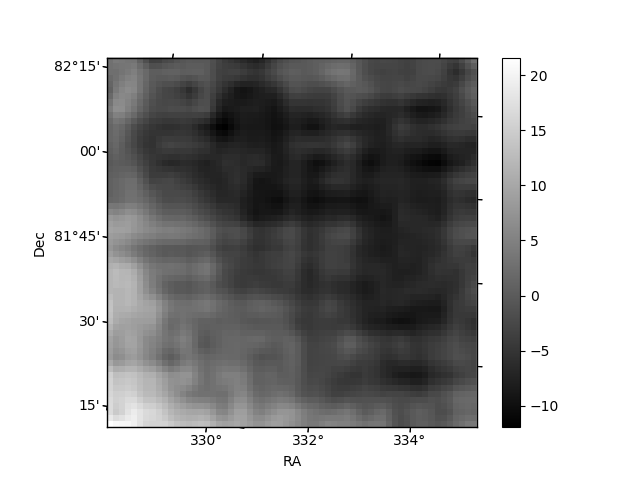
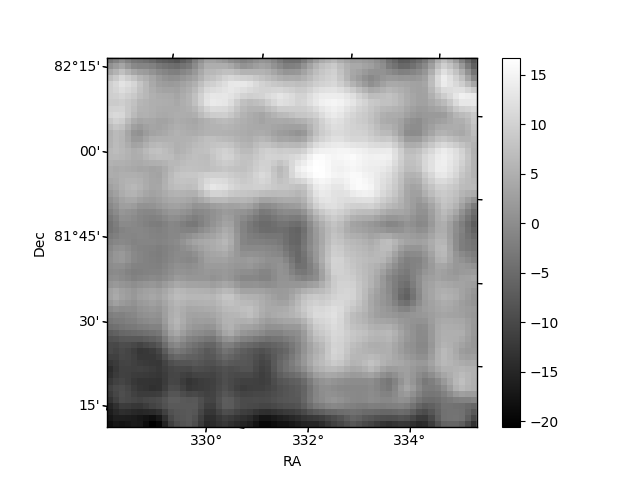
Histogram calculated using DETX and DETY for each event in the final _common_clean file
| Quadrant A | 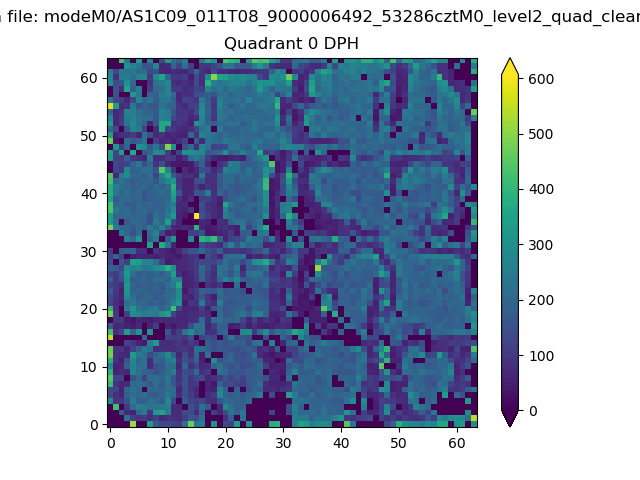 |
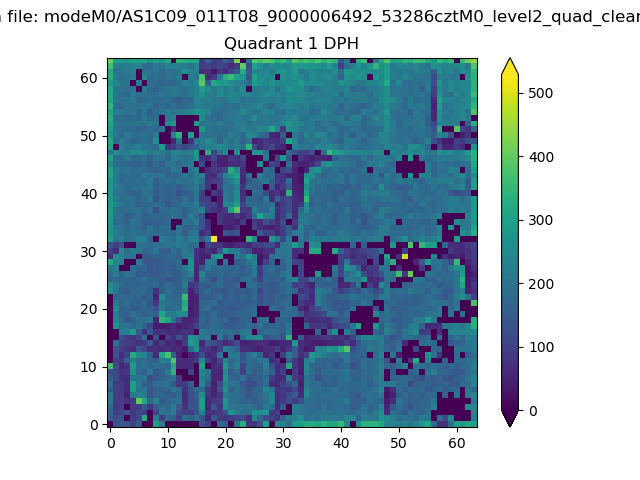 |
Quadrant B |
|---|---|---|---|
| Quadrant D | 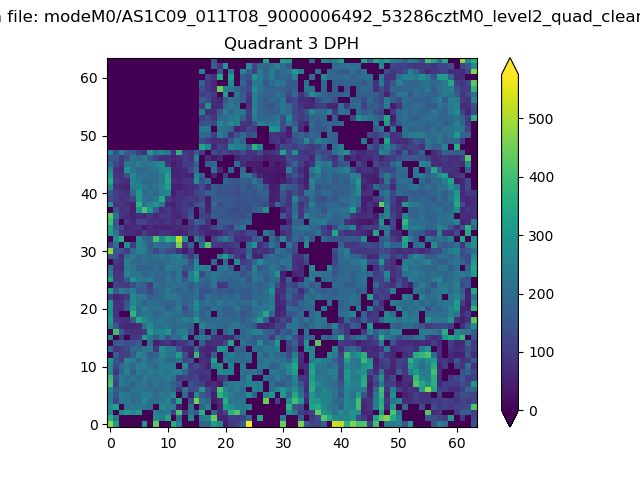 |
 |
Quadrant C |
| Plot type | Count rate plots | Images |
|---|---|---|
| Comparison with Poisson distribution Blue bars denote a histogram of data divided into 1 sec bins. Red curve is a Poisson curve with rate = median count rate of data. |
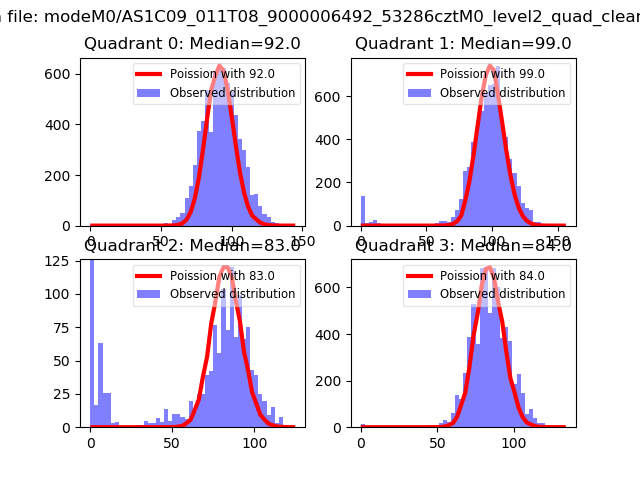 |
 |
| Quadrant-wise count rates Data is divided into 100 sec bins |
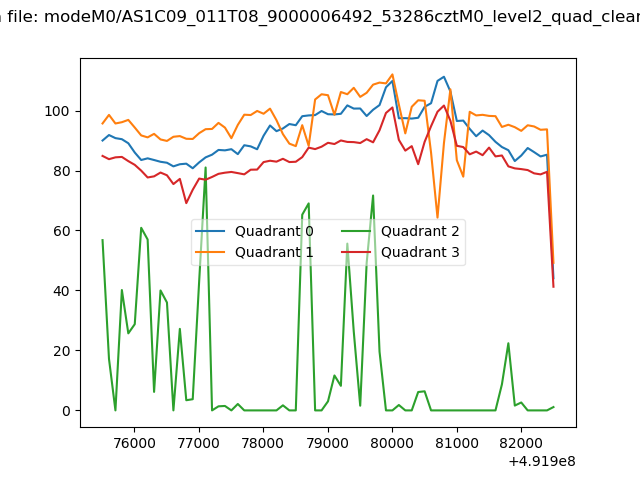 |
|
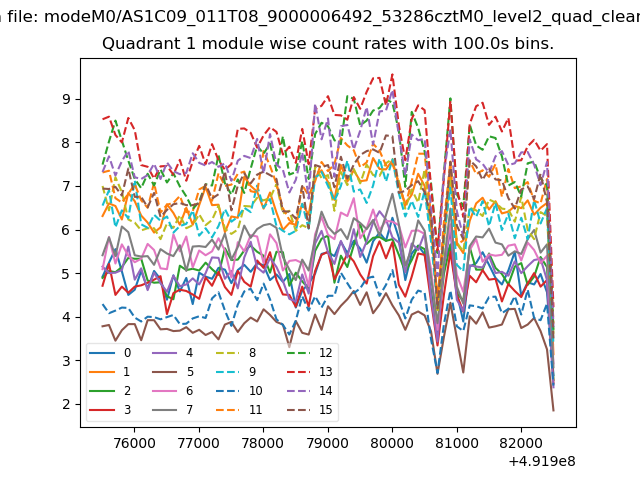
| Module-wise count rates for Quadrant A Data is divided into 100 sec bins |
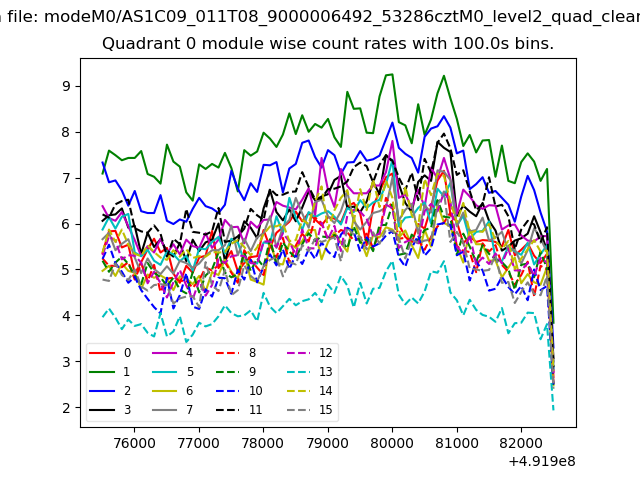 |
 |
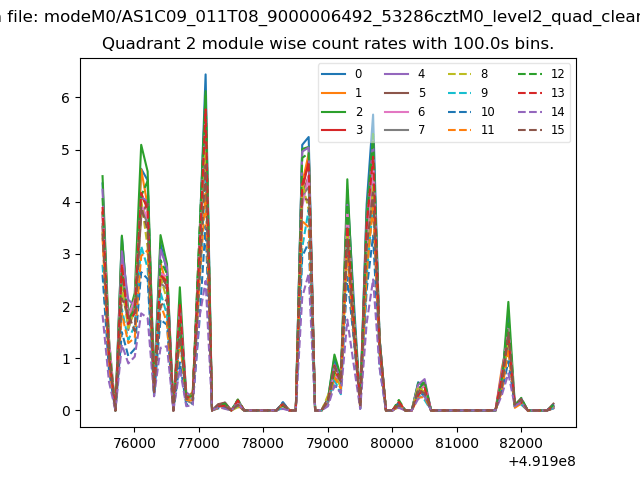
| Module-wise count rates for Quadrant B Data is divided into 100 sec bins |
 |
 |
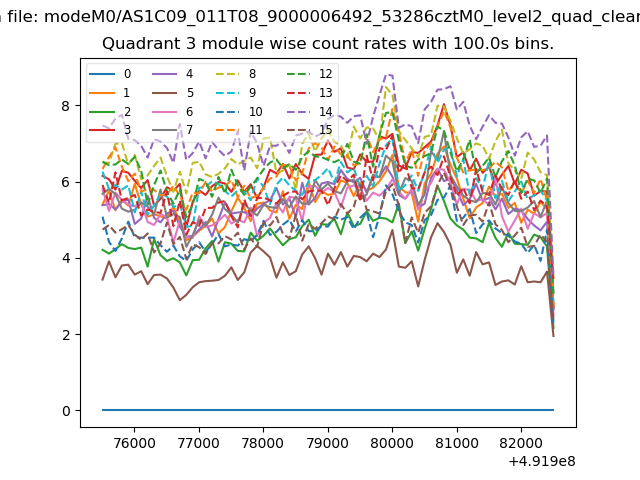
| Module-wise count rates for Quadrant C Data is divided into 100 sec bins |
 |
 |
| Module-wise count rates for Quadrant D Data is divided into 100 sec bins |
 |
 |
| Parameter | Plot |
|---|---|
| CZT HV Monitor |  |
| D_VDD | 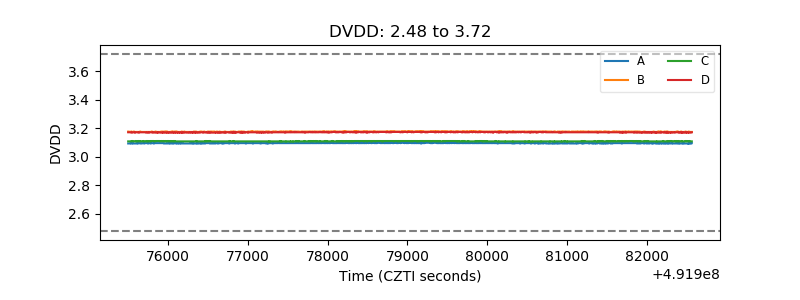 |
| Temperature 1 | 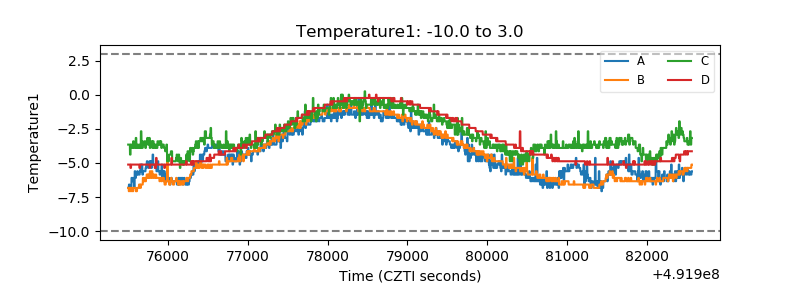 |
| Veto HV Monitor | 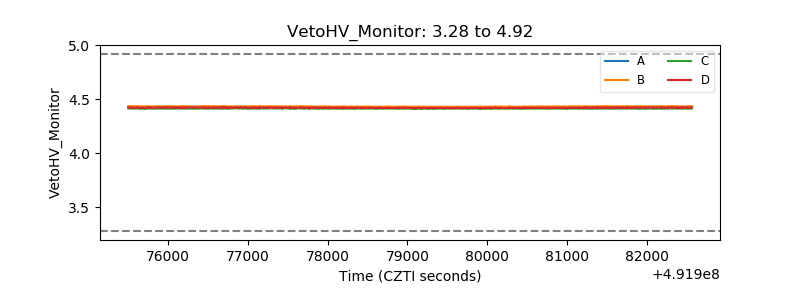 |
| Veto LLD | 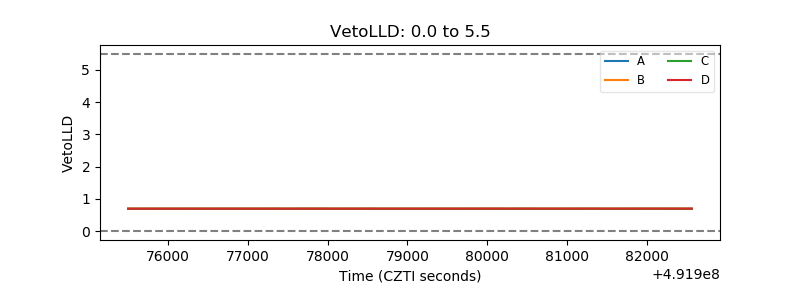 |
| Alpha Counter | 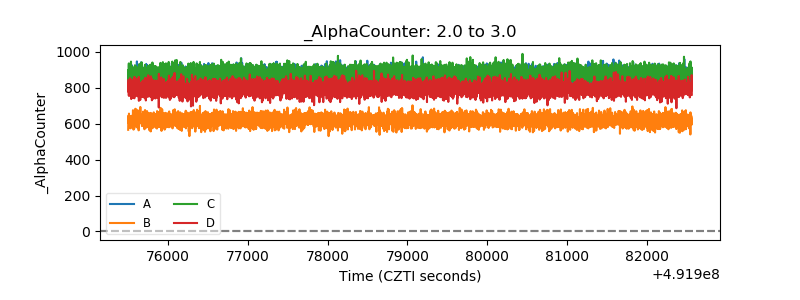 |
| _CPM_Rate | 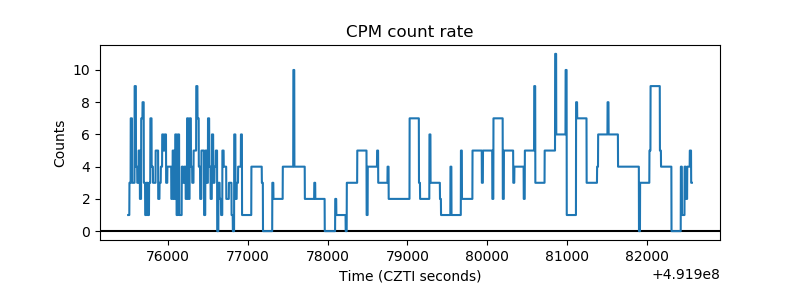 |
| CZT Counter | 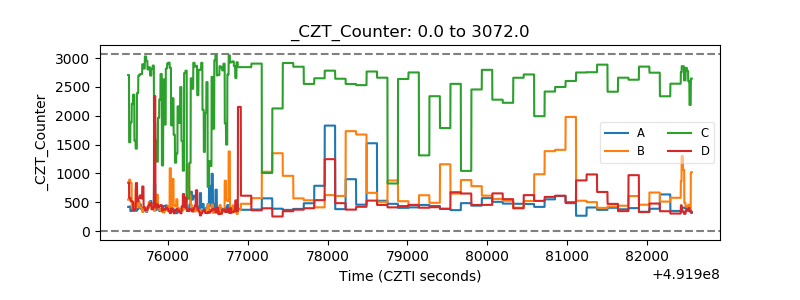 |
| +2.5 Volts monitor |  |
| +5 Volts monitor |  |
| _ROLL_ROT | 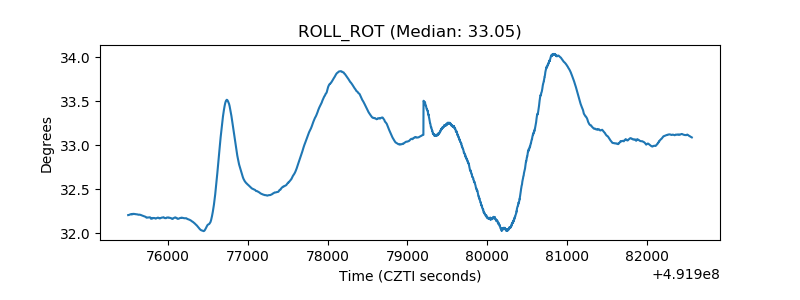 |
| _Roll_DEC | 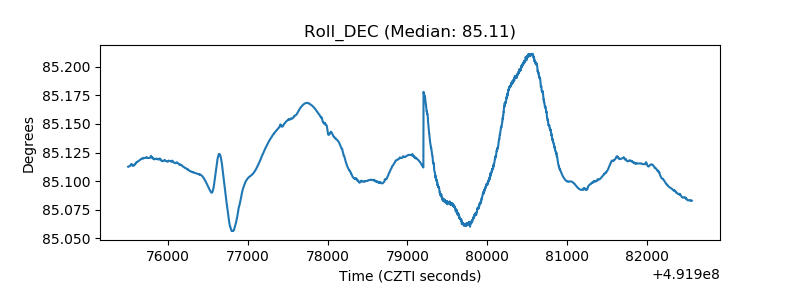 |
| _Roll_RA | 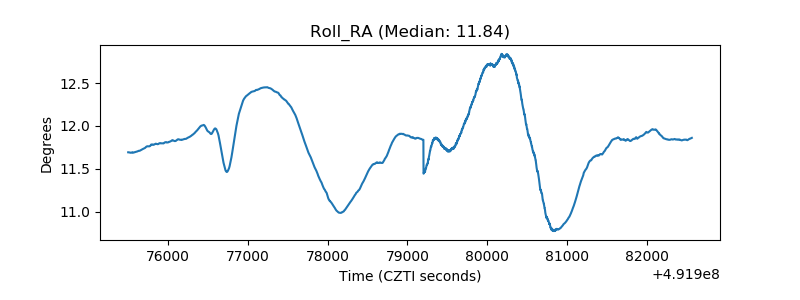 |
| Veto Counter | 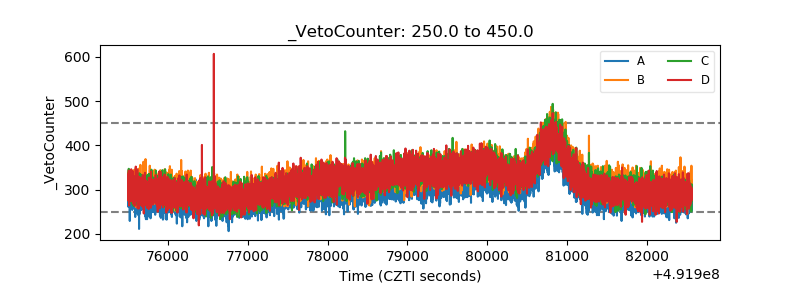 |